The impact of contact effort on mode-specific selection and measurement bias
Cobben, F., Schouten B., & Van der Laan J. (2014). The impact of contact effort on mode-specific selection and measurement bias, Survey Methods: Insights from the Field. Retrieved from https://surveyinsights.org/?p=3629
© the authors 2014. This work is licensed under a Creative Commons Attribution 4.0 International License (CC BY 4.0) 
Abstract
In 2011, a large-scale mixed-mode experiment was linked to the Crime Victimisation Survey (CVS). This experiment consisted of a randomized allocation of sample persons to the four contemporary survey modes Web, mail, telephone and face-to-face, and a follow-up using only interviewer modes. The aim of the experiment was to disentangle mode-specific selection- and measurement bias. In a previous paper (Schouten et al 2013), mode-specific selection and measurement biases were reported for a large number of key variables from the CVS and the Labour Force Survey. This paper is a follow-up to that study and investigates the size of the selection and measurement biases as a function of contact effort, where contact effort refers to the number of telephone calls, the number of face-to-face visits and the number of reminders in Web and mail. In the analyses, face-to-face response based on a maximum of six visits, the default face-to-face strategy at Statistics Netherlands, is used as the benchmark. The analyses show that contact effort has little impact on the size of measurement bias and a modest impact on the size of selection bias. From the results, it is therefore concluded that contact effort is not a strong common cause of nonresponse and measurement error.
Keywords
common causes, level of effort, mixed-mode surveys, total survey error
Copyright
© the authors 2014. This work is licensed under a Creative Commons Attribution 4.0 International License (CC BY 4.0)
1. Introduction
In this paper, we investigate contact effort as a common cause for nonresponse bias and measurement error. Common causes are underlying reasons and motives that affect both types of error, while separate causes affect only one of the two errors. It is important to understand common causes, as efforts to reduce one of the two biases may be counterbalanced by an increase of the other bias. A simple example of a common cause is topic interest. Persons that have no interest in the topic are likely to have a higher probability to refuse participation, but, if they do respond, also, in general, have a higher probability of being less motivated and concentrated during the interview. The terminology, separate causes and common causes, was put forward by Groves (2006) and Olson (2007). Olson (2013) gives a recent overview of empirical evidence in the survey literature about common causes. Since contact effort cannot be viewed independently from the survey mode that is employed, we investigate the impact of contact effort separately for each of the main survey modes Web, mail, telephone and face-to-face.
A surrogate that is often used for respondent motivation is the level of effort required to get a response. It is conjectured that hard to get respondents are less motivated and would produce more measurement error. The level of effort is traditionally applied to interviewer-administered surveys where effort has two clearly distinct dimensions: making contact and obtaining participation. Making contact is reflected by the number and timing of calls or visits to the address. Obtaining participation corresponds to refusal conversion efforts by interviewers, the use of incentives and follow-up waves to nonrespondents employing for instance shorter, condensed questionnaires. In interviewer-administered surveys one may, therefore, distinguish contact effort and refusal conversion effort as two components of a general level of effort. For Web and mail, the level of effort does not have this clear distinction in contact and participation as there is usually no in-person contact and the response process is mostly unobserved. One may argue that contact can be defined as a sample person reading the survey invitation letter or viewing the survey questionnaire website, but both events normally take place outside the view of the survey institute. The level of effort in the self-administered modes is thus a mix of contact effort and refusal conversion effort that cannot easily be disentangled. The level of effort is reflected by the type, timing, number and content of reminders to the sample addresses.
In this paper, we limit ourselves to contact effort. In the experimental data that we will employ the type and content of reminders was not varied, and no special refusal conversion attempts were made other than making appointments for another, more convenient time. Refusal conversion by use of follow-up waves, incentives or condensed questionnaires is not standard practice at Statistics Netherlands; once a person or household refuses explicitly, then no further call or visit is made. We are, however, able to investigate the impact of the number of reminders and the number of telephone and face-to-face calls on nonresponse and measurement bias. We refer to these collectively as contact effort, despite the fact that in self-administered modes a reminder may also be perceived as a refusal conversion attempt.
The research question that we aim to answer is: Do higher levels of contact effort in any of the contemporary modes impact selection and measurement bias simultaneously? We conjecture that contact effort is not a common cause for interviewer-administered surveys as the sampled persons are mostly unaware of the contact efforts. For the self- administered surveys, we conjecture that contact effort is a common cause but with a relatively small impact as the reminders may only have been noted by some of the respondents. This research question is not merely of theoretical interest; the answer to the research question helps improve mixed-mode survey design and estimation. Any interaction between the two types of bias complicates tactics to reduce nonresponse, complicates strategies to tailor design to the respondent through adaptive survey design, and leads to constant small method effects in time series when the shares of modes in the overall response vary in time. A confirmation of the conjectures is thus very useful.
In regular data collection work, it is impossible to disentangle mode-specific selection and measurement biases, which is needed to investigate simultaneous changes as a function of contact effort. When a difference between modes is observed, it is often not possible to determine what part of the difference is caused by a different selection of respondents, and what part of the difference can be attributed to different measurement processes between modes. Separation of selection bias from measurement bias in empirical studies requires carefully designed experiments in combination with weighting or regression based inference methods to control for selection effects, see Jäckle et al. (2010), Vannieuwenhuyze, Loosveldt and Molenberghs (2010 and 2012), Vannieuwenhuyze and Loosveldt (2013), Klausch, Hox and Schouten (2013 and 2014) and Schouten, Van den Brakel, Buelens, Van der Laan and Klausch (2013). Here, we make use of the mode experiment that is also employed in Schouten et al (2013) and Klausch, et al (2013 and 2014).
It is important to remark that contact effort between the self-administered modes, telephone and face-to-face cannot and should not be compared directly as they refer to completely different processes that also have very different costs associated with them. A person may be very hard to reach by phone or at the door but may read his or her mail very frequently and thoroughly. The costs for one invitation letter or reminder in Web and mail and the costs for one failed phone call attempt are much lower than the costs for one failed visit to an address. Mail and telephone are roughly twice as expensive as Web per “contact attempt”, while a face-to-face visit (apart from the interview itself) is roughly ten times as expensive as a Web “contact attempt”. See for instance Calinescu and Schouten (2013) for cost estimates of various mode designs. In this paper, we merely present results for all modes simultaneously because they were all part of the same experiment and since we use one of them, face-to-face, as the benchmark mode.
This paper is outlined as follows. In section 2, we present the experiment and the data that are used for the analyses in more detail. In sections 3, we answer the main research question. In section 4, we summarize findings and make recommendations for mixed-mode survey methodology.
2. The Crime Victimisation Survey experiment
In this section, we describe the experimental design and discuss the validity of assumptions that allow for a decomposition of mode effects.
2.1 The experimental design
From March to June 2011, a large scale mode experiment was performed by Statistics Netherlands to disentangle mode effects for telephone, Web, mail and face-to-face survey modes. The experiment was linked to the Crime Victimisation Survey (CVS), but also target variables from the Labour Force Survey (LFS) were considered. The project was initiated as a result of large mode effects in the CVS, see Buelens and Van den Brakel (2011). Furthermore, the CVS questionnaire contains a variety of survey modules and items that were conjectured to arouse various forms of mode-specific response styles.
The experiment consisted of two waves. For the first wave, respondents were randomly assigned to the four different survey modes. For the second wave of the survey, both wave 1 respondents and nonrespondents were again approached, except for nonresponse due to language, physical or mental problems (not able categories) and due to changes of address of residence outside the interviewer region. A total of 9.9% of the nonresponse (5.8% of the eligible sample) was not approached in wave 2, because they constituted persistent reasons for nonresponse, e.g. language problems, physical problems and mental problems. The available budget for the experiment was not large enough to cover a full CAPI follow-up in wave 2. For this reason, a random selection of sample cases was assigned to CATI in wave 2. A majority of 77% of the sampled persons were allocated to CAPI in the second wave. The allocation was based on the availability of a registered phone number. When a sample person had a registered telephone number (77% of the cases), then the allocation to CATI or CAPI was random with probabilities 70% to CAPI and 30% to CATI. Sampled persons without a registered number were always allocated to CAPI. The CAPI-CATI distribution was chosen such that the impact of mode differences between CATI and CAPI in wave 2 on the mode effect decomposition for wave 1 was anticipated to be much smaller than the sampling errors. Evaluations afterwards confirmed this expectation. Figure 1 presents the design of the experiment.
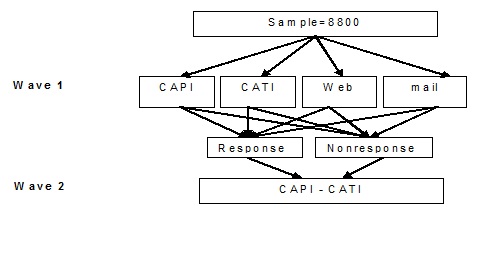
Figure 1: Design of the experiment
In Table 1 the sample sizes and the response to both waves of the experiment are displayed. For CAPI and Web the response rate to wave 1 was close to the anticipated response rate. A remarkable high response was obtained for mail and for CATI.
Table 1: Sample sizes and response rates to wave 1, wave 2 and both waves. The projected wave 1 response rate is also given.
|
CAPI |
CATI |
|
Web |
Total |
|
| Sample size |
2182 |
2200 |
2200 |
2199 |
8781 |
| Wave 1 response |
61% |
45% |
49% |
29% |
46% |
| Expected wave 1 response |
58% |
38% |
40% |
29% |
|
| Wave 2 response |
49% |
47% |
50% |
49% |
49% |
| Response to both waves |
43% |
32% |
33% |
20% |
32% |
The questionnaire for the first wave consisted of questions from the CVS as well as key LFS questions about employment status, whereas the questionnaire for the second wave consisted of a repetition of the key statistics from the CVS and a set of additional questions. The additional questions consisted of various attitudinal questions about safety and politics, about surveys and about Statistics Netherlands, various evaluation questions about wave 1 and questions about access to Web and mode preferences. The attitudinal questions were partly taken from De Leeuw et al (2010) and have a strong resemblance to attitudinal scales presented by Loosveldt and Storms (2008). The questions about access to Web are necessary to identify wave 1 nonrespondents to Web who were not able to respond because of undercoverage. The average length of the regular CVS, wave 1 in the experiment, is approximately 25 minutes in Web and CAPI and approximately 21 minutes in CATI. For mail, no estimates of the length are available. Wave 2 was slightly shorter in length.
We selected a subset of the key LFS and CVS target variables. For the LFS we focus on employment status and highest obtained educational level and for the CVS on number of crimes per 100 inhabitants, being a victim of a crime (yes/no), feeling unsafe at times (yes/no) and an aggregated neighbourhood nuisance scale (five-point). An overview of the selected LFS and CVS variables in the experiment is given in Appendix A.
2.2 Contact effort and mode effect assumptions
Schouten et al (2013) describe the estimation strategy for mode-specific coverage bias, mode-specific nonresponse bias and mode-specific measurement bias. The total bias between a mode and CAPI, i.e. the mode effect, is derived using the parallel samples in the experiment. The mode-specific coverage bias between a mode and CAPI is estimated by the difference between the CAPI response with access to the mode and all CAPI response. The mode-specific nonresponse bias is estimated by weighting the mode wave 1 response that participated also in wave 2, to all wave 2 responses with access to the mode. In the weighting to wave 2, we employed the repeated CVS survey variables and available auxiliary variables from administrative data. The mode-specific measurement bias is the remaining term. The weighting models are given and motivated by Schouten et al (2013).
The experiment allows for the estimation of mode-specific selection- and measurement effects under four assumptions: 1) the mode of wave 1 did not impact the response to wave 2, 2) the mode of wave 1 did not impact the answers given in wave 2, 3) the repeated CVS questions allow for a full adjustment of differences in nonresponse between the modes, and 4) mode effects between the two modes in wave 2 (telephone and face-to-face) are negligible. Schouten et al (2013) give a detailed account of the estimation strategy and analyse the validity of the underlying assumptions. They conclude that there is no evidence that the mode of wave 1 impacted the response or the answering behaviour to wave 2. Table 1 shows that indeed response rates in wave 2 are very similar for all wave 1 groups. They also concluded that the repeated wave 2 questions are generally good predictors of the wave 1 answers so that they are powerful variables in the adjustment for mode-specific nonresponse. Finally, they concluded that the impact of mode effects between CAPI and CATI in wave 2 is much smaller than the sampling variation.
When mode effect decompositions are made as a function of contact effort, as we do in this paper, then the important question is whether these assumptions still hold. In section 3, we evaluate the impact of contact effort by restricting response to one visit (CAPI), one call attempt (CATI) and no reminder (Web and mail), and then adding visits, call attempts and reminders. Assumptions 3 and 4 are not affected by this restriction, but assumptions 1 and 2 can potentially become invalid. This would happen if response and answers to wave 2 would be different if we would really have restricted the contact strategy of wave 1 to fewer visits, call attempts or reminders. For noncontacts in wave 1 such an impact is unlikely, but for respondents or refusals it is imaginable. For instance, if we would have stopped after two CATI call attempts, would a person, that had not yet been contacted, react differently to wave 2 than if we would have proceeded and had contacted this person later on and forced a decision to participate. The validity of assumptions 1 and 2 cannot be tested because contact effort in wave 1 was not randomized; we cannot simulate persons’ reactions to less effort. Since we found no overall impact of mode on wave 2 behaviour, we believe that reduced effort cannot have a large impact. However, since response rates to wave 2 are lower than for CAPI wave 1 (see table 2.1), there seems to be some attrition that can only be caused by wave 1. This attrition means that we have to be careful when drawing strong conclusions about the impact of contact effort.
3. Mode effects as a function of contact effort
In this section, we answer the main research question: Do higher levels of contact effort in any of the contemporary modes impact selection and measurement bias simultaneously? We, first, give some statistics of the contact effort per mode, evaluate the validity of the assumptions underlying the mode effect estimates, and then decompose the mode effect relative to CAPI for different levels of contact effort.
3.1 Contact effort per mode
We measure contact effort by the number contact attempts up and to first contact. For the interviewer-assisted modes CAPI and CATI, the number of calls in the first wave of the experiment is recorded. For the self-administered modes mail and Web the number of reminders is recorded. These measures differ considerably between the four modes and as explained in the introduction it is meaningless to compare them over modes in terms of costs and interpretation. For CAPI, calls reflect house visits made by the field interviewer. The timing and frequency of calls are largely prescribed, but there is some room for the interviewer to choose the contact strategy. For CATI, calls reflect actual phone calls made by the telephone interviewer. The timing and frequency of the calls is determined by the central system that administers calls to interviewers. The distribution of calls/sample elements to interviewers, thus, is random and the interviewer has no influence on the contact strategy.
Reminders are send to those sample elements that are approached with a mail questionnaire or request to fill in the questionnaire on-line. It is not clear whether these reminders are read. Up to two reminders are send. This is very different from the call attempts in either CAPI or CATI.
Table 2: Distribution of call attempts and percentage of the total response realised in each attempt for the different modes in the experiment.
| Number of calls |
CAPI |
CATI |
|
Web |
||||
|
n |
% R |
N |
% R |
n |
% R |
n |
% R |
|
| 0 |
57 |
483 |
0 |
0 |
||||
| 1 |
537 |
13,9% |
493 |
9,7% |
313 |
13,5% |
211 |
8,8% |
| 2 |
641 |
20,5% |
341 |
11,6% |
390 |
15,6% |
218 |
9,5% |
| 3 |
417 |
13,9% |
200 |
6,6% |
1497 |
19,8% |
1770 |
10,4% |
| 4 |
240 |
7,8% |
110 |
3,5% |
||||
| 5 |
121 |
3,4% |
104 |
3,1% |
||||
| 6 |
97 |
1,1% |
71 |
2,2% |
||||
| >6 |
72 |
0,6% |
398 |
8,3% |
||||
| Total |
2182 |
61,3% |
2200 |
45,1% |
2200 |
48,9% |
2199 |
28,7% |
The contact effort per mode is displayed in table 2. For the interviewer-assisted modes there are a number of sample elements that received no calls. These are cases that were not processed in the field due to illness or other exceptional reasons. For CAPI, sample elements called the help desk to state that they did not want to be approached. For CATI, these are mainly sample elements that could not be called because they do not have a listed telephone number. Hence, these are cases of undercoverage. For mail and Web, all sampled elements received an invitation in the mail to either fill in the mail questionnaire or go to a secured Web site to answer the survey questions on-line.
3.2 Mode-specific nonresponse and measurement bias
In this section, following the estimation strategy in Schouten et al (2013), we decompose the mode effect after different numbers of calls, visits and reminders relative to a CAPI approach where the maximum of visits is six. The mode effect is decomposed into a mode-specific coverage bias, a mode-specific nonresponse bias and a mode-specific measurement bias. Since coverage of a mode is independent of the number of calls/visits/reminders, this component will be the same after each call and is, therefore, combined with the nonresponse bias. In the following, we will refer simply to selection bias, but it represents the compound of undercoverage and nonresponse differences. In Schouten, Cobben, Van der Laan and Arends-Tóth (2013) detailed tables of estimates for mode-specific coverage, nonresponse and measurement bias are provided. Here, we display the results graphically and discuss the significance of differences. Standard errors for the mode effect components are estimated using bootstrap resampling procedures.
We estimated the selection bias (the compound of nonresponse and coverage bias), measurement bias and the total mode effect as a function of the number of contact attempts for each of the modes (figures 2 to 4). For the LFS variables (figures 2 and 3) no estimates are given for mail. The LFS questionnaire is complex and has many questions that are conditional on the answers of previous questions. For this reason, the regular LFS does not have a paper version of the questionnaire. The CAPI mode effect decompositions (column 1 of figures 2 to 4) have to be interpreted somewhat differently. In the mode effect decomposition, the mode-specific nonresponse bias is estimated by weighting the sample that responds both to wave 1 in a certain mode and to wave 2, to the full wave 2 response. As a result, some respondents in wave 1 are discarded when they did not respond to wave 2. Although this is a natural choice, for CAPI it implies that the selection bias with respect to itself does not have to be equal to zero. Since the measurement bias is its complement, also this bias does not have to be equal to zero for CAPI. This is an artefact of the estimation method and the distinction between circles and squares is meaningless for CAPI.
For reasons of brevity and overview, we depict the impact of contact effort in each mode per target variable (the rows of figures 2 to 4). We do this because we are primarily interested in the survey variables. It should again be noted, however, that contact effort is mode-specific and cannot be compared across the self-administered modes, telephone and face-to-face; an attempt in one mode does not compare to an attempt in another mode, except for mail and Web.
It is important to note that the three figures contain many tests and that standard errors of the estimates are sometimes relatively large. For this reason, we investigate only general patterns when the number of contact attempts grows, i.e. increasing or decreasing biases as a function of contact effort. We conclude that contact effort is a proxy common cause to nonresponse and measurement error when simultaneously the two bias terms are significantly increasing or decreasing; they should show filled symbols on selection bias and on measurement bias for small numbers of calls or reminders and the direction of change should be the same.
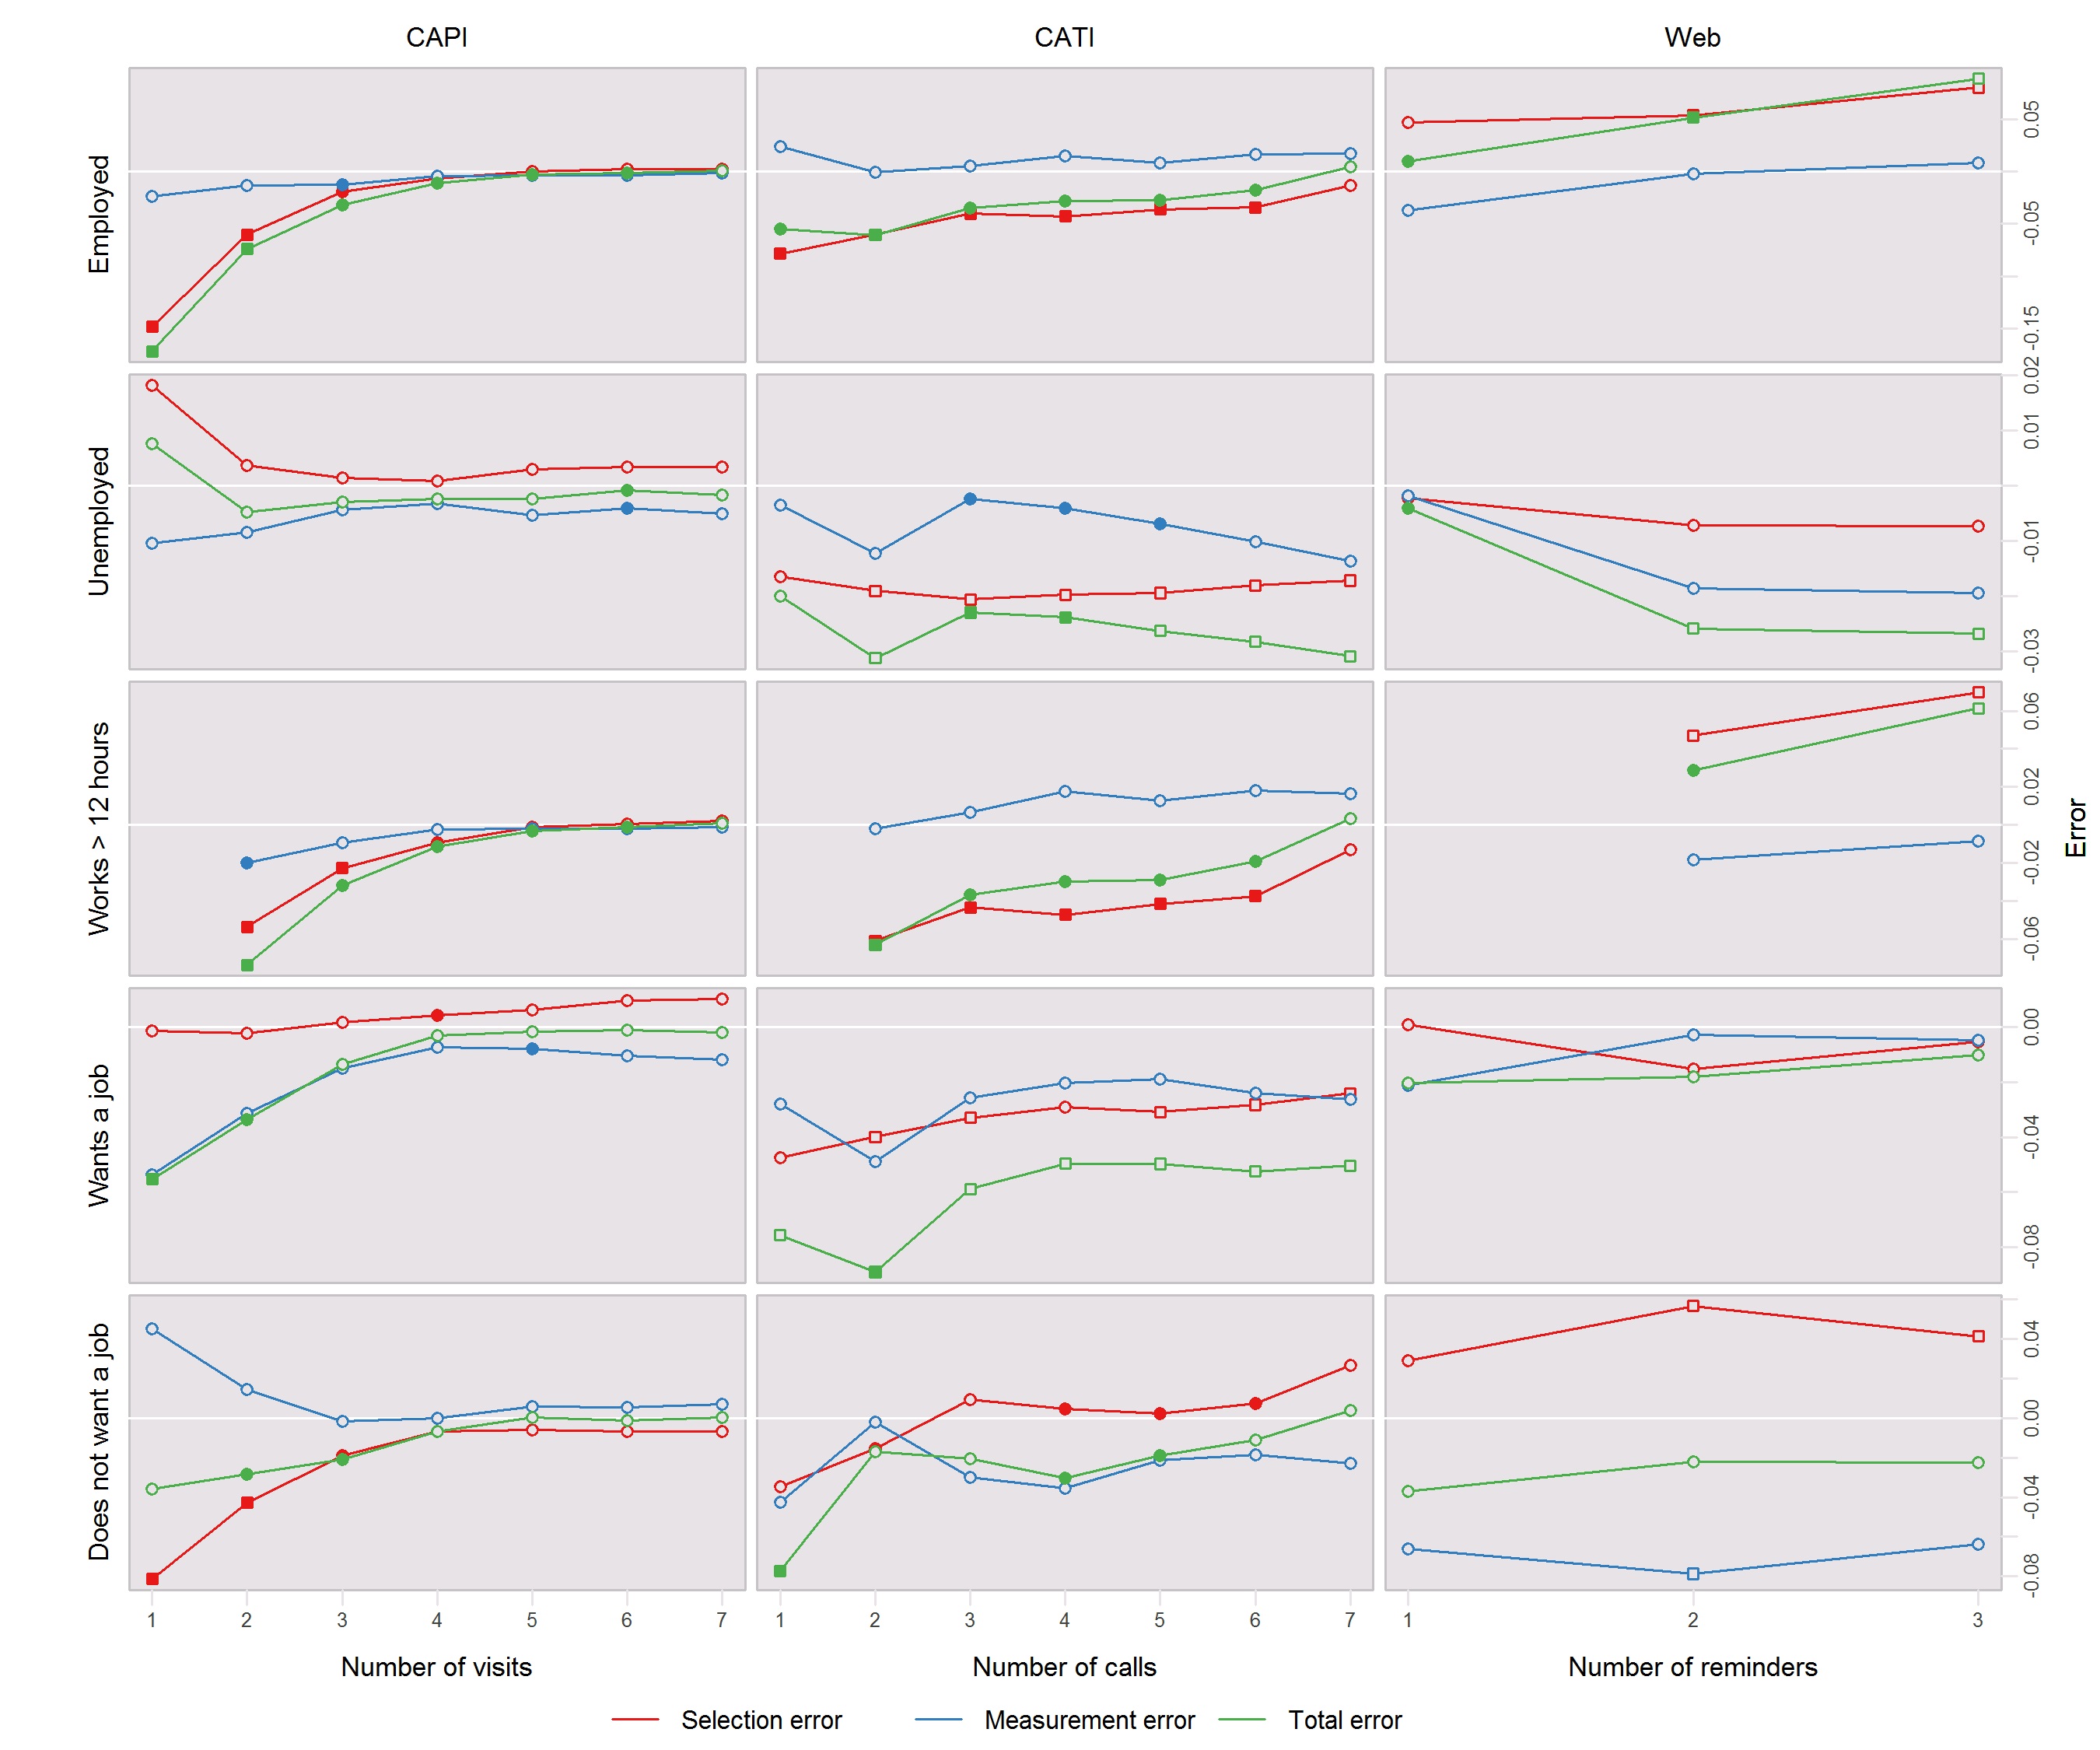
Figure 2: Effect of increasing contact effort on selection, measurement and total mode effect for the LFS variables on work. Filled symbols indicate a significant difference from the last contact attempt of the same mode; square symbols indicate a significant difference from the last contact attempt of CAPI. All significances are tested at the 5% level. The white line in the graphs is the zero line and corresponds to no selection bias, no measurement bias or a zero mode effect.
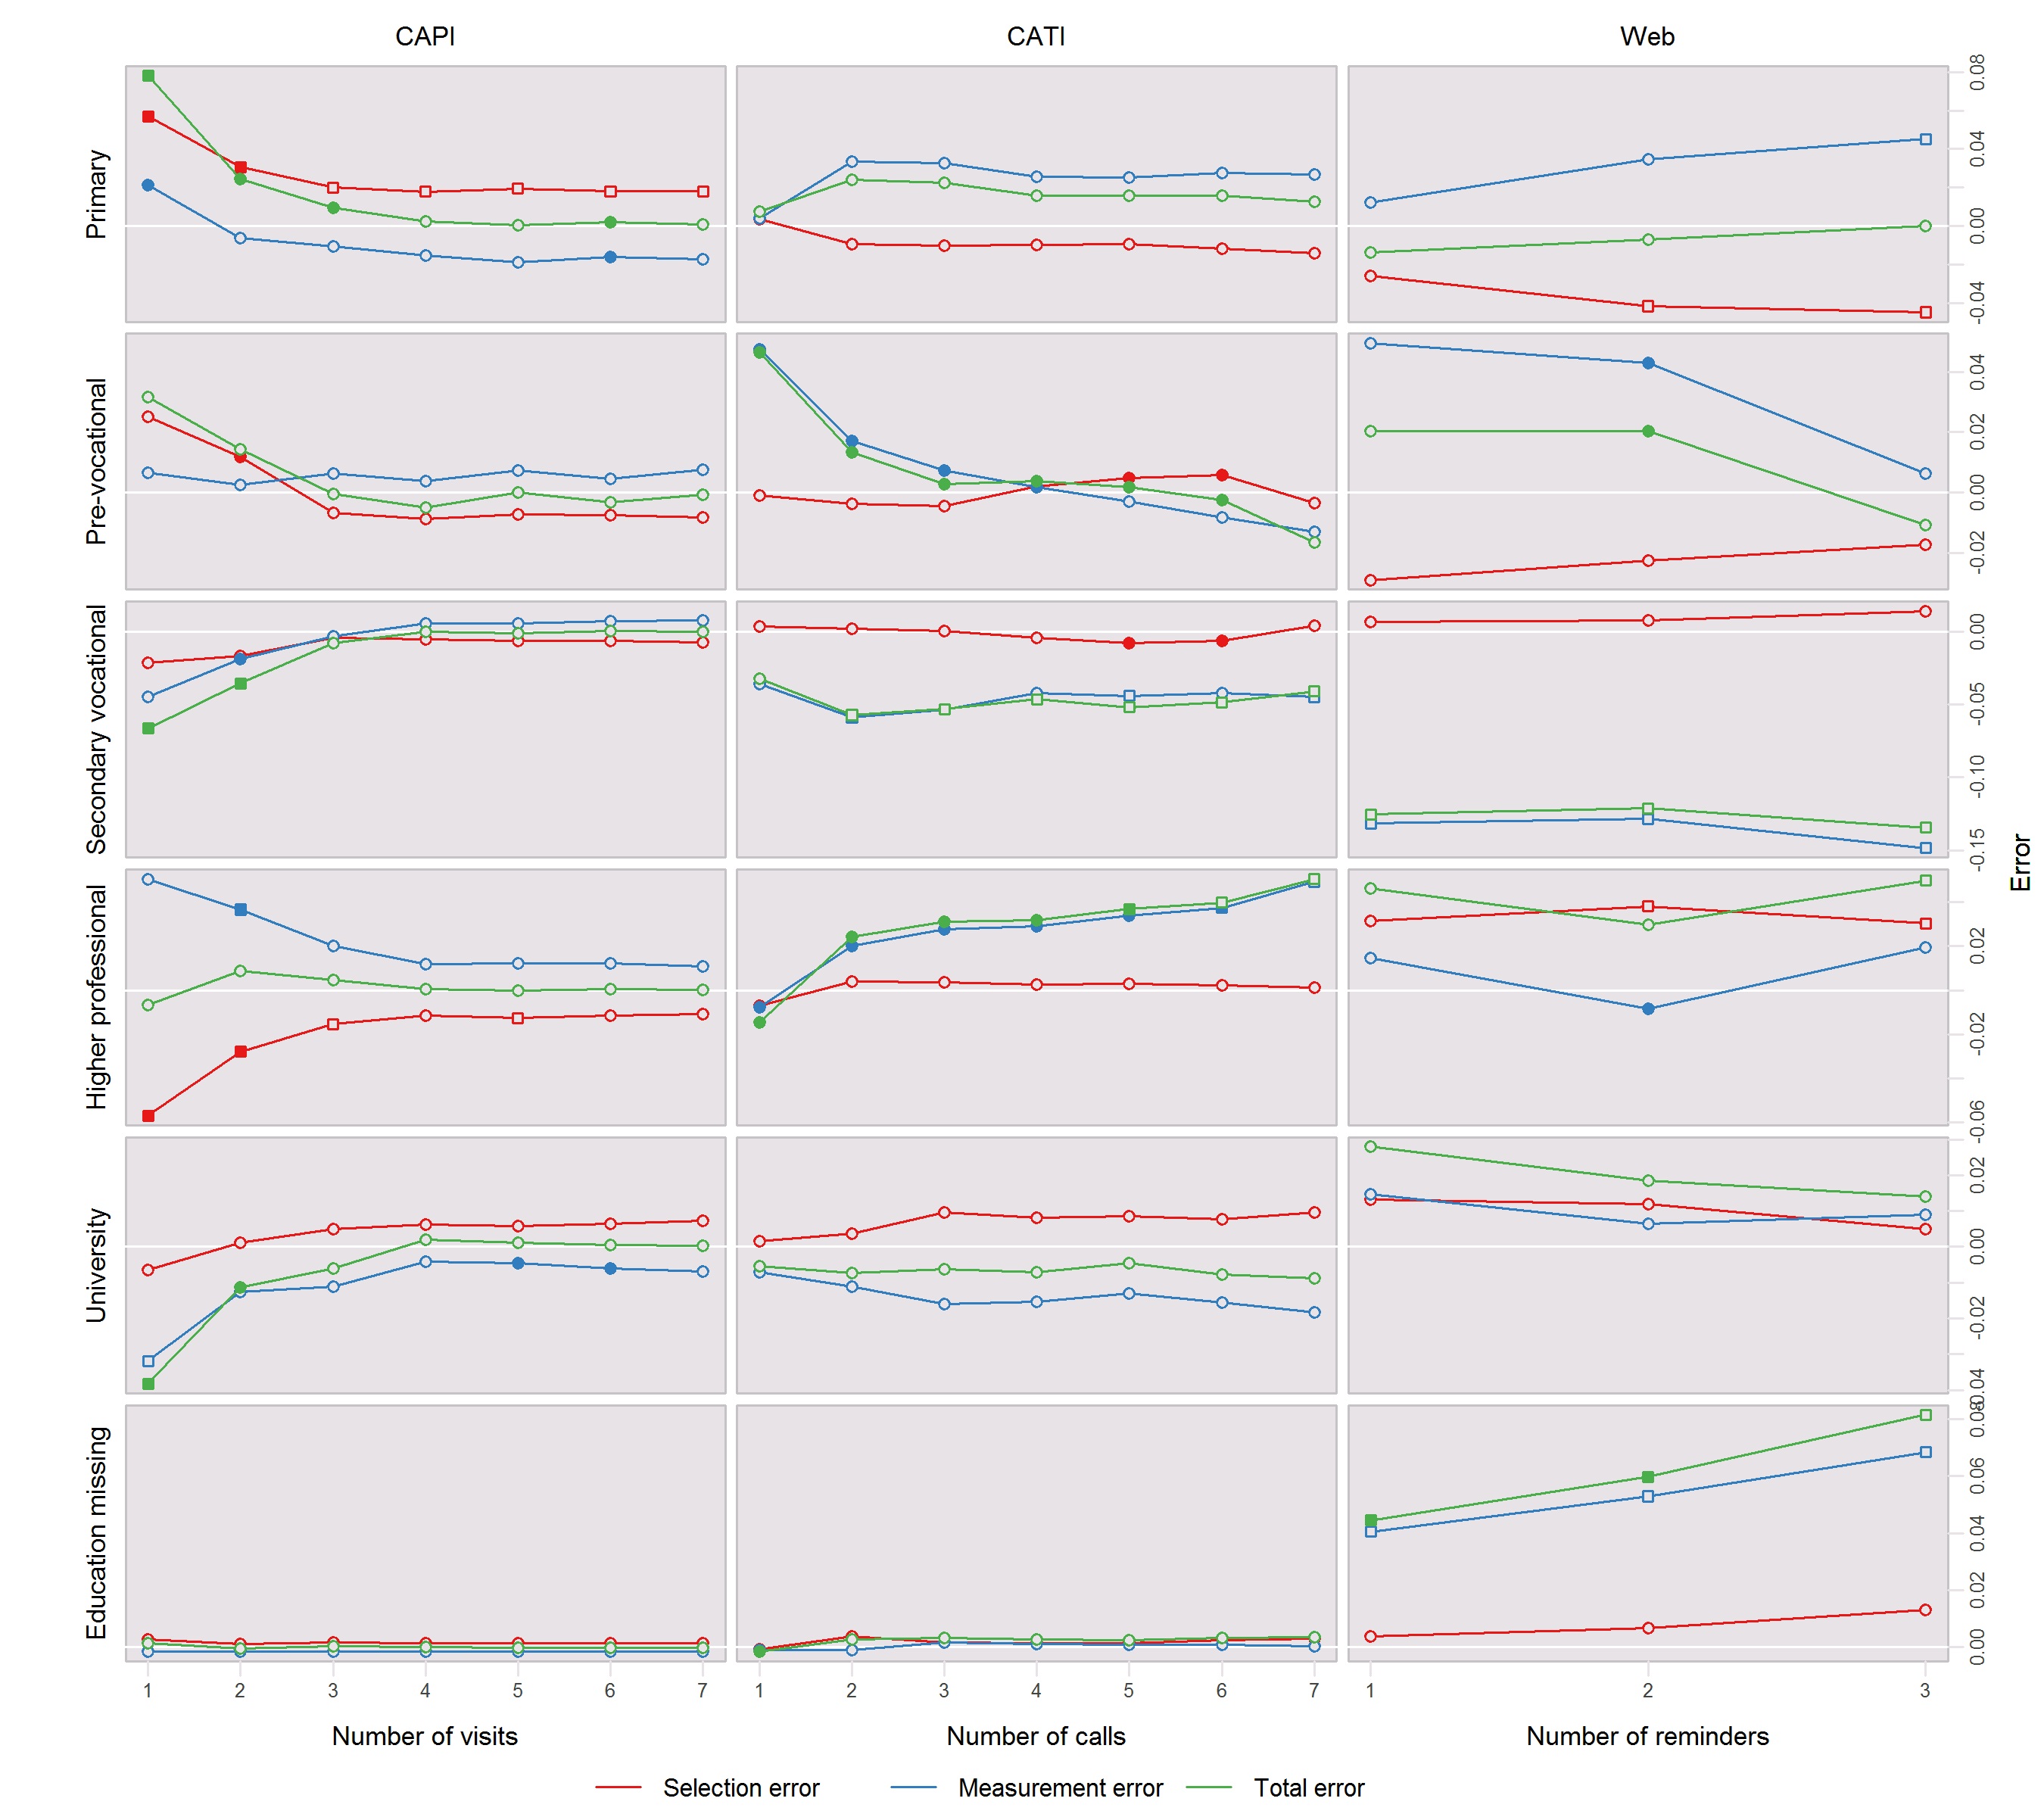
Figure 3: Effect of increasing contact effort on selection, measurement and total mode effect for the LFS variables on education. Filled symbols indicate a significant difference from the last contact attempt of the same mode; square symbols indicate a significant difference from the last contact attempt of CAPI. All significances are tested at the 5% level. The white line in the graphs is the zero line and corresponds to no selection bias, no measurement bias or a zero mode effect.
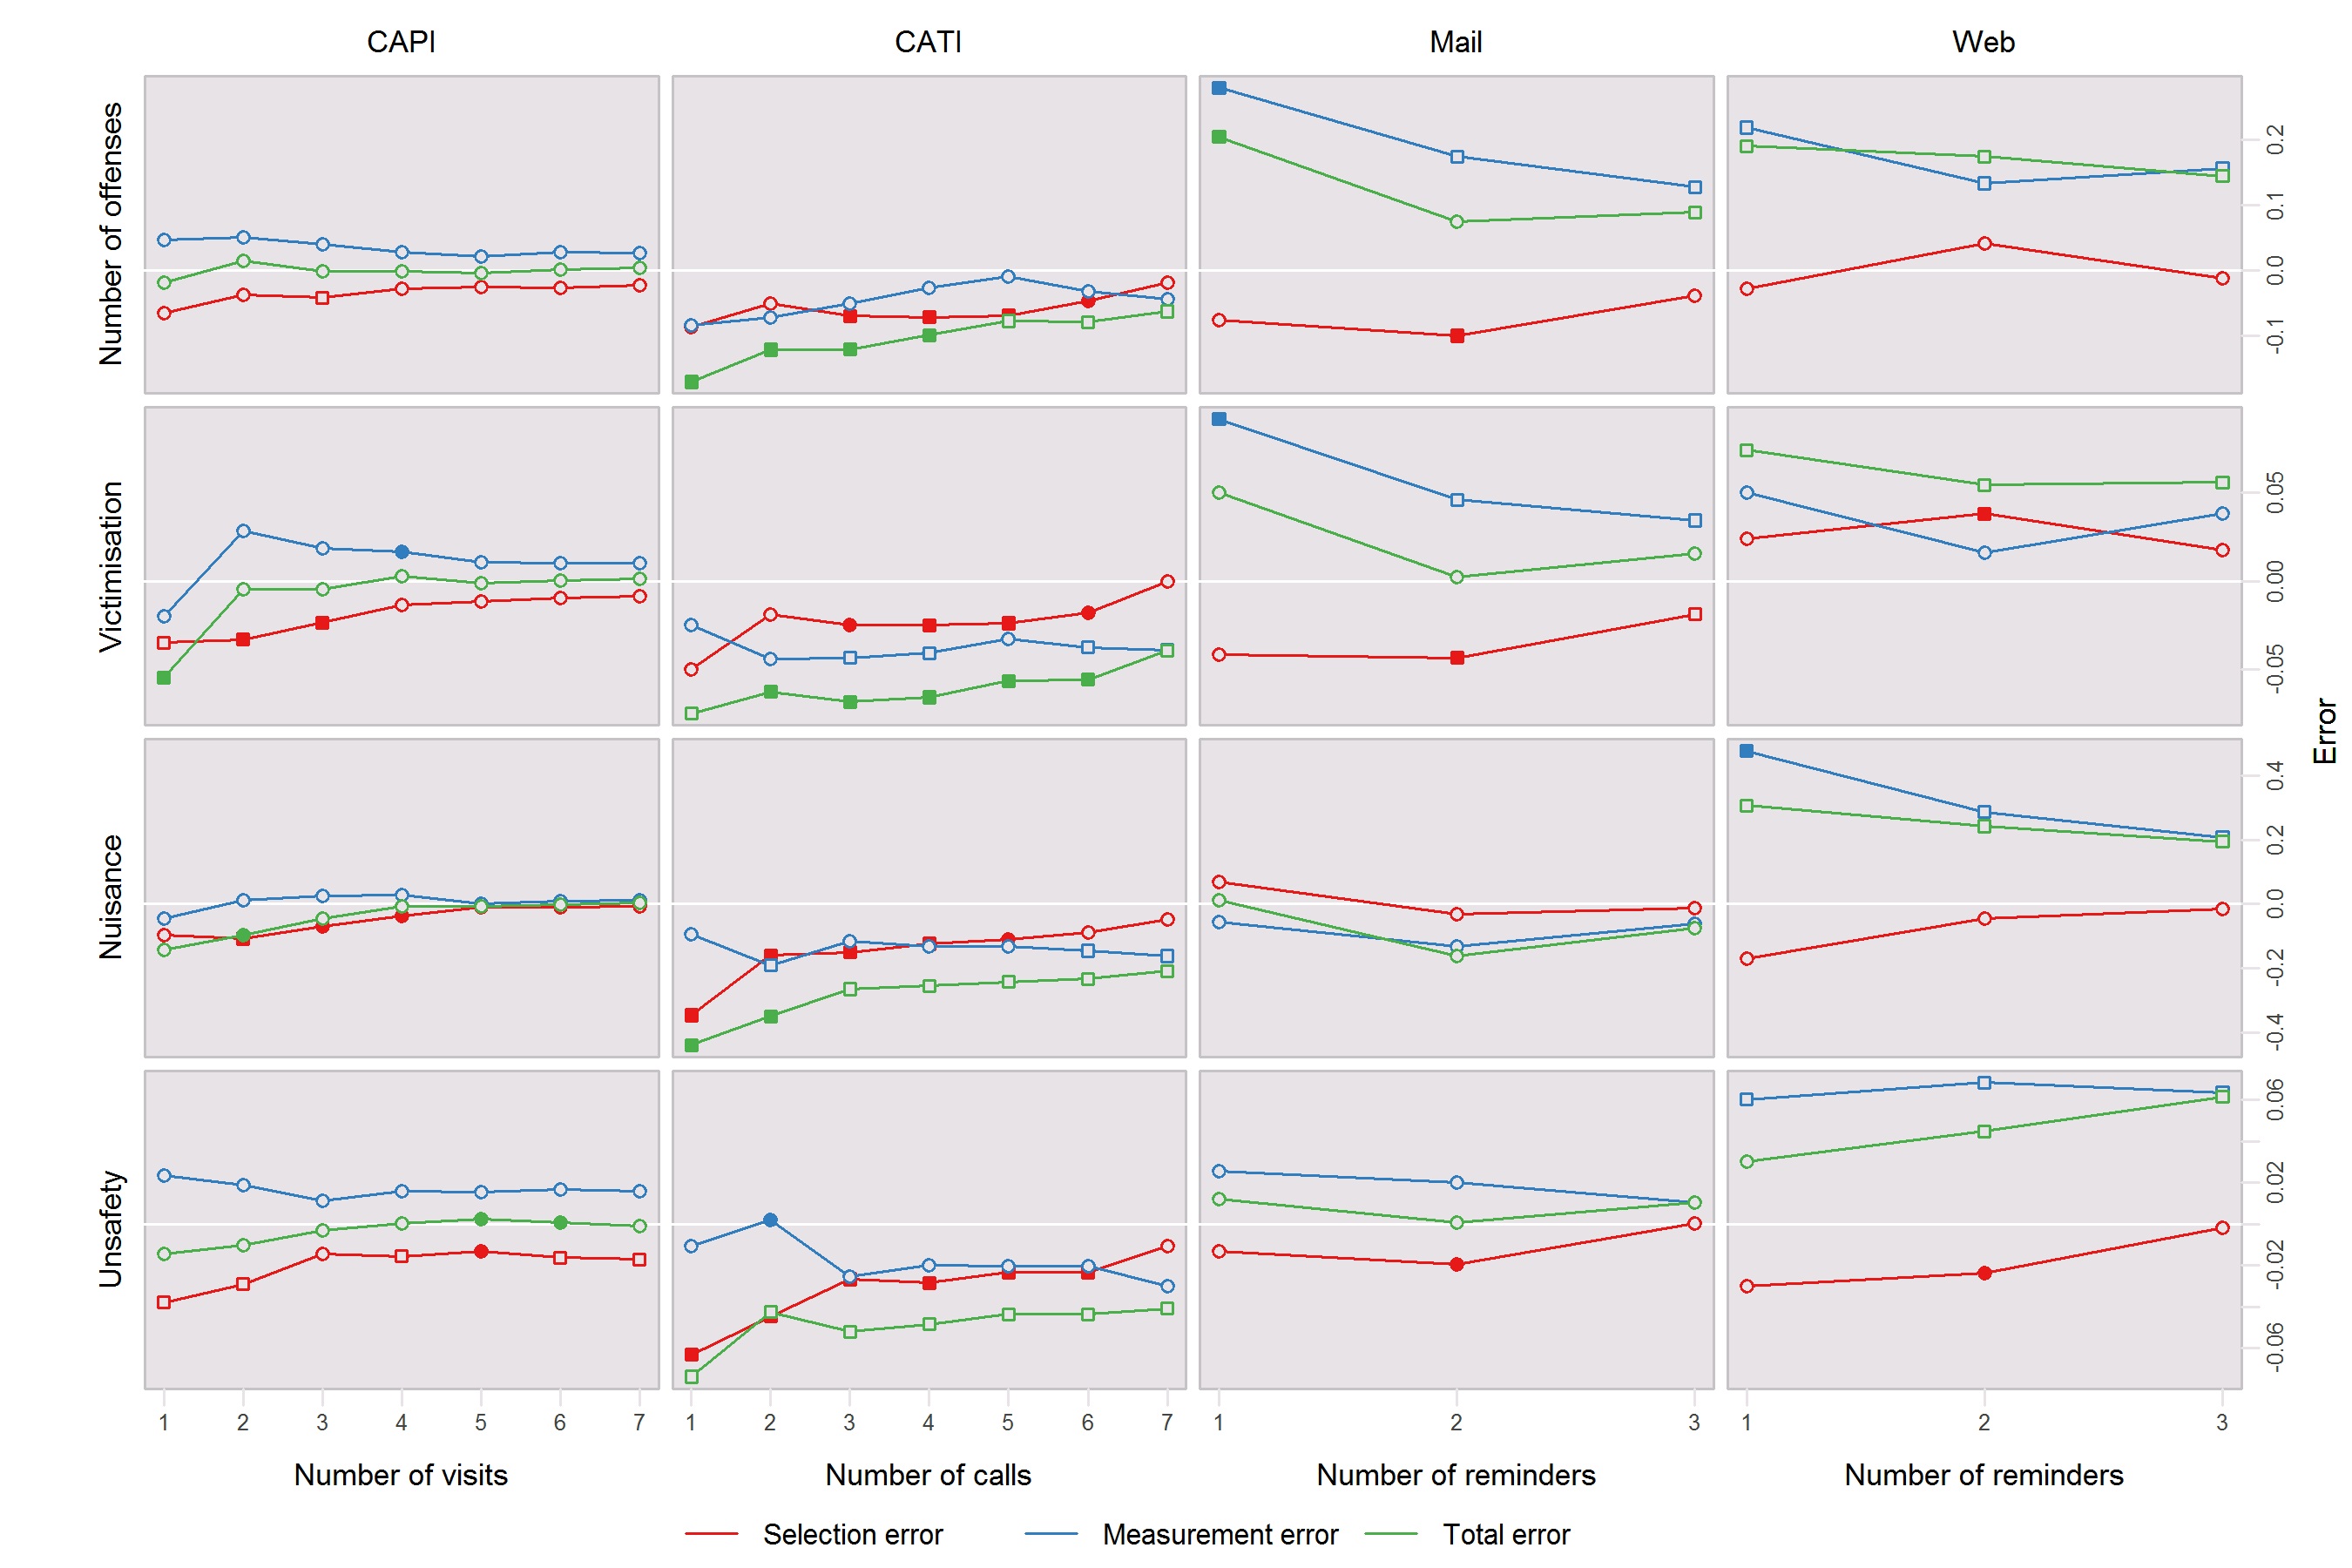
Figure 4: Effect of increasing contact effort on selection, measurement and total mode effect for the CVS target variables. Filled symbols indicate a significant difference from the last contact attempt of the same mode; square symbols indicate a significant difference from the last contact attempt of CAPI. All significances are tested at the 5% level. The white line in the graphs is the zero line and corresponds to no selection bias, no measurement bias or a zero mode effect.
We consider first the work related questions from the LFS (figure 2). For all three modes in which these questions were asked, an increase in the number of employed persons is seen and this is mainly related to the selection bias. For CATI and web there is a decrease in the percentage of unemployed persons with increased contact attempts and this seems to be caused by an increasing measurement bias. The differences are significant up to the last contact attempt, so the maximum number of contact attempts is needed.
Next we move to educational level, which is also a key LFS variable (figure 3). For CAPI, mainly an effect is seen for primary education. After the first contact attempt there is an overrepresentation which decreases with increased contact. This is both a measurement and selection effect. CATI shows large effects for pre-vocational and higher professional education. Both are measurement biases. For web, there are no clear effects visible, except that the fraction with missing education increases. This is mainly a measurement effect: persons who need more reminders more often do not fill in their education.
Last we consider the target variables of the CVS (figure 4). The results on the selection bias show that, for CATI and paper, victims of crimes and persons who feel less secure need more effort to collect. The measurement bias does not seem to depend on the amount of effort. The results for Web show no clear patterns.
Combining the results for all key CVS and LFS variable, we can conclude that an increased contact effort does affect mode-specific nonresponse bias and mode-specific measurement bias for some of the variables. However, for none of the variables for none of the modes did we find a simultaneous significant selection bias and measurement bias for small numbers of calls and reminders. Hence, there is no strong indication that contact effort is a proxy common cause to both types of biases.
4. Discussion
In this paper, we hypothesized that contact effort is not a proxy common cause for selection and measurement error in the interviewer modes, and, further, that it may only be a weak proxy common cause in the non-interviewer modes. From the mode effect decompositions, we indeed cannot determine any pattern that indicates it is a proxy common cause, neither in the interviewer or in the non-interviewer modes; the size of measurement bias is stable while there are changes in the size of the selection bias as contact effort is increased.
What are the implications of these findings for survey design and estimation? We see three main implications:
- Per mode there does not seem to be much reason to account for any adverse effect of extended contact effort on measurement bias.
- Adaptive survey designs that differentiate contact effort within a particular mode can focus mostly on the composition of response: Changes in measurement bias for different contact effort levels are generally small and rare for all of the survey modes we investigated. For the choice of survey mode itself this does not hold; the mode may affect both selection bias and measurement bias simultaneously. As a consequence, both types of error need to be considered when choosing between modes or when combining them in a mixed-mode design.
- Calibrating the contributions of modes in mixed-mode designs to overall response may be effective in ensuring comparability over time: In mixed-mode designs, the contribution of each mode to the overall response may fluctuate from one wave or month to the other. This is partly caused by sampling variation but also by varying available effort that could be put into making contact. This variation leads to a varying mix of mode-specific measurement biases which is largely insensitive to normal weighting procedures. Calibration to fixed mode contributions has been offered as a solution (Buelens and Van den Brakel 2013), but would fail when the mode-specific measurement biases themselves change along with the effort. However, as there is no indication that measurement bias is strongly linked to contact effort, the mix of measurement biases is just a function of the response rates and contributions per mode and can be stabilized.
As far as we are aware, to date, there still is very little empirical evidence in the literature about common causes for nonresponse and measurement error. This paper contributes to that literature. The findings of this study should, however, be treated and interpreted with some care as the sample size of our mode experiment was not specifically designed to answer the research question of this paper. The sample size was designed such that acceptable statistical power is obtained for mode effect decompositions at the aggregate level, i.e. without a further stratification on contact effort. For this reason we investigated patterns in measurement bias and selection bias as a function of contact effort rather than differences at individual numbers of calls, visits or reminders. As discussed, the mode effect decomposition also comes with a number of assumptions which are, however, reasonable for contact effort. The results in this paper are also specific to the Crime Victimisation Survey (CVS) and the Dutch survey climate. Although this survey has a wide range of survey questions and is expected to arouse different response styles, the experiment needs replication in other surveys and countries. Nonetheless, we hope that the findings stimulate others to perform similar exercises and replicate findings.
Appendix: Overview of CVS and LFS target variables
References
- Buelens, B., Van den Brakel, J. (2013), Measurement error calibration in mixed-mode sample surveys, Discussion paper 201304, Statistics Netherlands, The Hague, The Netherlands, available at http://www.cbs.nl/en-GB/menu/methoden/onderzoek-methoden/discussionpapers/archief/2013/ .
- Groves, R.M. (2006), Nonresponse rates and nonresponse bias in household surveys, Public Opinion Quarterly, 70, 646 – 675.
- Jäckle, A., Roberts, C. and Lynn, P. (2010), Assessing the effect of data collection mode on measurement, International Statistical Review, 78 (1), 3- 20.
- Klausch, T., Hox, J., Schouten, B. (2013), Assessing the mode-dependency of sample selectivity across the survey response process, Discussion paper 201303, Statistics Netherlands, The Hague, The Netherlands, available at http://www.cbs.nl/en-GB/menu/methoden/onderzoek-methoden/discussionpapers/archief/2013/ .
- Klausch, L.T., Schouten, B., Hox, J. (2014), The use of within-subject designs for estimating measurement effects in mixed-mode experiments, Discussion paper 201406, Statistics Netherlands, The Hague, The Netherlands, available at http://www.cbs.nl/en-GB/menu/methoden/onderzoek-methoden/discussionpapers/archief/2014/ .
- Leeuw, E. de, Hox, J., Lugtig, P., Scherpenzeel, A., Vis, C., Göritz, A., Bartsch, S., Engel, U., Vehre, H. (2010), Measuring and comparing survey attitude among new and repeat respondents cross-culturally, Paper presented at the WAPOR 63rd Annual Conference, Chicago, USA.
- Loosveldt, G., Storms, V. (2008), Measuring public opinions about surveys, International Journal of Public Opinion Research, 20 (1), 74 – 88.
- Olson, K. (2007), An Investigation of the Nonresponse – Measurement Error Nexus, PhD thesis, University of Michigan, USA.
- Olson, K. (2013), Do non-response follow-ups improve or reduce data quality?: a review of the existing literature, Journal of the Royal Statistical Society A, 176 (1), 129 – 145.
- Schouten, B., Brakel, J. van den, Buelens, B., Laan, J. van der, Klausch, L.T. (2013), Disentangling mode-specific selection and measurement bias in social surveys, Social Science Research, 42, 1555 – 1570.
- Vannieuwenhuyze J., Loosveldt, G., Molenberghs, G. (2010), A method for evaluating mode effects in mixed-mode surveys, Public Opinion Quarterly, 74 (5), 1027 – 1045.
- Vannieuwenhuyze, J., Loosveldt, G. & Molenberghs, G. (2012). A Method to Evaluate Mode Effects on the Mean and Variance of a Continuous Variable in Mixed-Mode Surveys, International Statistical Review, 80(2), 306–322.
- Vannieuwenhuyze, J. & Loosveldt, G. (2013). Evaluating Relative Mode Effects in Mixed-Mode Surveys: Three Methods to Disentangle Selection and Measurement Effects, Sociological Methods & Research, 42(1), 82–104.
-
-
Call for the Special Issue:
Surveying people living in nursing homes –Challenges and Solutions
Keywords
calibration CATI coverage coverage bias cross-national surveys data linkage data quality European Social Survey experiment face-to-face face-to-face survey Facebook hard to reach populations incentives item nonresponse measurement measurement error mixed-mode surveys multitasking non-probability samples Nonresponse nonresponse bias nonresponse rates paradata PIAAC Probability sample probability samples QR codes rare populations response rate Satisficing social desirability Social media survey survey-taking climate survey data survey management survey methods Telephone survey telephone surveys total survey error unit nonresponse validity web survey Web surveys weighting