Measuring Immigrant Populations: Subjective versus Objective Assessments
Lundmark, S. & Kokkonen A. Measuring Immigrant Populations: Subjective versus Objective Assessments. Survey Methods: Insights from the Field. Retrieved from https://surveyinsights.org/?p=8480
© the authors 2017. This work is licensed under a Creative Commons Attribution 4.0 International License (CC BY 4.0) 
Abstract
Innumeracy among survey respondents in estimating a country’s immigrant population is a well-known problem for the social sciences. In general, individuals have been found to overestimate the immigrant population at the country level. Furthermore, individuals were found to be especially prone towards overestimating the number if they already were prejudiced against immigrants. If these findings generalize to lower levels of inquiry such as neighborhoods, then research using subjective assessments of immigrant populations in these contexts might be biased as well. By distributing a questionnaire among 142 small and mid-sized companies in the city Gothenburg, Sweden, respondent’s subjective assessments of the immigrant population in their neighborhoods was compared to register data of those neighborhoods. Hence, although the sample was only representative of the working population in small and middle-sized companies in a metropolitan area thus excluding unemployed, retirees, non-working students, and the rural population of Sweden, the results demonstrated that subjective assessments could correlate well with objective assessments. Overall, the results indicated that the disparity between subjective and objective assessments was lower than what could be expected from previous research findings at the country-level.
Keywords
Immigration, overestimation, population estimates, Subjective assessment
Copyright
© the authors 2017. This work is licensed under a Creative Commons Attribution 4.0 International License (CC BY 4.0) 
Introduction
It is well-known that respondents often fail to correctly estimate a country’s immigrant population when asked to do so (Herda, 2010). The fact that this ‘innumeracy’ is partially driven by the respondents’ prejudices and unrepresentative personal experiences of minority populations is especially troubling (Nadeau and Niemi, 1995; Nadeau, Niemi, & Levine, 1993; Wong, 2007; Herda, 2010).
At the country level, reliable register data on immigrant populations usually exist. However, at lower levels of inquiry, researchers often need to use subjective assessments since objective measurements are not always available. Research based on international comparative surveys has, at least partially, relied on such lower level subjective assessments (e.g. Schneider, 2008; Semyonov and Glikman, 2009; Kokkonen et al., 2014), despite the fact that we do not know whether respondents are able to reliably estimate the number of immigrants in their neighborhood when they fail to give reliable estimates at the national level.
In this manuscript, we extend research on survey respondents’ innumeracy by estimating how well subjective and objective assessments of the immigrant population in respondents’ neighborhoods correlate and whether these assessments are biased by respondents’ attitudes. By linking respondents of a survey administered to employees in 142 small and middle-sized companies in Gothenburg, Sweden, to the population register, we could evaluate how well the respondents’ subjective assessments correlate with reality.
Misperceptions of Immigrant Population Size
Innumeracy is a well-known problem in survey methodology research (Paulos, 1990; Sigelman and Niemi, 2001). Not only have respondents been found to have problems with basic mathematical and statistical concepts, but when asked about the racial or ethnical composition of their country, respondents seemed to perform even worse by heavily overestimating the size of minority populations (Nadeau et al., 1993; Sigelman and Niemi, 2001; Wong, 2007; Herda, 2010). Adding to the problem, these estimates were not only found to be extensively off the mark, but were also found to be biased by the respondents’ own prejudices, feelings of group threat, or unrepresentative personal experiences of minority populations (Allport, 1954; Nadeau et al., 1993; Herda, 2010). Such findings should make researchers wary of using subjective assessments of minority populations to estimate effects on various outcomes, especially for prejudice and group threat.
At the national level, register data on population characteristics exist in most countries. However, for lower level social units (e.g., neighborhoods and workplaces) such data is not always available. Indeed, studies focused on explaining survey respondents innumeracy at the national level, sometimes even included subjective assessments of the minority population size in the respondents’ neighborhoods (Sigelman and Niemi, 2001; Herda, 2010). Based on the subjective assessments of neighborhoods, these studies argued that respondents living in neighborhoods with many immigrants were more prone to overestimating the immigrant population at the national level. However, this begs the question of whether such lower level subjective estimates are more reliable than subjective estimates at the national level? To our knowledge, no studies have explored this issue. The closest exception would be Cara Wong (2007) who aimed to compare subjective assessments of “local communities” with an objective assessment of the same local communities. However, due to anonymity in the data, she ended up using American counties (which can include as many as millions of citizens) as the lowest separator for the objective measure. Hence, counties were quite far from the local communities she set out to measure.
On the one hand, it is natural to expect people who are prejudiced toward minority populations to exaggerate their numbers in all social arenas. Rosabeth Moss Kanter (1977) for example, argued that women in male-dominated firms, where women were seen as a threat to men’s privileged position, captured “a disproportionate awareness share” – i.e. were more visible than their male colleagues (p. 965). Following Kanter’s (1977) arguments, Daniel Herda (2010) argued that “this cognitive bias should promote the perception that even a small minority is overly large and influential” (p. 676). If true, this would mean that prejudiced people are prone to overestimating the size of minority populations in lower level social units as well. On the other hand, it is plausible that respondents are more likely to correctly estimate the population in lower level social units, given that it may be harder to misconceive—or ‘lie’ to oneself—about the ethnic composition of one’s neighborhood, when one has close to daily visual contact with neighbors. Below we test whether previous findings about respondents’ innumeracy about the size of the immigrant population generalize to the neighborhood levels of the working population in metropolitan areas as well.
Data
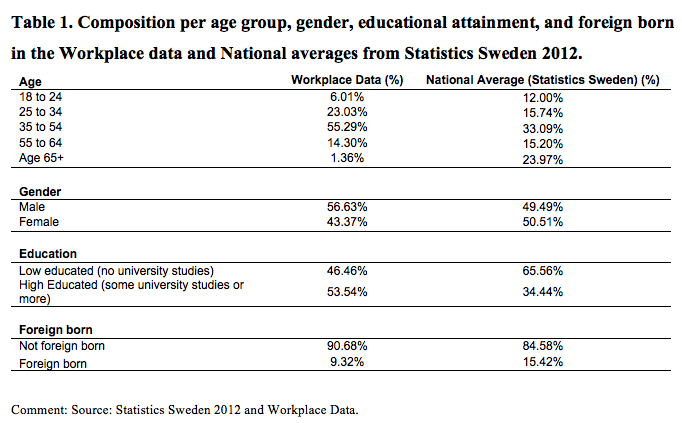
The dataset used, include 1,896 respondents from small- and middle-sized private companies (up to 100 employees) interviewed through a questionnaire in the second largest city of Sweden, Gothenburg during the year 2012. Out of a random sample of 634 approached companies 142 agreed to distribute our questionnaire (22 percent). The questionnaire was mainly distributed online; however self-administered paper questionnaires were available if the company asked for it. Out of the 2,830 approached employees, 1,896 completed the questionnaire (67 percent response rate, AAPOR Response Rate RR6). The companies represented a wide range of businesses and only had their sizes in common. Thus, the sample can be considered as representative of the working population in small- and medium-sized private companies in the Gothenburg area, Sweden. However, the sample should not be considered representative for the population as a whole (for a comparison between our sample and the national demographic composition, see Table 1). Our sample excludes the unemployed, students, self-employed, and retired (hence, the discrepancy between our sample and the national average for ages 65 and up), as well as those working in large-sized companies and the public sector. This should be kept in mind when interpreting the results. Education and age effects should, for example, be interpreted with caution.
Operationalization
The subjective assessment of immigrants in the neighborhood was measured through the survey question: “How many of your neighbors have an immigrant background?” This question was accompanied by a six-point scale ranging from “None/Almost none,” “A few,” “More than a few but less than half,” “Half,” “More than half but not everyone,” and “Almost everyone/Everyone.” We use all categories when comparing subjective and objective assessments, but due to that few respondents chose the three highest response categories we merge the last three categories when we run our regression models. Although our operationalization of the subjective assessment cannot be directly compared to percentage rates obtained in the objective assessment, it has the benefit of being similar to the survey questions that usually measure the size of the immigrant population. It may also be easier for respondents to understand the response alternatives in our survey question compared to asking for the mathematical concept of percentages (Paulos 1990).
The objective assessment of number of immigrants in the neighborhood was obtained from Statistics Sweden. Statistics Sweden is the Swedish authority responsible for the census registry of all residents in Sweden and can provide data on the number of immigrants per area code in the whole of Sweden.[1] An area code is a five-digit number created and handled by the Swedish Postal Service and represents natural areas in which a single postal worker can deliver mail during one work day. Hence using percentage of immigrants over an area code should represent a natural division recognized by the respondents as their neighborhoods. We converted the number of immigrants in each area code to the percentage of the population in those codes that were foreign born. The average number of people living in each area code for the region of our sample was 930 (standard deviation 563) and the average percent of immigrants was 13.2 (standard deviation 9.5).
It could be argued that the unspecified “immigrants” in our survey question may have been interpreted by the respondents to also include second-generation immigrants. We therefore compared all analyses of the percentage of immigrants in the neighborhood to a measure that encompassed both the objective percentage of foreign born and the percentage of second-generation immigrants in each respective area code. A second-generation immigrant was operationalized as a citizen who has at least one parent born outside the Nordic countries. The average percent of immigrants in the area codes analyzed was 18.1 (standard deviation 12.7). The correlation between the two objective measures was almost perfect with r = 0.97. It would be theoretically possible to also include third-generation immigrants in the alternative measurement. However, Statistics Sweden refrains from including third-generation immigrants in their official definition of foreign background, which make it more difficult to obtain statistics for third-generation immigrants. We have, therefore chosen not to include the third generation in our measurement, even though doing so may reduce the gap between objective and subjective measurements. Given that large-scale immigration is a rather recent phenomenon in Sweden, and the number of third-generation immigrants is rather low we do not think that including the third generation would change the results much.
Results
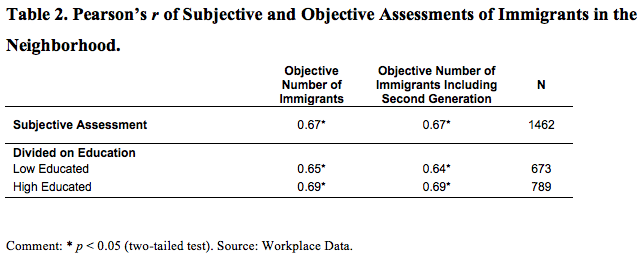
We start with analyzing the correlation between the subjective and objective assessment. The correlation between the subjective assessment and the objective number of first generation immigrants was r = 0.67, which is a moderate bordering on strong correlation. Unexpectedly, the correlation remained 0.67 between the two assessments rather than being improved by including second generation immigrants into the objective assessment.
Furthermore, the correlation between the subjective and objective assessment do not differ between low educated (no university studies) and high educated (university studies) respondents. This finding is perhaps surprising, given that ability and the level of education of the respondent has previously been argued to be one of the main sources of innumeracy (Herda 2010), as well as lower quality survey responses (Krosnick, 1999). Hence, the coherence between subjective and objective assessments of the immigrant population in the neighborhood seems higher than expected, given that previous research usually found strong discrepancies between subjective and objective assessments of number of immigrants at higher levels of inquiry (Nadeau et al., 1993; Herda, 2010).
Misperceptions of Immigrant Population size
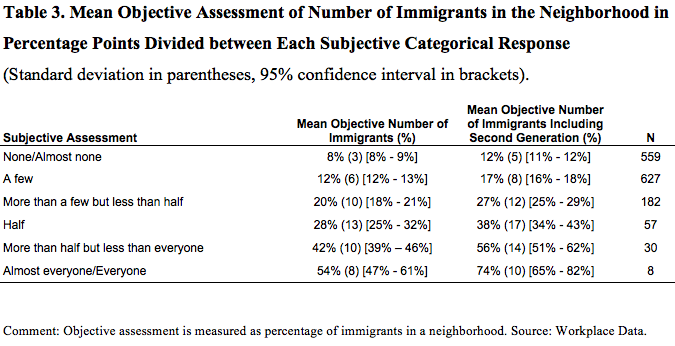
Although we cannot provide a percentage point of the over- or underestimation of the immigrant population, we can calculate a rough estimate of the tendencies to over- or underestimate number of immigrants by comparing the subjective categories to the actual percentages of immigrants in the respondents’ neighborhoods. Table 3 presents the mean of the objective assessments of the immigrant population in the neighborhood for each category within the subjective assessment.
The subjective assessment seems to follow a linear relationship; each increased subjective category leads to an increase in actual number of immigrants in the respondents’ neighborhood. However, the respondents in our data showed a tendency to overestimate the number of immigrants. Respondents who believed they lived in a neighborhood where about half of the population were immigrants, actually lived in neighborhoods that only had 28 percent (95% CI: 25% – 32%) immigrants. In addition, respondents who said they lived in a neighborhood where more than half of the population were immigrants, actually lived in neighborhoods where only 42 percent (95% CI: 39% – 46%) of the population were immigrants. This overestimation shrank considerably when comparing the subjective assessment to the objective assessment that included second-generation immigrants. For respondents who believed that they live in a neighborhood where more than half of the population were immigrants, 56 percent (95% CI: 51% – 62%) of the actual population were first- and second-generation immigrants. However, respondents who believed that about half of their neighbors were immigrants, again overestimated the number of immigrants in their neighborhood, since first- and second-generation immigrants made up only 38 percent (95% CI: 34% – 43%) of the population on average.
Hence, overestimation of the number of immigrants seems to exist at the neighborhood level as well. However, this overestimation shrank considerably if second-generation immigrants were also considered.
Explaining Subjective Assessments
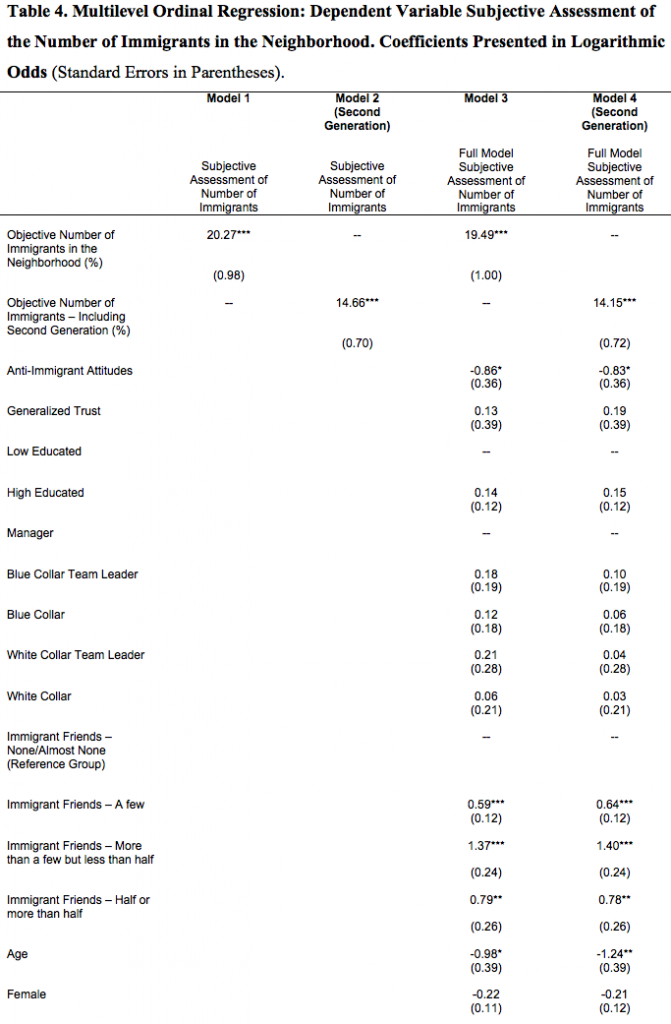
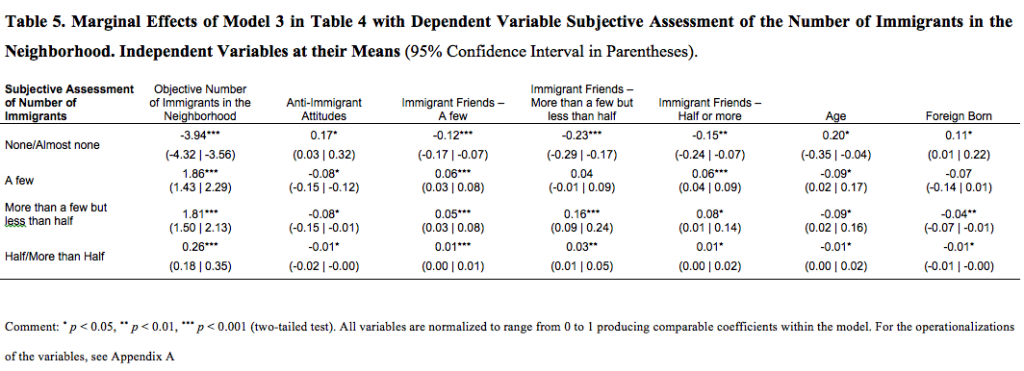
Even though the subjective and objective assessment correlated quite well, we still could find tendencies amongst the respondents to overestimate the number of immigrants. In the following analyses, we investigate what might cause this discrepancy. Table 4 presents a Multilevel Ordinal Regression Model that uses the subjective assessment of the number of immigrants in the respondents’ neighborhood as the dependent variable. In these models, all variables are normalized to range from 0 to 1.
Both versions of the objective assessment (i.e., excluding or including second-generation immigrants) were strong predictors of the subjective assessments in the four models (see Table 4). The more immigrants there were in the neighborhood, the more immigrants the respondent perceived there to be. This supports the notion that the subjective assessment may be valid as a proxy for the actual number of immigrants in the neighborhood. The predictive capability of the objective assessment also remained when controlling for other factors (i.e., attitudes toward immigrants, generalized trust, job position, number of immigrant friends, education, age, and gender. For a description of these, see Appendix A.) (see Table 4, Models 3 and 4).
Furthermore, the marginal effects for the objective assessments were substantively larger compared to all the other variables (holding all other variables constant at their means, see Table 5). Hence, the objective assessment was the strongest predictor of the subjective assessment in all four models.
In addition to the strong predictive capability of the objective assessment, we believe that four of the other statistically significant predictors in these models warrants some further discussion.
First, negative attitudes toward immigrants were associated with a lower probability of responding that many immigrants lived in one’s neighborhood (see Table 4). The pattern was the opposite of previous research findings at the country level. When speculating about the reason for this finding, we suspect that people who are negative toward immigrants, might be more prone than tolerant people to avoid contact with the immigrants in their neighborhood. As a consequence, intolerant people may end up believing that there are fewer immigrants in their neighborhood than what tolerant people believe. Regardless of the reason behind this finding, our results indicate that researchers should remain cautious of using subjective assessments of neighborhood immigrant populations when aiming to predict attitudes toward immigrants.
Second, older people were less likely than younger people to give high estimates of the immigrant population. This age effect could perhaps be explained by the fact that Sweden has experienced a drastic increase in the immigrant population since the 1980s, which could influence older people to have a different conception than young people of how many immigrants there are in one’s neighborhood. However, the age effect should be interpreted with caution since the sample was taken from small- and middle size private companies, only people of working age were included. Pensioners and students are not in the sample.
Third, respondents who had immigrant friends were more prone than respondents without immigrant friends to say that many immigrants live in their neighborhood. This finding confirms results from the national level (Nadeau et al., 1993), showing that people are affected by whom they interact with when they make up their minds about how diverse their surroundings are.
And fourth, immigrants themselves gave lower estimates of the number of immigrants in their neighborhoods. This is perhaps an indication that immigrants have a more narrow definition of who is perceived to be an immigrant, or are less experienced in distinguishing between who might be an immigrant and who is not.
Conclusion
In this manuscript we have compared subjective and objective assessments of the number of immigrants in the neighborhood. The findings suggest that subjective assessments correlate moderately, bordering on strongly, with the objective reality (r = 0.67). However, respondents still showed somewhat of a tendency to overestimate the number of immigrants in their neighborhood. This overestimation decreased drastically when including second-generation immigrants in the objective assessments of the number of immigrants.
A limitation of these findings is that, due to the sample being constricted to workplaces, the results are only representative for the working population in small- and medium-sized companies in a metropolitan area in Sweden, and not to people that were unemployed, retired, or living in rural areas. However, we argue that in rural areas, the notion of neighborhood would be harder to conceptualize using area codes and thus this limitation would exist despite using another sample, since register data is more difficult to obtain on smaller geographical areas than area codes (an exception to this can be found in Dinesen and Sønderskov 2015).
The fact that unemployed and retired people are not in the sample is potentially more problematic for the interpretation of the results. Previous research has shown that retired people tend to overestimate the immigrant population. Furthermore, older and unemployed people have been found to hold relatively negative attitudes toward immigrants, and previous research has shown that negative attitudes toward immigrants are positively associated with overestimations of the immigrant population at the country level (though our results suggest the opposite association). Therefore, we may have ended up with slightly higher levels of overestimations if we had studied a more representative sample. However, one may be able to compare our results with results from the country level by excluding the non-working population in such studies.
Lastly, our findings suggests that subjective assessments of the number of immigrants in the neighborhood seem to work better than what previous research focused on the country level would have us believe (albeit, see the caveats mentioned above). It also seems unproblematic to use subjective assessments of the number of immigrants in the neighborhood when analyzing generalized trust outcomes, as generalized trust was not affected by the subjective assessments (at least when the focus is on the working population).
However, somewhat worrying is that we found that subjective assessments were influenced by attitudes toward immigrants and personal contact with immigrants. Thus, previous findings on the relationships between the number of immigrants in the neighborhood, personal experiences with immigrants, and attitudes toward immigrants should perhaps be interpreted cautiously if the number of immigrants were estimated through subjective assessments given by respondents.
Taking the findings in this manuscript together, we argue that the overall picture is somewhat mixed. Subjective assessments of the number of immigrants seem to work well as a proxy for some research purposes, but less for others.
Appendix A: Operationalizations
Attitudes toward immigrants is measured through an index comprised of five items, which are identical to items used in the Civic Education Study and that ask about opinions of cultural and political rights of immigrants. The questions are accompanied by a scale ranging from (1) “Strongly agree,” (2) “Agree,” (3) “Uncertain,” (4) “Disagree,” and (5) “Strongly Disagree.” Cronbach’s alpha of the index is 0.79 and recoded to range from 0 to 1 where high values indicate negative attitudes toward immigrants. The questions are listed below:
1) Immigrants should have the opportunity to continue speaking their own language.
2) Immigrant children should have the same opportunities for education that other children in the country have.
3) Immigrants who live in a country for several years should have the opportunity to vote in elections.
4) Immigrants should have the opportunity to continue their own customs and lifestyle.
5) Immigrants should have all the same rights that everyone else in the country has.
Generalized trust is measured through the minimally balanced question “In your opinion, to what extent is it generally possible to trust people?” It is accompanied by a scale ranging from (0) “people cannot generally be trusted” to (10) “people can generally be trusted.” The variable is recoded to range from 0 to 1.
“How many of your friends have an immigrant background?” It is accompanied by a six-point scale ranging from “None/Almost none,” “A few,” “More than a few but less than half,” “Half,” “More than half but not everyone,” and “Almost everyone/Everyone.” The variable is recoded into dummy categories.
“Where were you and your parents born?” is asked with three items: “You,” “Your Mother,” and “Your Father” and accompanied by eight response options, “Sweden,” “Other Nordic country,” “Other country in Europe,” “Country in Africa,” “Country in Asia,” “Country in North America,” “Country in South America,” and “Other Country in the World.” The variable is dichotomized with Sweden as the reference category and the other response options grouped and coded as 1.
[1] The register data provided by Statistics Sweden is generally considered extremely reliable. The only possible bias we can think of is that immigrants who stay illegally in Sweden are not registered by Statistics Sweden. However, the number of illegal immigrants in Sweden has historically been low and should not distort the results much, even though they are likely to cluster in immigrant dense neighborhoods.
References
- Allport, G. (1954). The Nature of Prejudice. Reading, MA: Addison-Wesley.
- Citrin, J., & Sides, J. (2008). Immigration and the Imagined Community in Europe and the United States. Political Studies, 56, 33–56. doi: 10.1111/j.1467-9248.2007.00716.x
- Dinesen, Peter Thisted, and Kim Mannemar Sønderskov. (2015). Ethnic Diversity and Social Trust: Evidence from the Micro-Context. American Sociological Review, 80: 550–573.
- Herda, Daniel. 2010. How Many Immigrants? Foreign-Born Population Innumeracy in Europe. Public Opinion Quarterly, 74, 674–95. doi: 10.1093/poq/nfq013
- Kanter, R. M. (1977). Some Effects of Proportions on Group Life: Skewed Sex Ratios and Responses to Token Women. American Journal of Sociology, 83, 965–90.
- Kokkonen, Andrej, Peter Esaiasson and Mikael Gilljam. 2014. “Migration-based Ethnic Diversity and Social Trust: A Multilevel Analysis of How Country, Neighbourhoodand Workplace Diversity Affects Social Trust in 22 Countries.” ScandinavianPolitical Studies 37: 263-300.
- Krosnick, J. A. (1999). Survey Research. Annual Review of Psychology, 50, 537-67. doi:10.1146/annurev.psych.50.1.537
- Nadeau, R., Niemi, R. G. & Levine, J. (1993). Innumeracy About Minority Populations. Public Opinion Quarterly, 57, 332–47. doi: 10.1086/269379
- Nadeau, R. & Niemi, R. G. (1995). Educated Guesses: The Process of Answering Factural Knowledge Questions in Surveys. Public Opinion Quarterly, 59:, 323–46. doi: 10.1086/269480
- Paulos, J. A. 1990. Innumeracy. New York: Vintage.
- Pettigrew, T. F., & Tropp, L. R. (2006). A Meta-Analytic Test of Intergroup Contact Theory.Journal of Personality and Social Psychology, 90, 751–83. doi: 10.1037/0022-3514.90.5.751
- Putnam, R. D. (2007). E Pluribus Unum: diversity, community in the twenty-first century. The 2006 Johan Skytte Prize lecture. Scandinavian Political Studies 30, 137–74.doi: 10.1111/j.1467-9477.2007.00176.x
- Schneider, S. L. (2008). Anti-Immigrant Attitudes in Europe: Outgroup Size and Perceived Ethnic Threat. European Sociological Review, 24, 53–67. doi: 10.1093/esr/jcm034
- Semyonov, M., & Glikman, A. (2009). Ethnic Residential Segregation, Social Contacts, and Anti-Minority Attitudes in European Societies. European Sociological Review, 25,693–708. doi: 10.1093/esr/jcn075
- Sigelman, L., & Niemi, R. G. (2001). Innumeracy About Minority Populations: African Americans and Whites Compared. Public Opinion Quarterly, 65, 86–94.
- Stolle, D., & Harell, A. (2013). Social Capital and Ethno-racial Diversity: Learning to Trust in an Immigrant Society. Political Studies, 61, 42–66. doi: 10.1111/j.1467-9248.2012.00969.x
- Wong, C. (2007). Little’ and ‘Big’ Pictures In Our Heads: Race, Local Context, and innumeracy About Racial Groups in the United States. Public Opinion Quarterly, 71, 392–412. doi: 10.1093/poq/nfm0


