

Trust and Credibility in the U.S. Federal Statistical System
Childs, Jennifer. H., Fobia, Aleia C., King, R. and Morales, G. (2019). Trust and Credibility in the U.S. Federal Statistical System. Survey Methods: Insights from the Field. Survey Insights: Methods from the Field. Retrieved from https://surveyinsights.org/?p=10663
© the authors 2019. This work is licensed under a Creative Commons Attribution 4.0 International License (CC BY 4.0) 
Abstract
The U.S. Federal Statistical System (FSS) is searching for ways to ensure high quality data in surveys, given declines in response rates and the associated increase in operational costs. They are searching for ways to address problems with public trust in the government, if these issues could hinder their efforts. To address these concerns, the Census Bureau partnered with other federal statistical agencies to collect data to assess attitudes, beliefs, and concerns the public may have regarding federal statistics and the agencies that collect them. This public opinion data enables the FSS to better understand public perceptions, and provides guidance for communicating with the public and for future planning of data collection. This paper examines the impact of various factors on trust in the FSS, including attitudes (belief in credibility and transparency of federal statistics), and behavior (use of federal statistics). This research supports Brackfield and Fellegi’s model of trust in official statistics by providing evidence of a significant relationship between credibility of statistical products and trust in statistics more generally (Brackfield 2011; Fellegi, 1996, 2004, 2010). These data also suggest that promoting trust in statistical products could lead towards increased trust in the agencies that produce them.
Keywords
credibility, government, statistics, survey-taking climate, trust
Acknowledgement
The authors would like to thank Dr. Robert Groves for his vision for this research. We would also like to thank the interagency group who worked on creating this questionnaire, including Shelly Martinez, Morgan Earp, Stephanie Willson, Melissa Mitchell, Laura Rasmussenm and Monica Vines. We would like to thank Nancy Bates, Joanne Pascale, Gina Walejko, Peter Miller and Paul Beatty for their review of this and prior iterations of this work. Disclaimer: This report is released to inform interested parties of research and to encourage discussion of work in progress. Any views expressed on the methodological issues are those of the authors and not necessarily those of the U.S. Census Bureau.
Copyright
© the authors 2019. This work is licensed under a Creative Commons Attribution 4.0 International License (CC BY 4.0)
Trust and Credibility in the Federal Statistical System
Public trust in federal statistics has the potential to affect response rates, operational costs, and data quality. Federal statistics are vital to the federal government, policymakers, and non-profit organizations that rely on these data. These statistics help members of the government, as well as those external to the government, understand the population’s composition, needs, desires and concerns so that they may be able to respond appropriately. In the midst of historically low response rates to government surveys, the United States has also seen declining levels of civic engagement across a wide range of activities, including voter turnout (Jost 2010). The U.S. Federal Statistical System (FSS) is searching for ways to ensure high quality data in ongoing surveys, given declines in response rates and the associated increase in operational costs. If there are problems with public trust, we want to identify and address them because these issues may hinder response rates and associated research efforts.
This line of research is intended to increase understanding of public trust in Federal statistics, which will provide guidance for communicating with the public and for future planning of data collection activities. In this research, we set out to understand the predictors of trust to inform activities that will improve overall public trust of the Federal Statistical System and its statistical products.
Measuring Trust
The issue of trust in government statistics is not unique to the U.S. Across the globe, national statistical offices are recognizing the role of public trust in ensuring high quality data, particularly in an era of constrained resources (Kim 2010; Marozzi, 2014; Banks 2014). Trust in government is an important construct to study and understand in order to ensure that buy-in from the public is present (Paliszkiewicz, 2012; Chanley, Ruduolph, & Rahn, 2000; Kampen,Van de Walle, & Bouckaert, 2006; Banks, 2014, Marrozi, 2014).
Chanley et al. (2000) mentioned that establishing public trust in government is essential in helping political leaders make appropriate decisions, ensure that the goals are aligned to the society’s well-being, and gain the public’s compliance. The researcher further discussed that without the public’s trust, the ‘citizens withdraw support from government and become less willing to comply with governmental decisions’ (Chanley, 2000, p. 240). Kampen, Van de Walle, and Bouckaert (2006) explained that trust in the government is an important factor that helps governments act without coercion and without relying on force to make decisions.
Throughout the literature, multiple definitions exist to explain the trust construct (Thomas, Abts, Stroeken, & Weyden, 2015; Paliszkiewicz, Koohang, Goluchowski, and Nord, 2014; Offe, 1999; Butler, 1991; Paliszkiewicz, 2012). For example, according to Thomas et al (2015) trust is defined as people’s expectations of what an organization must do based on the objectives and principles established by the cultural norm. Similarly, Offe discussed that in order for trust to be present in organizations, institutions, or government, the entity needs to be perceived by its surrounding community as useful, meaningful, and credible.
Due to the difficulty and elusive meaning of trust as well as the numerous definitions that exist in literature to define trust, measuring trust in government has become difficult to accomplish. For example, Marozzi (2014) states that one of the difficulties in measuring trust is ‘whether the concept of trust as well as the concepts of government, state and public institution are similarly interpreted by citizens…’ (p.880). Furthermore, both Marozzi (2014) and Cook and Granoke (2005) agreed that measuring trust can be difficult because distinguishing between active distrust and lack of trust is complicated to assess.
In their paper, Thomas et al. (2015) articulated that there was no general agreement in measuring trust. However, the researchers believed the best practice to measure trust was by using multiple survey questions to assess various institutions (i.e., police, justice, and political parties), and therefore capture the variation across institutions. Thomas et al. (2015) pointed out that the majority of time this does not occur due to different methodologies, where data is often analyzed using one individual item for each particular institution. Likewise, in an earlier study Butler (1991) discussed that trust should be measured using multiple items because trust is a multidimensional construct that is influenced by various conditions. Through a factor analysis, the researcher found that availability, competence, consistency, fairness, integrity, loyalty, openness, promise fulfillment, and receptivity were closely related to public trust in government.
Similar to Thomas et al. (2015) and Butler (1991), Kampen et al. (2006) used multiple variables to assess the relationship between satisfaction with service delivery and public trust in government. The researchers in the study used satisfaction items and trust items to measure public trust in the government. More specifically, four questions were asked to the Flemish community in Belgium (n=1,250) about five public services including police, primary education, garbage collection, transportation by buses and trams, and the Belgian Post. The following items used to assess satisfaction and trust in the study were asked for each institution: 1) To what extent are you satisfied with the service delivery of [institution]?, 2) To what extent do you trust [institution]?, 3) To what extent are you satisfied with the policy with respect to [domain]?. A final item asked about service delivery in general: To what extent are you satisfied with public service delivery in general? Both sets of questions used a 5-point Likert scale. The trust item scale ranged from 1 = very little to 5 = very much, while the satisfaction items had responses where 1 = very dissatisfied and 5 = very satisfied.
The researchers hypothesized that a significant correlation would be found between satisfaction and trust in government agencies. Additionally, they believed these items would significantly measure public trust in the government. The results of the study supported the researchers’ hypotheses where higher disappointment leads to lower trust in the public agency, whereas higher satisfaction would lead to more trust. Based on the results, Kampen et al. (2006) suggested that when measuring or assessing public trust in the government that a government satisfaction component be included in the survey.
Kampen et al. (2006) further discussed that more and more governments are realizing the importance trust has on the success and effectiveness of its implemented policies, which has led many governments to focus on programs that increase trust in their institutions. This new phenomenon called ‘government modernization’ has dominated the political agenda in several countries of the Organization for Economic Cooperation and Development (OECD; Kampen et al., 2006). The primary goal of government modernization has been to increase trust in government. Kampen et al. (2006) mentioned that many countries within the OECD are implementing surveys that assess the level of citizen satisfaction and trust.
In an attempt to understand how statistical institutions and their products are perceived by respondents, an OECD working group developed a survey for measuring trust in official statistics in 2010 (Brackfield 2011). The OECD working group found that several factors affect public trust in government statistics. They summarized the factors into two constructs: 1) trust in statistical products and 2) trust in statistical institutions, which together form trust in official statistics (see Figure 1; Brackfield 2011, Fellegi 1996, 2004; OECD, 2010). The OECD emphasized and made clear that in order to improve trust in government citizens need to be engaged in the decision making process as well as adopt a policy of transparency in their procedures.
The questionnaire developed by the OECD was examined for its applicability in the United States, where the statistical system is decentralized, rather than centralized like in many other countries, and it did not work well (Willson, et al. 2010). Cognitive testing of these questions by the National Center for Health Statistics (NCHS) in 2010 revealed that the survey questions did an inadequate job of conveying intent to the respondents. Most respondents did not understand the questions as asking about their knowledge and opinion of official statistics. A common interpretation was that the questions were asking about respondent knowledge and opinion of the substantive topic itself, for example unemployment or crime (Willson, 2010). When asked about their feelings on the reliability of crime and unemployment statistics, respondents tended to interpret the questions in terms of their experience with being unemployed or with being victims of crime. This pattern of question misinterpretation did not vary greatly by educational attainment. Respondents with higher and lower levels of education were both likely to misunderstand the questions.
Using the OECD questionnaire as a starting point, the Census Bureau partnered with NCHS, the National Agricultural Statistics Service, the U.S. Department of Agriculture’s Economic Research Service, the Statistics of Income Division of the Internal Revenue Service and the Office of Management and Budget to develop a questionnaire specifically to be administered in the United States context (Childs, Willson, Martinez, Rassmussen, and Wroblewski, 2012; Willson, 2012). This group of Federal statistical agencies make up the Federal Statistical System Working Group (FSS Working Group).
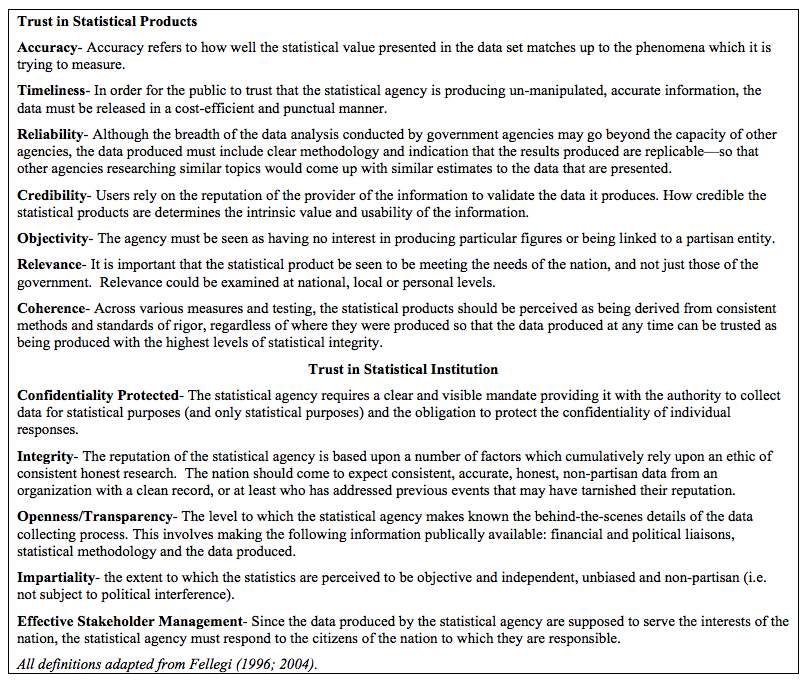
Figure 1. Fellegi’s Constructs to Measure Trust
Based on the earlier NCHS cognitive testing, the FSS Working Group created a new set of questions to measure U.S. public opinion and trust in the FSS. Questionnaire development started with the premise that we needed to measure awareness of statistics and statistical institutions and data use first, before proceeding to questions addressing trust. We focused on factors that would be familiar to the general population, who are not likely to be sophisticated data users with a high level of knowledge of the statistical system. This included questions about general knowledge of particular statistics such as the population count, death by particular diseases, and the consumer price index. These questions draw on previous research that examined the U.S. public’s knowledge of statistics (Curtin, 2007) and are designed to be understood by the general population. In developing the rest of the questions, the FSS Working Group also considered questions used by the Office of National Statistics and the National Centre for Social Research in the United Kingdom and by the Eurobarometer, a series of regularly occurring public opinion surveys of European countries. The final product, the FSS Trust Survey, was pretested in 2012. As part of the pretesting, we conducted a factor analysis to help us chose the individual items to include in our survey and to interpret how the items measuring trust in statistics work together and fit with the Fellegi model (Earp, et al. 2012). Details of this pretesting can be found elsewhere (Childs, et.al., 2012; Earp, et al., 2012; and Willson, 2012).
The FSS Trust survey consisted of 19 core items that are designed to capture 1) respondents’ history of data use, 2) trust in statistical products, and 3) trust in statistical institutions. (Later iterations of the survey included only 5 items, but measured these constructs as well). Trust in statistical products is measured by questions on credibility and relevance, while trust in statistical institutions is measured by questions on confidentiality and transparency. In this paper we examine whether or not someone has ever used federal statistics in addition to demographic variables as possible predictors of trust. Having a history of data use is important because trust between individuals has been shown to increase following frequent contact (Mayer, Davis and Schoorman 1995; McAllister 1995; Ferrin and Dirks 2003; Dietz and Hartog 2006). In this context, data users have formed a relationship with statistics and the statistical institutions that produce these data. Accordingly, we might expect higher levels of trust to be a result of a relationship formed between the data user and the data.
Methods
The Gallup Daily Poll is a daily survey asking U.S. adults about various political, economic, and well-being topics. The Census Bureau established a relationship with Gallup whereby the FSS Working Group added questions to the daily poll on trust, credibility, transparency and data use. From February 2012 until September 2013, we added 25 questions to a sample of cases in the ongoing survey. Approximately 19 of the 25 questions were core questions that did not vary throughout the study and approximately six were periodically rotated. Core questions focused on awareness of and attitudes towards federal statistics and federal statistical agencies. Figure 2 below shows the questions that we reference in this paper.
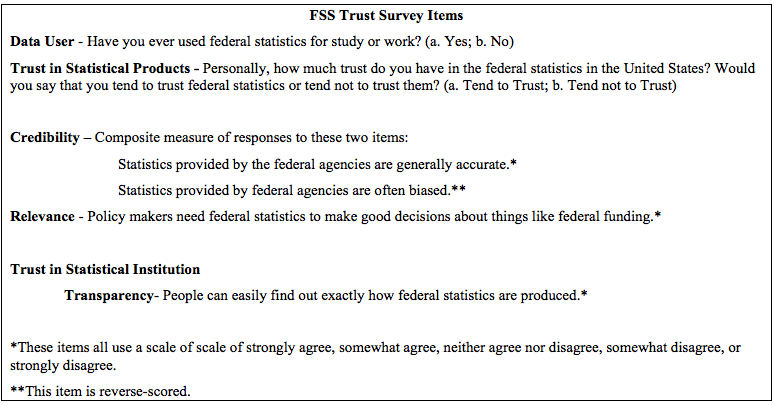
Figure 2. Question wording for FSS Trust Survey Items
Gallup’s Methods
The Gallup Daily Tracking Survey consists of computer-assisted telephone interviews with randomly sampled respondents, aged 18 and older, including cellphone users and Spanish-speaking respondents from all 50 U.S. states and the District of Columbia. Gallup conducts 1,000 surveys almost daily (350 out of 365 days per year). For this study, a random selection of 200 respondents nightly were administered the census module.
Gallup Daily tracking relies on dual-frame sampling (which includes random-digit-dial (RDD) list-assisted landline interviewing and RDD wireless phone sampling to reach those in wireless-only and wireless-mostly households), and a random selection method for choosing respondents within the landline household. To compensate for disproportionalities in selection probabilities and nonresponse, Gallup weights the data daily. Gallup further post-stratifies the data using an iterative proportional fitting (i.e., raking) algorithm to account for nonrandom nonresponse by phone status, age, sex, region, education, population density, ethnicity, and race. Gallup calculates daily weights for each survey track separately and for the combined data. Gallup computes state weights twice per year and congressional district and MSA weights once per year. The American Association for Public Opinion Research’s AAPOR- III response rate averaged 7 percent for the Wellbeing track during the time period reported on in this study.
Although the Gallup Daily Tracking Survey is nationally representative, it does not meet Census Bureau quality standards for use as official national estimates. The Census Bureau and the Federal Statistical System used the results from this survey to monitor awareness and attitudes, as an indicator of the impact of potential negative events, and as an indicator for potential changes in communication campaigns.
Results
Using logistic regression, we modeled trust in statistics based on approximately 23,000 responses. In the model, we predicted the general measure of ‘Trust in Statistical Products’ (the dependent variable) using independent variables indicating whether the respondent had ever used federal statistics for school or work purposes (‘Data User’), belief in ‘Credibility,’ belief in ‘Transparency,’ and demographics, as well as interaction effects. We attempt to control for the complex design of the survey using the frame data that was available in variance estimates. We created two variance strata to account for whether a respondent completed the interview on a landline phone or on a cell phone. In addition, we randomly assigned each response to one of four variance PSUs, so that we could implement Jack Knife variance estimation.
Data Use
Given the low response rate of the survey, results are intended to be used for tactical decision-making and not for estimating the population. The findings are presented in simple visualizations but are based on multivariate models predicting ‘trust’ and ‘credibility’ controlling on key covariates. Being a Data User increases the likelihood of ‘Trust in Statistical Products’ (see Table 1). Respondents who have used statistics for work or study tend to report trusting federal statistics more than those who have not. The relationship between trust and data use suggests that a distinction between interpersonal and institutional trust is useful (Bachmann 2011). Interpersonal trust is based on contact between individuals while institutional trust depends on rules of behavior and sanctions for violating those rules. Data users have had contact with statistics and the trust they have in statistics can be interpreted as similar to interpersonal trust. Respondents who have used the statistics trust them more than those who have not. In preliminary analysis of these data, we found that Data Usage is more influential than merely knowing what agency produces the statistics (data not presented here).
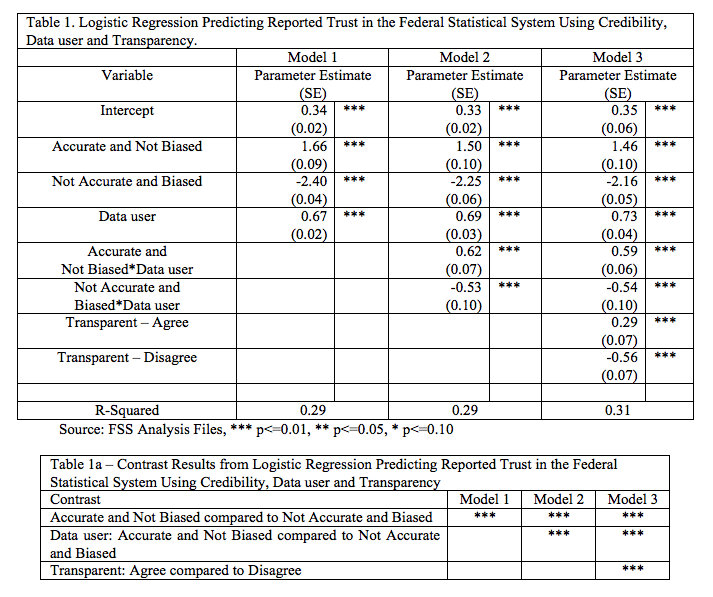
Source: FSS Analysis Files, *** p<=0.01, ** p<=0.05, * p<=0.10
Description of the variables used in the logistic regression models:
- Credibility – Whether a respondent reported believing that (1) statistics are accurate and not biased, (2) statistics are not accurate and are biased, or (3) some other belief (reference group).
- Data user – Whether a respondent had reported using federal statistics for study or work.
- Belief In Transparency – Whether a respondent reported agreeing, disagreeing or had no opinion (reference group) on whether they believed it was easy to find out how federal statistics are produced. The interactions with transparency are not presented due to lack of significance and to save space.
Credibility
This study found that belief in Credibility of statistics is predictive of general ‘Trust in Statistical Products’ (see Table 1). The measure of Credibility – whether people report agreeing that statistics are generally accurate and disagree that statistics are biased – is strongly associated with ‘Trust in Statistical Products.’ Reported belief that statistics are accurate and non-biased is evidence of trust in the products of the FSS. The effect of Credibility on ‘Trust in Statistical Products’ is increased for Data Users, though the pattern is the same for non-data users.
Transparency
Those who believe that agencies are Transparent tend to report ‘Trust in Statistical Products’ more than those who believe they are not Transparent (shown in Tables 1, 2 and 3). There are no interactions with Credibility, Data User or demographics on this effect. However, generally, Data Users are more likely to believe in Transparency than non-data users (data not shown). Belief in the transparency of agencies reflects institutional trust in the specific arrangements that are set up to guarantee the reliability and validity of Federal statistics.
Demographics and Interaction Effects
Contrary to past research (Glaeser et al. 2000), this study found that people identifying as either African American or Hispanic tend to report ‘Trust in Statistical Products’ more than people identifying as White (see Table 2). While Credibility was still positively related to ‘Trust in Statistical Products,’ the effect of Credibility on Trust is stronger for Whites (see Table 2). The effect of being a Data User on Trust is stronger for Whites, while the relationship between being a Data User and Trust is weaker for Hispanic respondents than other respondents (see Table 2). This suggests that both interpersonal and institutional trust do not have the same impact on Blacks and Hispanics as seen with Whites. Further research on this particular finding would help illuminate the differences between White and Black and Hispanic data users as well as possible differences in attitudes towards statistics more generally.

Source: FSS Analysis Files, *** p<=0.01, ** p<=0.05, * p<=0.10
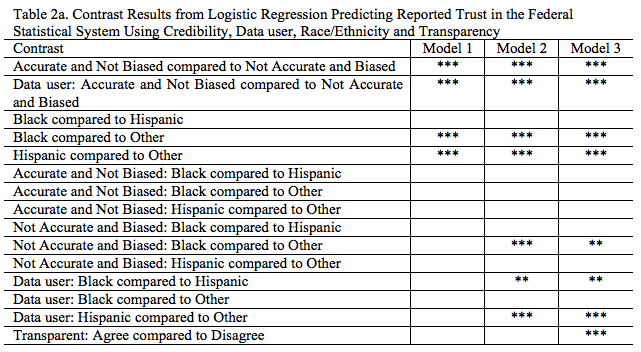
Source: FSS Analysis Files; *** p<=0.01, ** p<=0.05, * p<=0.10
- Description of the variables used in the logistic regression models: Race/Ethnicity – White (reference group), Black, Hispanic, Other (includes Asian, American Indian/Alaska Native, Native Hawaiian or Pacific Islander, and multiple races reported); Education – Less than a college education (reference group), Any college education.
- We also looked at models accounting for income but saw generally non-significant results, and for age there was a modest effect showing that younger people tended to trust more than older people.
- The interactions with transparency are not presented due to not being significant and to save space.
With regard to educational differences, those with at least some college tend to report ‘Trust in Statistical Products’ more than those with no college (see Table 3). The effects of Credibility and being a Data User on Trust are stronger for those with college education than those without college education, though again, the same patterns are visible with both groups (see Table 3).
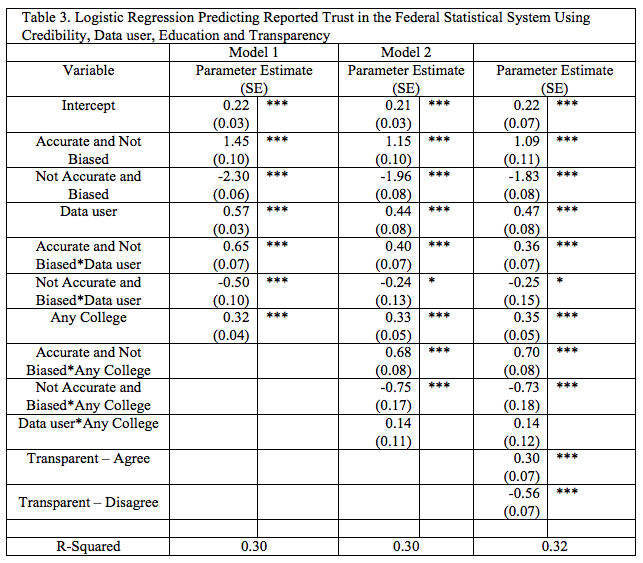
Source: FSS Analysis Files, *** p<=0.01, ** p<=0.05, * p<=0.10
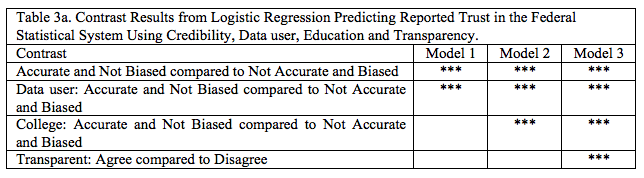
Source: FSS Analysis Files; *** p<=0.01, ** p<=0.05, * p<=0.10
- The interactions with transparency are not presented due to not being significant and to save space.
Trust in Statistical Products seems to be heavily based on views of Credibility (that statistics are accurate and not biased). This association is strengthened for Data Users and those with at least some college education; however, it is weaker for Blacks and Hispanics. Respondents who trust statistics tend to believe that the agencies are Transparent.
Discussion
This research supports the OECD model of trust in official statistics by providing evidence of a significant relationship between credibility of statistical products and trust in statistics more generally (Brackfield 2011; Fellegi, 1996, 2004, 2010). Also in accordance with past research (Mayer, Davis and Schoorman 1995; McAllister 1995; Ferrin and Dirks 2003; Dietz and Hartog 2006), being a data user, implying contact with federal statistics, increases reported trust in the statistics themselves (or vice versa, that trusting federal statistics makes a person more likely to report using federal data). Data users have formed a relationship with statistics and the statistical institutions that produce this data; accordingly, we interpret their higher levels of trust to be a result of a relationship formed between the data user and the data.
With regard to institutional and interpersonal trust, in the case of federal statistics, communications strategies that demonstrate the accuracy of statistics and emphasize the ways in which individuals are held accountable within the FSS could help increase institutional trust. Further research could identify the factors that contribute to beliefs that statistics are accurate and unbiased.
These data suggest that promoting trust in statistical products could lead towards increased trust in the agencies that produce the data. Increasing the number of data users, perhaps through partnerships with educational institutions, could also increase trust, however the effect may not be consistent across demographic groups. Public campaigns that communicate evidence of accuracy of statistics and transparency in the collection, analysis and dissemination of statistics could also facilitate increased trust in official statistics. Though, notably, belief in transparency seems to have a small impact on trust, compared to credibility of the data. This research also suggests that targeting audiences (e.g., race, ethnicity, level of education) for different messages may possibly be effective, but this topic will need more research to be conclusive.
References
- Bachmann, R. (2011). At the crossroads: Future directions in trust research. Journal of Trust Research 1: 203-213.
- Banks, G. (2014). Restoring Trust in Public Policy: What Role for the Public Service?. Australian Journal Of Public Administration, 73(1), 1-13. doi:10.1111/1467-8500.12053
- Brackfield, D. (2011). OECD Work on Measuring Trust in Official Statistics. Brackfield, D. (2011.) OECD Work on Measuring Trust in Official Statistics. Int. Statistical Inst.: Proc. 58th World Statistical Congress, 2011, Dublin (Session STS070).
- Butler Jr., J. K. (1991). Toward Understanding and Measuring Conditions of Trust: Evolution of a Conditions of Trust Inventory. Journal Of Management, 17(3), 643.
- Chanley, V. A., Rudolph, T. J., & Rahn, W. M. (2000). The origins and consequences of public trust in government. Public Opinion Quarterly, 64(3), 239-256.
- Childs, J.H., Willson, S., Martinez, S.W., Rasmussenm L., & Wroblewski, M. (2012). Development of the federal statistical system public opinion survey. In: JSM Proceedings, Survey Research Methods Section. American Statistical Association, Alexandria, VA.
- Cook, T. E., & Gronke, P. (2005). The Skeptical American: Revisiting the Meanings of Trust in Government and Confidence in Institutions. Journal Of Politics, 67(3), 784-803. doi:10.1111/j.1468-2508.2005.00339.x
- Dietz, G. & Hartog, D. N. (2006). Measuring Trust Inside Organizations. Personnel Review, 35: 557–588.
- Earp, M., Mitchell, M., Childs, J.H., Miller, P. & Martinez, S.W. (2012). Factors of Trust in Statistics that Influence Public Perceptions of Use of Administrative Records. Paper presented at the Joint Statistical Meetings of the American Statistical Association.
- Fellegi, I. (1996). Characteristics of an effective statistical system. Canadian Public Administration, 39(1), 5-34.
- Fellegi, I. (2004). Maintaining the Credibility of Official Statistics. Statistical Journal of the United Nations ECE (21) 191–198.
- Fellegi, I. (2010). Report of the Electronic Working Group on Measuring Trust in Official Statistics, OECD Meeting of the Committee on Statistics, June 2010, Paris.
- Ferrin, D. L. & Dirks, K.T. (2003). The Use of Rewards to Increase and Decrease Trust: Mediating Processes and Differential Effects, Organization Science, 14: 18-31.
- Glaeser, E. L., Laibson, D.I., Scheinkman, J.A., & Soutter, C.L. (2000). Measuring Trust. Quarterly Journal of Economics. 115 (3): 811-846.
- Jost, S. (2010). 2010 Census Integrated Communications Campaign. An Era of Declining Civic Engagement. Conference Presentation at Association of Public Data Users Annual Meeting 2010, Washington, D.C. http://apdu.org/wp-content/uploads/2011/12/Jost_9-20-10APDUConference.pdf
- Kamplen, J. K., De Walle, S. V., & Bouckaert, G. (2006). Assessing the Relation between Satisfaction with Public Service Delivery and Trust in Government. Public Performance & Management Review, 29(4), 387-404.
- Kim, S. (2010). Public Trust in Government in Japan and South Korea: Does the Rise of Critical Citizens Matter? Public Administration Review, 70(5), 801-810.
- Marozzi, M. (2014). Measuring Trust in European Public Institutions. Social Indicators Research, 123(3), 879-895. doi:10.1007/s11205-014-0765-9.
- Mayer, R.C., Davis, J.H., & Schoorman, F.D. (1995). An Integrative Model of Organizational Trust. Journal of the Academy of Management, 20: 709-734.
- McAllister, D. J. (1995). Affect and Cognition-Based Trust as Foundations for Interpersonal Cooperation in Organizations, Journal of the Academy of Management, 38: 24-59.
- OECD Working Group. (2011). Measuring Trust in Official Statistics—Cognitive Testing. Report to the OECD of the Electronic Working Group on Measuring Trust in Official Statistics. http://www.oecd.org/std/50027008.pdf.
- Offe, C. (1999). How Can We Trust Our Fellow Citizens, in: Mark E. Warren (ed.), Democracy and Trust, Cambridge: Cambridge University Press, 42–87.
- Paliszkiewicz, J. (2012). Managers’ Orientation on Trust and Organizational Performance. Jindal Journal of Business Research, 2 (1), 153-161. doi: 10.1177/2278682113476164
- Paliszkiewicz, J., Koohang, A., Gołuchowski, J., & Nord, J. H. (2014). Management trust, organizational trust, and organizational performance: Advancing and measuring a theoretical model. Management & Production Engineering Review (MPER), 5(1), 32-41. doi:10.2478/mper-2014-0005
- Pew Research Center. (2015). Beyond Distrust: How Americans View Their Government. http://www.people-press.org/files/2015/11/11-23-2015-Governance-release.pdf.
- Thomas, T., Abts, K., Stroeken, K., & Vander Weyden, P. (2015). Measuring Institutional Trust: Evidence from Guyana. Journal Of Politics In Latin America, 7(3), 85-115. Retrieved February 7, 2017, from https://journals.sub.uni-hamburg.de/giga/jpla/article/view/901
- Willson, S. et al. (2010). Cognitive Interview Evaluation of Survey Questions Measuring Trust in Official Statistics. Questionnaire Design Research Laboratory, National Center for Health Statistics, Centers for Disease Control and Prevention. Internal Report.
- Willson, S. (2012). Cognitive Interview Evaluation of the Federal Statistical System Trust Monitoring Survey: Results of interviews conducted in October, 2011. Questionnaire Design Research Laboratory, National Center for Health Statistics, Centers for Disease Control and Prevention. Internal Report.
-
Keywords
calibration CATI coverage coverage bias cross-national surveys data linkage data quality European Social Survey experiment face-to-face face-to-face survey Facebook hard to reach populations incentives item nonresponse measurement measurement error mixed-mode surveys multitasking non-probability samples Nonresponse nonresponse bias nonresponse rates paradata PIAAC Probability sample probability samples QR codes rare populations response rate Satisficing social desirability Social media survey survey-taking climate survey data survey management survey methods Telephone survey telephone surveys total survey error unit nonresponse validity web survey Web surveys weighting
