

Change of mode, change of bias? An analysis of differences in migrant survey participation following mode changes in the Austrian Social Survey (SSA) and the Austrian segment of the European Social Survey (ESS)
Nikita Kvir  Johannes Kepler University of Linz, Austria
Dimitri Prandner Johannes Kepler University of Linz, Austria
Kvir, N., & Prandner, D. (2026). Change of mode, change of bias? An analysis of changes in migrant survey participation following mode changes in the Austrian Social Survey (SSA) and the Austrian segment of the European Social Survey (ESS). Survey Methods: Insights from the Field. Retrieved from https://surveyinsights.org/?p=20303.
© the authors 2026. This work is licensed under a Creative Commons Attribution 4.0 International License (CC BY 4.0) 
Abstract
Migrants are a diverse and potentially disadvantaged minority group which makes them hard-to-reach and hard-to-survey. As migrant research often relies on general population survey studies, it is important to understand the potential consequences of these surveys shifting from traditional face-to-face to mixed-mode interviews for the composition of migrant samples. By comparing the Austrian segment of the European Social Survey (ESS) and the Social Survey Austria (SSA) to the official Austrian microcensus (MZ) from the years 2016 to 2023, we find that shares of respondents with a migration backgrounds are significantly lower in both social surveys, irrespective of data collection mode. In addition, push-to-web contributes to a higher share of the formally higher educated, particularly among those with a migration background.
Keywords
coverage bias, digital accessibility, European Social Survey, hard to reach populations, immigrants, mixed-mode surveys, survey methods, Web surveys
Copyright
© the authors 2026. This work is licensed under a Creative Commons Attribution 4.0 International License (CC BY 4.0)
1. Introduction
Despite strong efforts in recent years, high-quality survey-based studies that focus on migrant minorities remain scarce. Moreover, a substantial part of the studies conducted rely on non-probability samples. Because of this, the accurate representation of migrant minorities in general population studies is crucial for understanding these groups’ societal position, the challenges they face, and their attitudes. Such data enables researchers to analyse social inequalities and the mechanisms of inclusion and exclusion more effectively whereas misrepresentation or underrepresentation of migrants in general population surveys may distort research findings and lead to biased conclusions (Pötzschke, 2024; Rinken and Pötzschke, 2022).
This issue has gained new relevance in recent years. For instance, the European Social Survey (ESS) temporarily adopted a mixed-mode ‘push-to-web’ design in several countries in response to the COVID-19 pandemic and subsequently decided to institutionalize this approach, with face-to-face interviewing scheduled to be phased out by 2027 across Europe (ESS, 2022). This decision reflects the accumulation of methodological developments and empirical evidence indicating that alternative modes – particularly within mixed-mode designs – have increasingly been shown to be viable under specific conditions while maintaining probability-based principles (de Leeuw, 2005; Couper, 2017; Cornesse et al., 2020). In this sense, the pandemic acted less as a point of rupture than as a catalyst that accelerated ongoing methodological experimentation. At the same time, changes in survey mode are not merely technical adjustments; they directly affect sample composition and data quality and therefore continue to provoke debate within the survey research community (Cornesse and Blom, 2023).
This takes us back to minority subpopulations that are hard-to-reach, such as migrants (Tourangeau et al., 2014). Migrants constitute a diverse and potentially disadvantaged population whose experiences, including socioeconomic integration, differ from those of the native-born population in many countries (Pötzschke, 2024). Their generally higher and more selective non-response has long made accurate representation in general population surveys challenging (see Lipps et al., 2013). Various strategies have been implemented to address these issues – including the use of multilanguage surveys (Aschauer et al., 2019; Brücker et al., 2023; Pfündel et al., 2021) and the oversampling of areas with higher migrant populations (Lynn et al., 2018). However, these solutions are hardly generalizable, as they depend e.g., on the availability of specific registers and background data. This has important implications. Even if the absolute number of migrants in a sample remains constant, the internal composition of this group may change as mode shifts happen. As type of internet access and digital literacy are still to some degree unequally distributed (Aksoy and Poutvaara, 2021; World Health Organization, 2020), such aspects could become additional barriers, as participation in web-based surveys tends to skew towards more digitally skilled and highly educated respondents (Cornesse and Blom, 2023). Such changes may go unnoticed if only gross proportions are considered, yet they have the potential to bias comparative research.
To address these issues, our study explores the following research questions:
- How do survey mode shifts affect overall sample composition, particularly with respect to the representation of the general population and migrants as a hard-to-reach group?
- How does sample composition within migrant subsamples change as survey modes shift?
In the following section, we review the current state of research on how mode changes affect sample composition. Next, we examine migrants as a hard-to-reach target population for surveys (section 3). Section 4 introduces the case example and the data used: Austria is a particularly interesting case given its comparatively high migrant population and the absence of survey programmes specifically focused on them. However, several general population surveys exist that aim to adequately capture the migrant subpopulation while also undergoing mode changes. By comparing the Austrian segment of the European Social Survey (ESS) and the Social Survey Austria (SSA, the Austrian survey representing the country in the ISSP – International Social Survey Programme) with the official microcensus (MZ – Mikrozensus), we illustrate how survey modes affect the overall sample composition, and whether the observed effects within the migrant population match those seen in the general population (section 5 and 6). The article closes with a discussion (section 7).
2. Mode Shifts in General Population Surveys
While face-to-face interviews have long been regarded as the ‘gold standard’ of survey research as they tend to yield high data quality, they have come increasingly under scrutiny. As response rates for face-to-face interviews decline due to more frequent refusals and contact failures (de Leeuw et al., 2018; Lynn, 2020; Prandner et al., 2023), achieving representative samples requires substantially more effort than in the past (Wolf et al., 2021). Moreover, in-person fieldwork is considered expensive, and the infrastructure required has severely diminished in many countries in recent years. Field service providers have started to shift their operations towards alternative forms of data collection methods, often favouring self-completion designs with web-based data collection (Prandner et al., 2023).
These structural developments intersect with long-standing efforts to modernise data collection. The seminal work by Dillman (1978, see also 2011 and 2022) on the idea of Tailored Design Method (TDM) demonstrated that mail and telephone surveys can match the data quality of face-to-face methods – and that is for a fraction of the cost. Academic and official statistics communities have since sought to extend this cost-efficiency to web surveys. Yet as no centralized registers for internet users exist, probability-based web sampling remains difficult. So far, the use of traditional sampling frames (e.g., administrative resident registers) combined with personalised invitation letters to web questionnaires have kept the risk of self-selection bias within reasonable limits (Bethlehem, 2010). In addition, the continuous expansion of internet access has reduced the risk of sampling related errors over time. Nevertheless, self-administered computer-assisted web interviews (CAWI) generally yield “lower response rates than in traditional modes” such as computer-assisted telephone interviews (CATI) or self-administered pen-and-paper interviews (PAPI) (Daikeler et al., 2020, p. 530).
In response to these challenges, a range of cross-national survey programmes – such as the ESS or the ISSP – adopted mixed-mode designs combining web-based formats (CAWI) with more traditional modes of data collection (such as PAPI) rather than switching entirely to the web (ESS, 2022). While these mixed-mode designs further reduce the risk of undercoverage associated with web surveys, they introduce mode effects by design (Dillman, 2017; Wolf et al., 2021). Potential differences in sample composition depending on the survey mode may affect the answers to substantive questions (Penker and Eder, 2024).
Recent empirical studies shed light on both the potential and the complexity of mixed-mode approaches. For example, in the German segment of the 2017/18 European Values Survey (EVS), self-administered mixed-mode designs involving web and paper questionnaires were not only more cost- and time-efficient than computer-assisted personal (face-to-face) interviews (CAPI), but also achieved higher response rates (Wolf et al., 2021). Notably, the sample composition hardly differs between the designs, as all showed an overrepresentation of highly educated respondents and an underrepresentation of non-citizens, with the face-to-face mode only partially mitigating these imbalances. Similarly, Lindholm et al. (2024) reported mode-related differences in age, education and labour market status in the Finnish and Swiss samples of the 2020 ISSP. However, the paper questionnaire (PAPI) helped counterbalance the biases introduced by the web mode (CAWI).
3. Migrants as a Hard-to-Reach Population for Survey Studies
The term ‘migrant’ is typically used to describe diverse minority populations that are potentially disadvantaged due to social and economic marginalization and exclusion (Pötzschke, 2024). As migrants may encounter language barriers or may not be part of specific registers (e.g., social security or household registers) (Lipps et al., 2013; Maehler et al., 2017), they are not only hard-to-reach, but also hard-to-survey (Tourangeau et al., 2014). This problem is exacerbated by the fact that only comparatively few studies are explicitly designed to focus on migrant populations (see e.g., Aschauer et al., 2019). In many European countries a large proportion of existing survey data on migrants comes from either cross-national (e.g., the ISSP or the ESS) or national general population survey programmes like the Austrian SSA (see Morales et al., 2024).
However, migrants are only covered as subpopulations in these general population surveys and are frequently underrepresented (Lipps et al., 2013; Prandner and Weichbold, 2019; Rinken and Pötzschke, 2022). This is driven by both higher non-response and more frequent refusals among migrant respondents compared to the native-born population (Deding et al., 2013; Maehler et al., 2017). Explanations for non-response often point to higher mobility, irregular work patterns (Steiner and Landös, 2019), and even include factors like perceived cultural distance and social isolation (Deding et al., 2013). Language barriers may further hinder participation to a survey (Maehler et al., 2017), although offering a choice of language during all phases of recruitment and interviewing does not necessarily eliminate response rate disparities (Deding et al., 2013; Morales and Ros, 2013; Prandner and Weichbold, 2019). Some migrants may also simply feel insufficiently informed or motivated to participate in surveys on issues related to their host country (Lipps et al., 2013, p. 261). The choice of substantive topics covered may therefore contribute to the decision-making process of migrants on whether to participate in a survey or not.
The mode of data collection further complicates how far general population surveys can cover. Although Kappelhof (2015) reports higher response rates among migrants for push-to-web compared to face-to-face surveys (CAPI), web-based modes (CAWI) pose a higher risk of selective non-response. Older individuals, first-generation migrants, men, and those with lower levels of education are disproportionately likely to be underrepresented in web surveys (Kappelhof, 2015; Lipps et al., 2013).
Building on this existing research, we add to it as we contextualise how general population survey data has been collected in recent years and analyse survey studies within the same specific research programmes between 2016 and 2023. This provides a nuanced view of mode effects across multiple points in time, while also including more recent developments, such as shifts in mode surveys related to the COVID-19 pandemic. This addresses the research gap, since representation issues are shaped not only by who is surveyed, but also by how surveys are administered. The shift to web-based and mixed-mode designs must be viewed through this lens, as different modes interact with known barriers to migrant participation and may intensify representation bias.
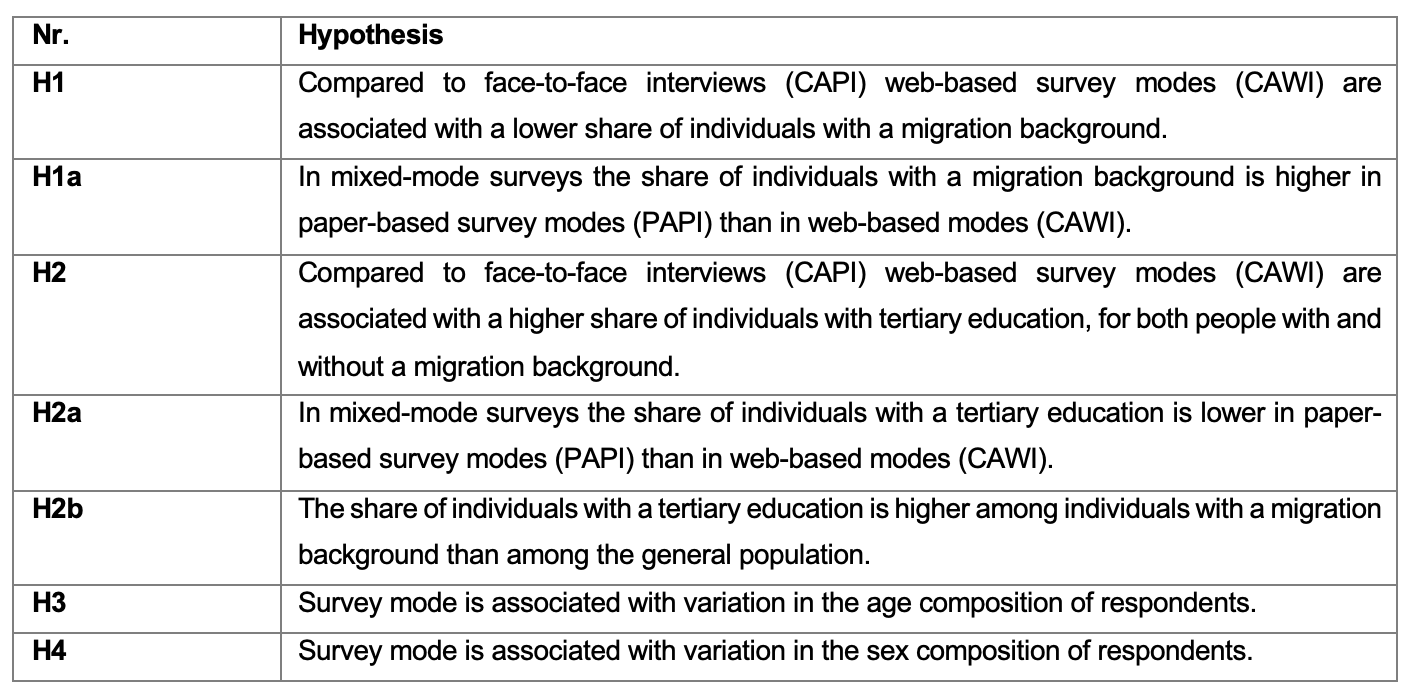
Based on the last two sections, we formulate the following set of hypotheses (see Table 1). However, the literature highlights some inconsistencies regarding sociodemographic factors such as age and sex (see for sex e.g., Kappelhof, 2015; Prandner and Weichbold, 2019). While certain earlier studies (see Bethlehem, 2010; Fricker et al., 2005) suggest that web surveys struggle to reach older age groups, this notion has been somewhat contested (Blom et al., 2015; Wu et al., 2022). Because of this only explorative hypotheses are formulated for age and sex as to explore whether their association with survey participation differs across survey modes (irrespective of a migration background) (H3 and H4).
Table 1: Hypotheses
4. Background, Data and Methodology
In Austria, the term ‘migrant’ is only loosely defined and applies to very different groups such as refugees. At official level, migrants are persons with a migration background (‘Migrationshintergrund’). Statistik Austria (2024b, p. 18) attributes this informal status to individuals with both parents born outside the borders of modern-day Austria. Whether someone themselves was born in Austria is relevant for a further differentiation between first- and second-generation migration only.
Although the Ethnic and Migrant Minorities (EMM) Survey Registry (Morales et al., 2024) lists 119 Austrian survey studies including migrants at the time of writing, most entries are general population surveys, such as the ESS or the SSA. While these feature a significant proportion of migrants in their samples, they rarely target migrant groups directly. They do also face challenges when it comes to recruiting. While centralized registers such as the Zentrales Melderegister (ZMR) provide information on citizenship, country of birth and religion (but not e.g., native language) of every resident, data access is strictly regulated, time-consuming and expensive. Thus, the ESS and the SSA rely on a Postal Service address register for sampling. Despite its broad coverage, underrepresentation persists even among Austria’s largest migrant groups (Prandner and Weichbold, 2019).
Our analyses are based on three Austrian population surveys conducted before, during and after the COVID-19 pandemic: the MZ, the ESS and the SSA (see Table 2).
The Statistik Austria microcensus is the closest available alternative to a general population and housing census taken in person, as the actual census has been register-based since 2006. As households are drawn randomly from the ZMR the risk of under-sampling should be low and yet biases cannot be excluded completely. Already before the pandemic, the MZ used several modes of data collection. The first interview is conducted face-to-face (CAPI), with the pandemic resulting in an exception, as telephone interviews (CATI) were foreseen for (up to four) subsequent interviews only. When lockdown measures were eased, follow-up interviews were conducted over the telephone again, with web questionnaires (CAWI) serving as an alternative. As participation is enforced with fines, the response rate remains stable at approximately 95% (Statistik Austria, 2022, 2024a). We decided to only use data from the fourth quarter of a year, as ESS fieldwork traditionally takes place in this period (see Table 2). By contrast, the SSA fieldwork period varies, but the sample planning for the SSA is typically done in the first quarter of the year using MZ data from the previous year’s fourth quarter (IFES, 2021, p. 10; Prandner, 2019, p. 515).
Both the Austrian segment of the ESS and the SSA are based on probability sampling from a Postal Service address register and both commission the Institut für Empirische Sozialforschung (IFES) to conduct the fieldwork. Yet, the two surveys responded differently to the pandemic. The ESS switched from face-to-face (CAPI) to self-completion for Round 10 (2021). Invitation letters to a web questionnaire (CAWI) were sent, with an unconditional incentive of 5 euros attached and another 10 euros conditional on participation (ESS ERIC, 2023c). A paper questionnaire (PAPI) accompanied the second reminder (ESS ERIC, 2023c). The SSA switched to telephone interviews (CATI) as the postal register was matched with public telephone directories. With the suspension of COVID-19 measures in June 2021, the remaining fieldwork was conducted face-to-face (IFES, 2021). In 2023, the ESS returned to face-to-face for Round 11, whereas the SSA replicated the push-to-web scheme used for the ESS Round 10 (IFES, 2023, pp. 5–6). The response rate for both social surveys dropped substantially during the pandemic from approx. 50% (2018) to 30% (2021) and has not recovered since (ESS ERIC, 2023b, 2023c, 2024a; IFES, 2018, 2021, 2023).
Table 2: Characteristics of surveys
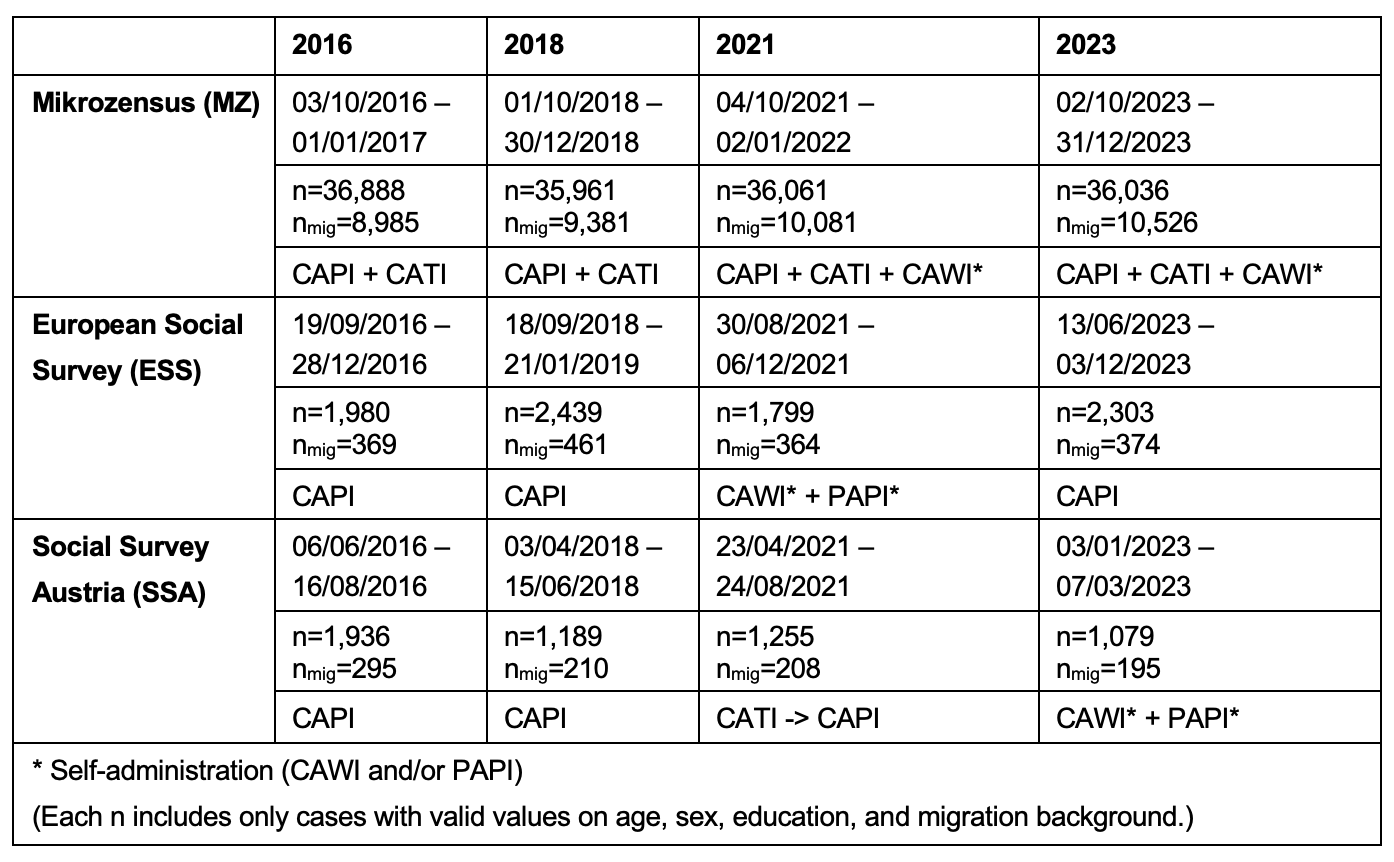
Data source: Bacher et al. (2019), ESS ERIC (2023a, 2023b, 2023c, 2024a), Hadler et al. (2019, 2022, 2024), and Statistics Austria (2020a, 2020b, 2021, 2023).
We differentiate between the time of data collection (2016, 2018, 2021 and 2024), the survey (MZ, ESS and SSA) and the data collection mode (CAPI – face-to-face, CATI – telephone, CAWI – web and PAPI – paper) (see Table 2).
As each analysis is carried out on both a general and reduced migrant sample, we have to define both groups. Whereas the general population includes all respondents, the migrant population is restricted to respondents with a migration background. Unlike Statistik Austria (2024b) we require only one parent to have been born abroad in order to ascribe the migration background to an individual. Consequently, the variable of interest was created manually. As neither the country of birth nor the respondent’s nationality is taken into account, our operationalization provides for high heterogeneity of migrants: respondents born in Austria to German parents are treated the same as respondents born in Turkey to Turkish parents. As some were unable to name the birth countries of their parents, a relatively small number of cases were excluded from each dataset.
We expect shifts towards web-based modes (CAWI) to result in sample composition differences in relation to the migration background, higher education as well as age and sex. For reasons of standardisation, respondents under the age of 18, as well as those outside the binary of female (0) or male (1) were excluded. Age was capped at 95. As education is measured differently between surveys, a binary variable indicates whether (1) or not (0) a respondent has completed a tertiary degree (corresponding to levels 6 to 8 of the ISCED 2011).
Firstly, we will use descriptive analysis to examine any potential differences in sample composition over time as well as in relation to the survey and its modes. Second, we test whether these differences can be attributed to a specific survey mode. To do so, we use an unweighted pooled dataset and binary logistic and ordinary least squares (OLS) regression models. We assess all hypotheses and assumptions by evaluating and comparing Average Marginal Effects (AME) and unstandardised scale coefficients. All models are built identically and estimated with base R 4.5.0. Missing values are dealt with listwise deletion.
5. Descriptive Analysis of Sociodemographic Differences in Sample Composition
In this section, we investigate potential differences to survey sample composition across survey, data collection mode and time of data collection using descriptive analysis.
Table 3: Share of respondents with a migration background, rounded and with the respective number of observations in parentheses
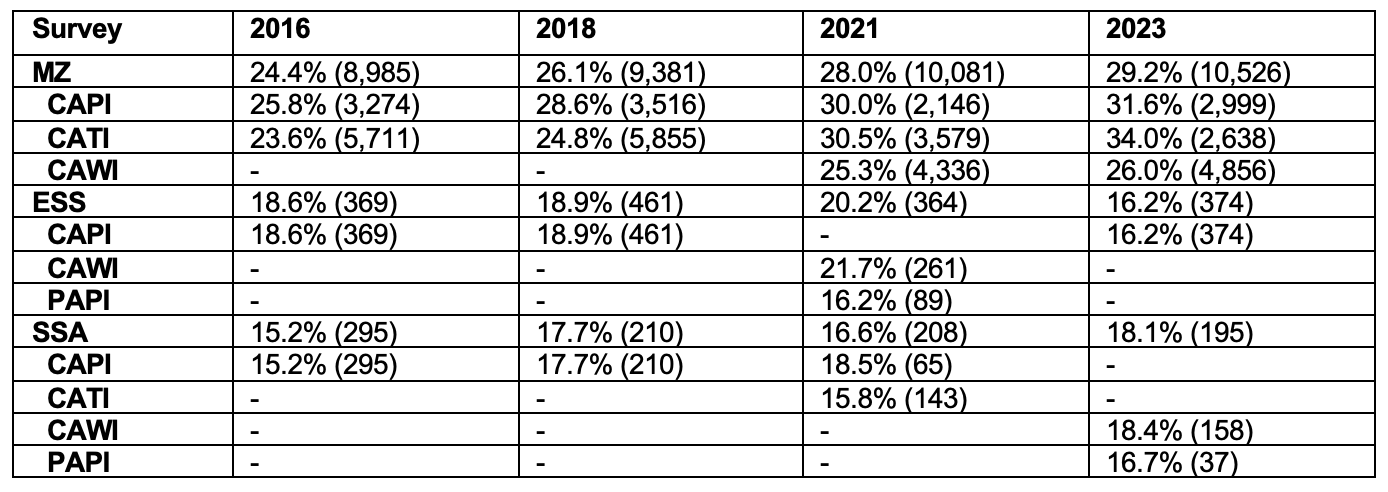
Data source: Bacher et al. (2019), ESS ERIC (2023a, 2023b, 2023c, 2024a), Hadler et al. (2019, 2022, 2024), and Statistics Austria (2020a, 2020b, 2021, 2023). Lines MZ, ESS and SSA may include cases with the mode unknown.
The percentage of microcensus respondents with a migration background increased from 24.4 in 2016 to 29.2 by 2023. Neither social survey does reflect this development, as proportions remain relatively stable and the difference to the MZ increases over time (see Table 3). Overall, no clear mode effects can be observed.
Table 4: Share of respondents with a bachelor’s degree or higher (ISCED≥6), rounded and with the respective number of observations in parentheses
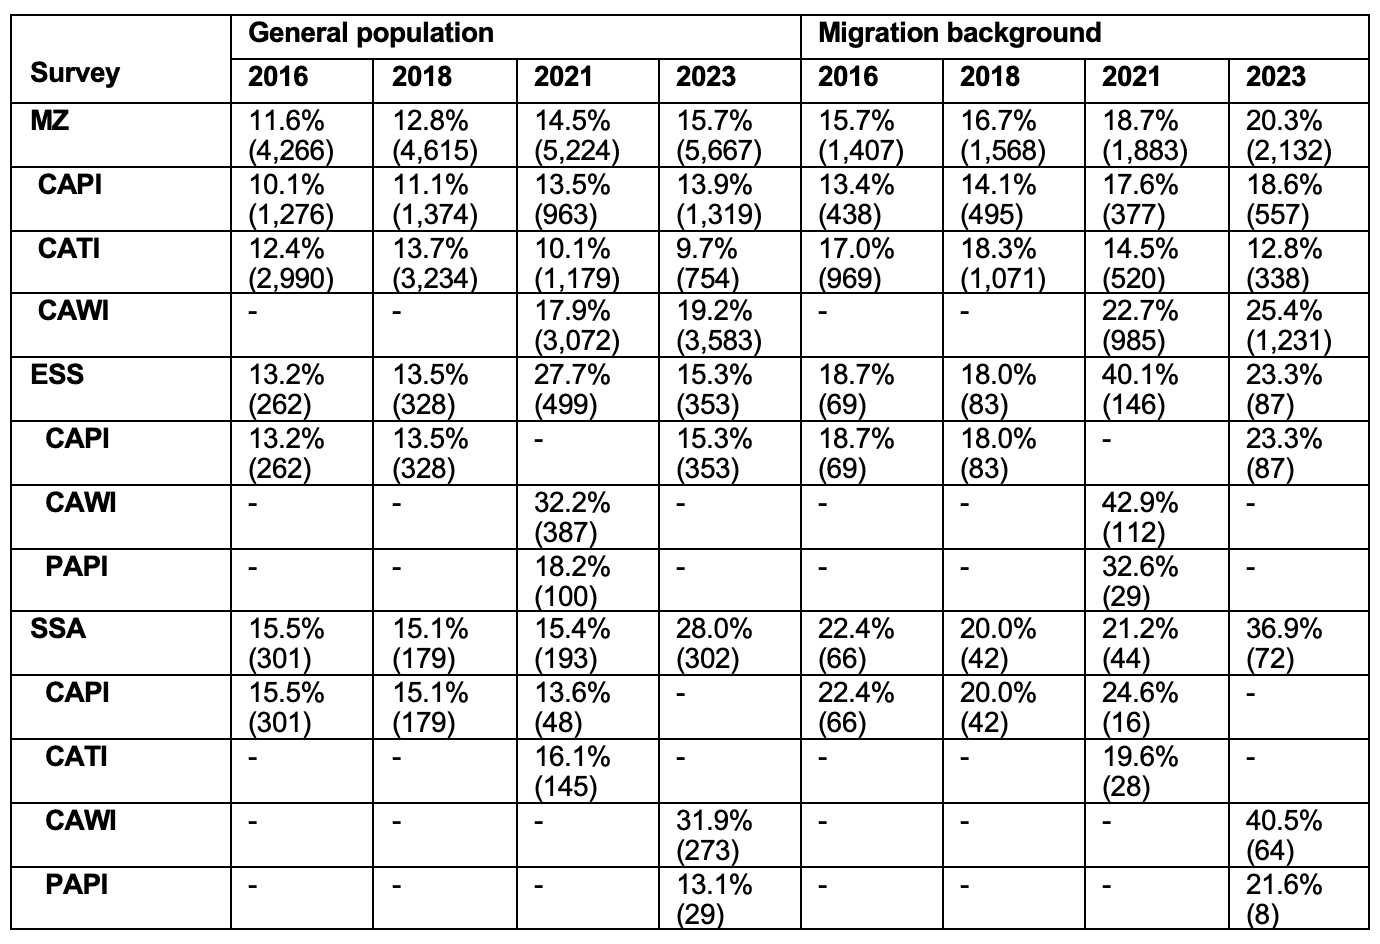
Data source: Bacher et al. (2019), ESS ERIC (2023a, 2023b, 2023c, 2024a), Hadler et al. (2019, 2022, 2024), and Statistics Austria (2020a, 2020b, 2021, 2023). Lines MZ, ESS and SSA may include cases with the mode unknown.
The proportion of Austrian residents with a tertiary degree is increasing, with migrants more often being highly educated. As Table 4 shows, both social surveys consistently show a higher proportion of highly educated people than the MZ. However, the discrepancy becomes more obvious when web-based modes are introduced, even though CAWI respondents are more likely to have a tertiary degree than respondents to other modes in all surveys. This is even more evident in the migrant sample, as for instance in 2021, just under half of all respondents to the ESS web questionnaire (CAWI) (42.9%) and every third respondent to the ESS paper questionnaire (PAPI) (32.6%) had a tertiary degree.
Table 5: Average age of respondents, rounded and with the number of observations in parentheses
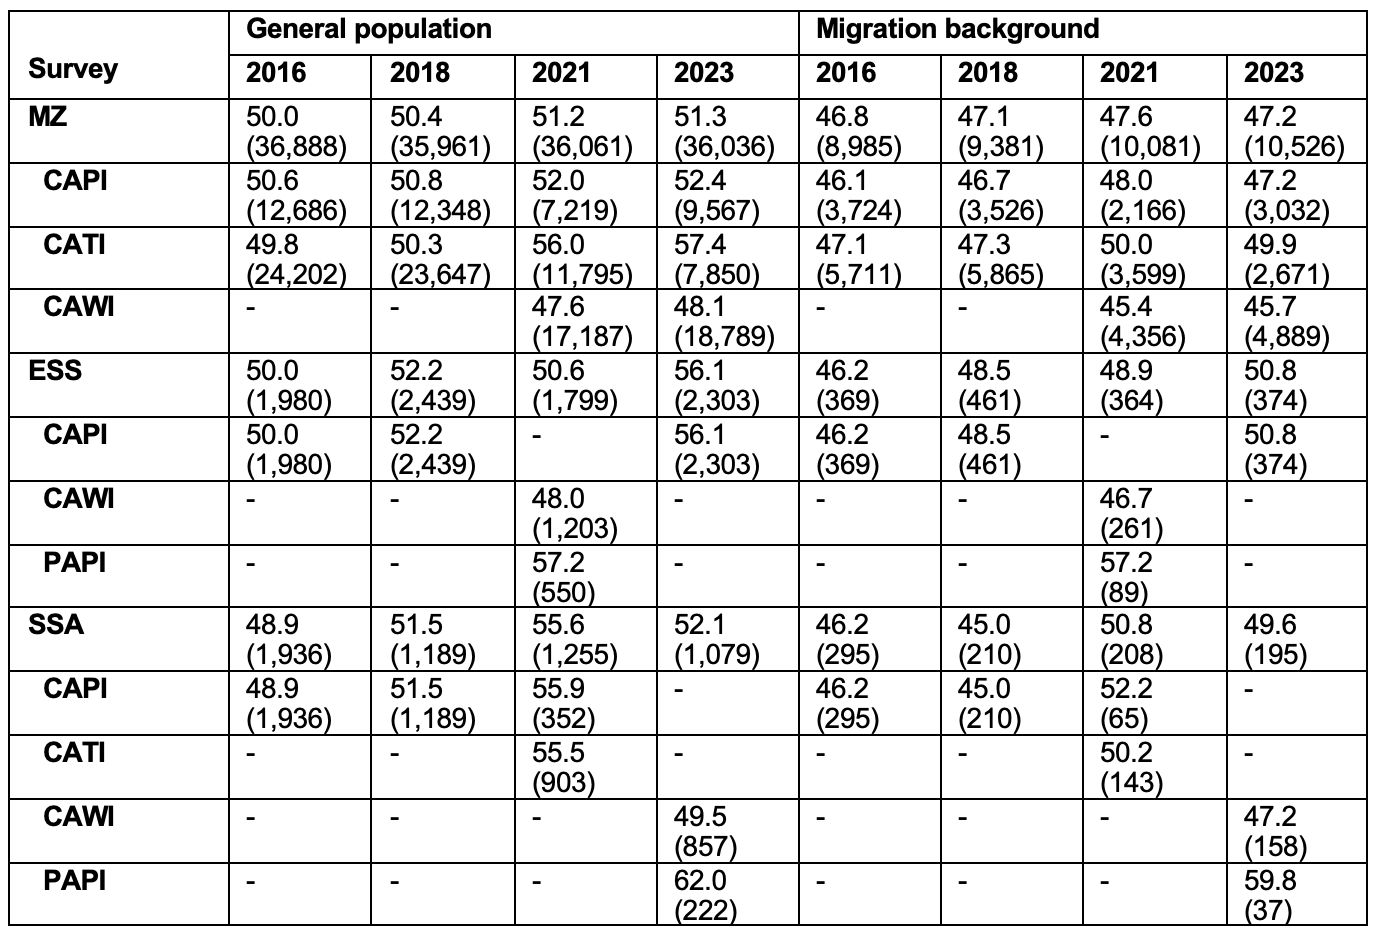
Data source: Bacher et al. (2019), ESS ERIC (2023a, 2023b, 2023c, 2024a), Hadler et al. (2019, 2022, 2024), and Statistics Austria (2020a, 2020b, 2021, 2023). Lines MZ, ESS and SSA may include cases with the mode unknown.
The average age of MZ respondents has increased from 50.0 years in 2016 to 51.3 years by 2023 (see Table 5). Respondents with a migration background are about 3½ years younger on average (46.8 years in 2016 to 47.2 years by 2023) and do age at a slower rate. Both social surveys come quite close to the MZ in 2016 and 2018. More surprisingly, the later use of web-first mixed-mode designs achieves the same result, despite the fact that respondents to web questionnaires (CAWI) are, on average, about ten years younger than those who respond to paper questionnaires (PAPI). Instead, it is CAPI and CATI that seem to overestimate the average age in the SSA in 2021 and the ESS in 2023.
Table 6: Share of male respondents, rounded and with the respective number of observations in parentheses
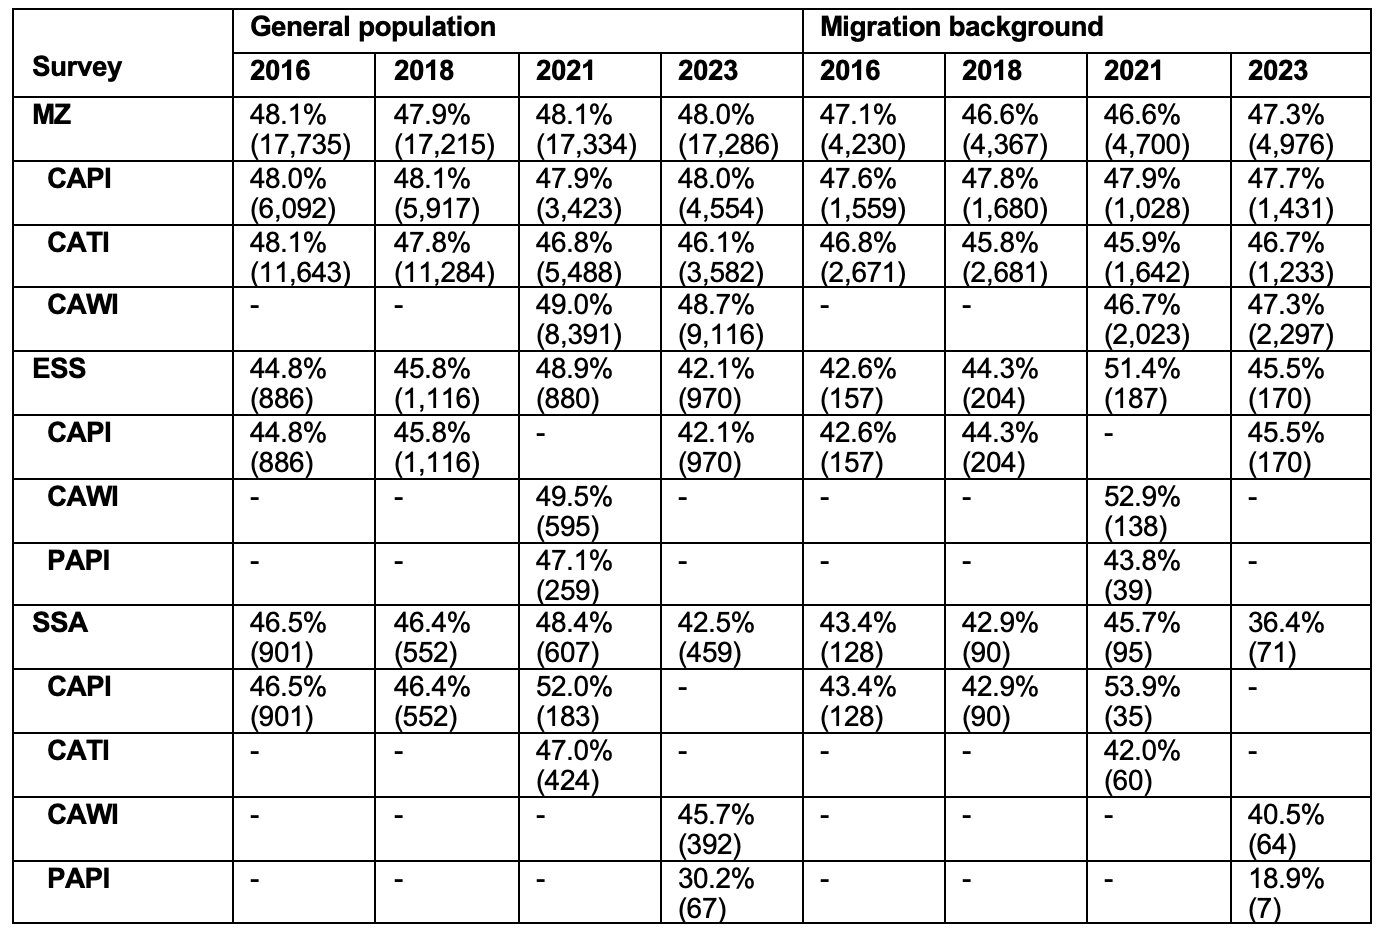
Data source: Bacher et al. (2019), ESS ERIC (2023a, 2023b, 2023c, 2024a), Hadler et al. (2019, 2022, 2024), and Statistics Austria (2020a, 2020b, 2021, 2023). Lines MZ, ESS and SSA may include cases with the mode unknown.
In case of sex, it is the post-pandemic data that deviate as both social surveys recruited fewer male respondents (approx. 42%) than the MZ (48.0%) (see Table 6). This is particularly evident among respondents with a migration background as only one-fifth of all respondents to the SSA paper questionnaire (PAPI) were male (18.9%).
6. Identifying Explanatory Factors for Differences in Sample Composition
Although descriptive statistics offer initial insights, regression models are required to determine whether differences in sample composition can be attributed to specific survey modes. Logistic regression models are used to estimate the effects for migration background, male sex and higher education. OLS regression models are used for the estimation of average age. As all models are built identically, the time of data collection, the survey and the data collection mode are used as independent variables. The year 2016, the MZ, and CAPI are set as the respective reference categories. The output is given in Average Marginal Effects (AME) and unstandardised scale coefficients.
Table 7: Potential explanatory factors for sociodemographic changes in sample composition
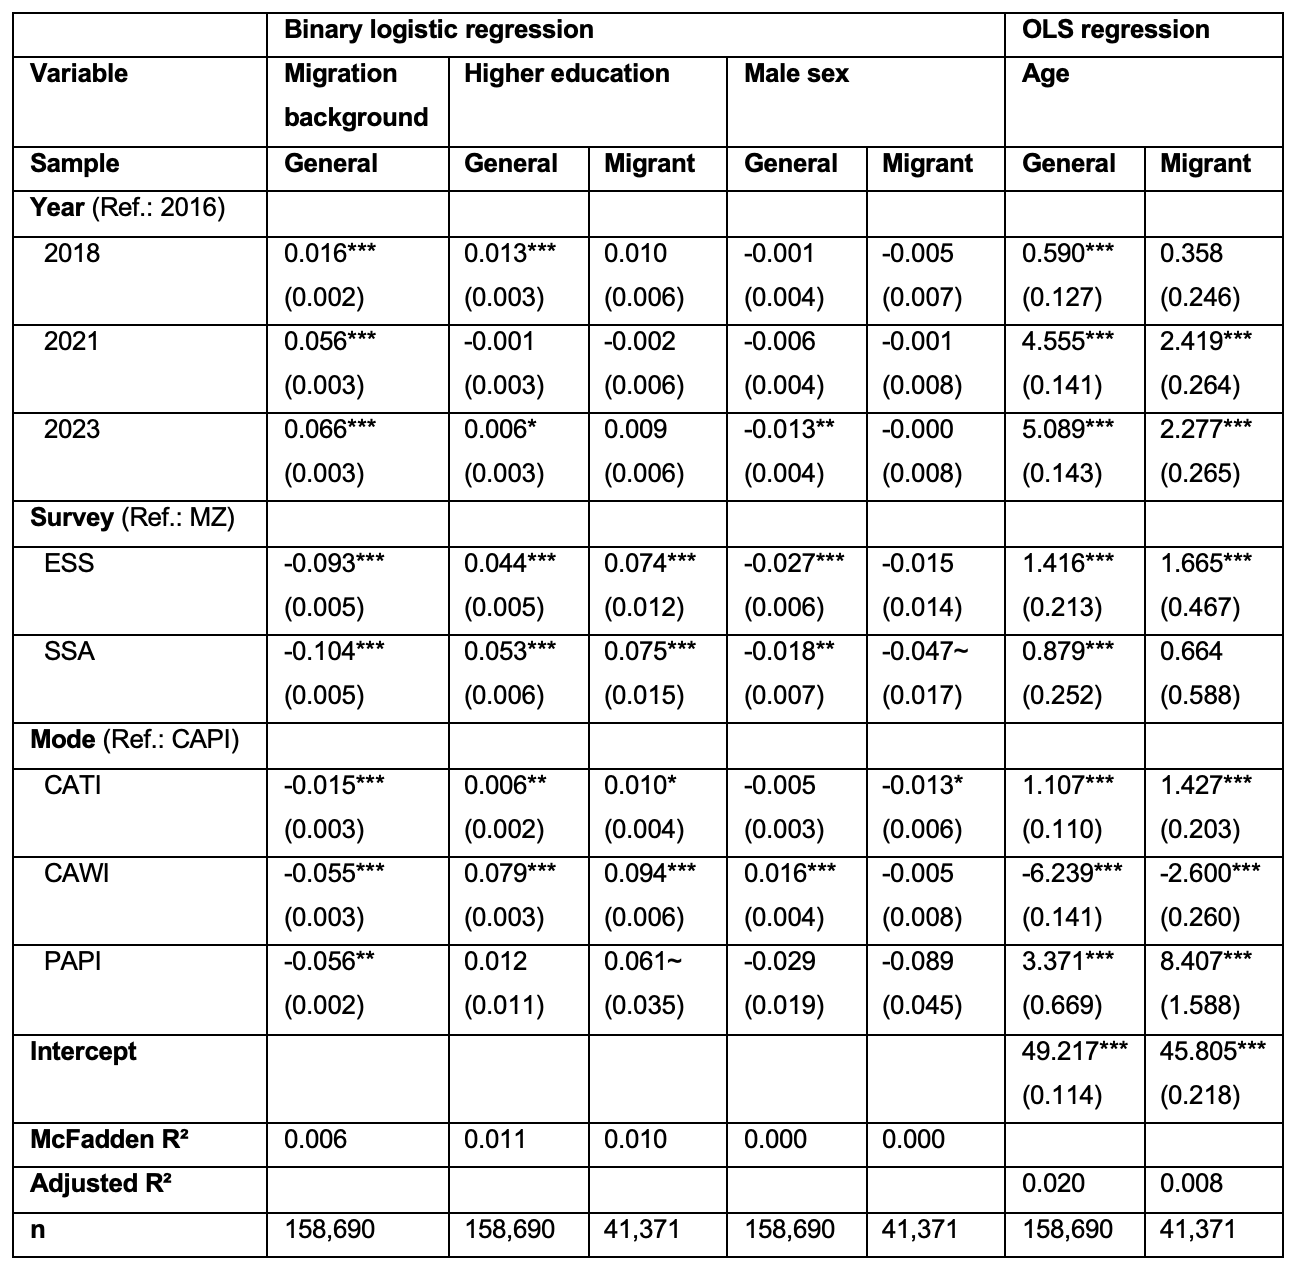
Data source: Bacher et al. (2019), ESS ERIC (2023a, 2023b, 2023c, 2024a), Hadler et al. (2019, 2022, 2024), and Statistics Austria (2020a, 2020b, 2021, 2023). Multivariate binary logistic and OLS regression models. Coefficients for migration background, higher education and male sex is given in Average Marginal Effects (AME). Output for age is given in unstandardised scale points. Standard error is given in parentheses. *** p<0.001, ** p<0.01, * p<0.05, ~ p<0.1.
The probability for a respondent to have a migration background increases significantly by up to seven percentage points between 2016 and 2023 (see Table 7). In turn, this probability is reduced significantly by around ten percentage points if it is a social survey rather than the microcensus. In addition, the probability for a migration background is up to six percentage points lower in case of web (CAWI) and paper questionnaires (PAPI) when compared to face-to-face (CAPI).
By contrast, respondents are significantly more likely to have a higher education in both social surveys than in the MZ. These effects are particularly strong for migrant respondents as the probability increases by about seven percentage points when compared to the MZ. An additional ten percentage points can be added if the data collection is web-based rather than in-person.
The effects on sex are mostly ambiguous and overall, less substantial. In trend, ESS and SSA respondents are (to a small degree) less likely to be male than microcensus respondents. Similarly, respondents to the paper questionnaire are less likely to be male than face-to-face respondents. In case of age, we see that respondents with a migration background are younger on average than the general population (as seen in Table 5). The average age of migrant respondents is also rising more slowly than in the general population. Aside from time, age can also be associated with the survey and its respective modes. Respondents to both social surveys are older on average when compared to the MZ. Whereas CAWI respondents are significantly younger than CAPI interviewees, CATI and PAPI respondents are significantly older. Only the latter differences are more pronounced for migrants.
The explanation power of all these models is low, however. The last section will discuss these findings.
7. Discussion
As the COVID-19 pandemic forced a range of social survey programmes to seek alternatives to face-to-face interviews, the Austrian segment of the ESS and the SSA found different solutions despite matching study designs down to the sampling frame. The ESS opted for a push-to-web scheme and now this approach represents the future, as face-to-face interviews will be phased out by 2027 (ESS, 2022). The SSA switched to telephone interviews until face-to-face interviews were possible again (IFES, 2021), only to switch to push-to-web after the pandemic (IFES, 2023). As there is only a limited number of quantitative studies on migrants in Austria – a diverse group that is often underrepresented (Prandner and Weichbold, 2019; Rinken and Pötzschke, 2022) – these shifts may affect the quality of data and the validity of research findings. Thus, the effects of the survey mode shift on the sample composition were of particular interest.
We examined differences in sample composition in relation to migration background (defined as having at least one parent born abroad), higher education (defined as ISCED≥6), as well as age and sex, by comparing the ESS and SSA to the official microcensus (MZ). Using descriptive analysis and regression models we found substantial deviations between the two social surveys and the official data. Even before the pandemic, those who responded to one of the two social surveys were less likely to have a migration background. While web-based mixed-mode approaches provided no remedy and the share of migrant respondents remains relatively low (supporting H1), the overall coverage did also not get worse. In contrast, H1a does not hold up, as the share of individuals with a migration background is lower both with CAWI and PAPI compared to CAPI. At the same time, respondents to the ESS and the SSA were consistently more likely to be highly educated. This is all the more the case with the introduction of push-to-web (which supports H2). These tendencies were once more not fully compensated for by offering paper questionnaire alternatives, as the proportion of highly educated individuals (ISCED≥6) differs significantly between CAPI and CAWI but not between CAPI and PAPI. This finding is inconsistent with H2a. However, there is some evidence to support H2b, as web questionnaires in particular showed a higher share of migrant respondents who had reported higher education degrees.
We also find that both social surveys remain close to official data and seem to be unaffected by the shift to push-to-web in relation to age. This is despite the fact that the respondents to the web questionnaire were, on average, about ten years younger than respondents to the paper questionnaire, in both the general and migrant samples. While this technically speaks for H3, the mixed-mode approach has provided a clear remedy here. This does in effect contradict the presumptions our research questions are based upon. In case of sex the results were more ambiguous and less open to interpretation. Thus, we cannot find support for H4.
In summary, the shift from face-to-face to push-to-web does have a certain impact on the sample composition of the Austrian migrant subpopulation (as well as the overall population). As noted by Kappelhof (2015) and Lindholm et al. (2024), some differences associated with web questionnaires can at least be partially set off by offering paper questionnaires as an alternative using mixed-mode designs. However, the overrepresentation of respondents with a formal higher education (that has increased with the use of web surveys) and the underrepresentation of respondents with a migration background (irrespective of data collection mode) persists. We can draw parallels to Lipps et al. (2013) and Wolf et al. (2021) here.
Although face-to-face interviews have long been considered the ‘gold standard’, the higher non-response rate among hard-to-reach population groups, such as migrants, makes the accurate representation in general population surveys challenging. Against this background, the shift to alternative modes of data collection further emphasises the need to rethink recruitment strategies and questionnaire designs, particularly with regard to identifying respondents who belong to hard-to-reach groups. For now, potential biases should be taken into account when findings are based upon time-series that include data collected with web and paper questionnaires. The results presented here provide preliminary indications that observed mode effects may be relatively consistent across survey waves. However, these findings must be interpreted with caution. With the current setup, it was not possible to formally test the differences observed between migrants and the general sample.
Further monitoring is required, as the article is based on a specific case study of a singular country and three very specific general population survey projects. The extent to which the observed mode effects persist over time remains unclear.
References
- Aksoy, C. G., and Poutvaara, P. (2021). Refugees’ and irregular migrants’ self-selection into Europe. Journal of Development Economics, 152, 102681. https://doi.org/10.1016/j.jdeveco.2021.102681
- Aschauer, W., Beham-Rabanser, M., Bodi-Fernandez, O., Haller, M., and Muckenhuber, J. (Eds.). (2019). Die Lebenssituation von Migrantinnen und Migranten in Österreich: Ergebnisse einer Umfrage unter Zugewanderten. Wiesbaden: Springer Fachmedien Wiesbaden. https://doi.org/10.1007/978-3-658-25592-3
- Bacher, J., Beham-Rabanser, M., Grausgruber, A., Haller, M., Höllinger, F., Muckenhuber, J., Prandner, D., and Verwiebe, R. (2019). Social Survey Austria 2016 (SUF edition) [Dataset]. AUSSDA Dataverse. https://doi.org/10.11587/IGXRAO
- Bethlehem, J. (2010). Selection Bias in Web Surveys. International Statistical Review, 78(2), 161–188. https://doi.org/10.1111/j.1751-5823.2010.00112.x
- Blom, A. G., Gathmann, C., & Krieger, U. (2015). Setting up an online panel representative of the general population: The German Internet Panel. Field Methods, 27(4), 391-408. https://doi.org/10.1177/1525822X15574494
- Brücker, H., Ette, A., Grabka, M. M., Kosyakova, Y., Niehues, W., Rother, N., Spieß, C. K., Zinn, S., Bujard, M., Cardozo, A., Décieux, J. P., Maddox, A., Milewski, N., Naderi, R., Sauer, L., Schmitz, S., Schwanhäuser, S., Siegert, M., Tanis, K., and Steinhauer, H. W. (2023). Geflüchtete aus der Ukraine in Deutschland: Ergebnisse der ersten Welle der IAB-BiB/FReDA-BAMF-SOEP Befragung. (IAB-Forschungsbericht 02/2023). Nürnberg: Institut für Arbeitsmarkt und Berufsforschung. https://doi.org/10.48720/IAB.FB.2302
- Cornesse, C., and Blom, A. G. (2023). Response quality in nonprobability and probability-based online panels. Sociological Methods & Research, 52(2), 879–908. https://doi.org/10.1177/0049124120914940
- Cornesse, C., Blom, A. G., Dutwin, D., Krosnick, J. A., De Leeuw, E. D., Legleye, S., … & Wenz, A. (2020). A review of conceptual approaches and empirical evidence on probability and nonprobability sample survey research. Journal of Survey Statistics and Methodology, 8(1), 4-36. https://doi.org/10.1093/jssam/smz041
- Couper, M. P. (2017). New developments in survey data collection. Annual review of sociology, 43(1), 121-145. https://doi.org/10.1146/annurev-soc-060116-053613
- Daikeler, J., Bošnjak, M., and Lozar Manfreda, K. (2020). Web versus other survey modes: an updated and extended meta-analysis comparing response rates. Journal of Survey Statistics and Methodology, 8(3), 513–539. https://doi.org/10.1093/jssam/smz008
- De Leeuw, E. D. (2005). To mix or not to mix data collection modes in surveys. Journal of official statistics, 21(5), 233-255.
- de Leeuw, E., Hox, J., and Luiten, A. (2018). International nonresponse trends across countries and years: An analysis of 36 years of Labour Force Survey data. Survey Methods: Insights from the Field. https://doi.org/10.13094/SMIF-2018-00008
- Deding, M., Fridberg, T., and Jakobsen, V. (2013). Non-response among immigrants in Denmark. In M. Méndez and J. Font (Eds.), Surveying Ethnic Minorities and Immigrant Populations: Methodological Challenges and Research Strategies (pp. 173–194). Amsterdam: Amsterdam University Press. https://doi.org/10.26530/OAPEN_450851
- Dillman, D. A. (1978). Mail and telephone surveys: The total design method. New York: Wiley-Interscience.
- Dillman, D. A. (2011). Mail and internet surveys: The tailored design method. (2nd ed.) Hoboken, New Jersey: John Wiley & Sons.
- Dillman, D. A. (2017). The promise and challenge of pushing respondents to the Web in mixed-mode surveys. Survey Methodology, 43(1), 3–30.
- Dillman, D. A. (2022). Fifty years of survey innovation. Bulletin of Sociological Methodology/Bulletin de Méthodologie Sociologique, 154(1), 9-38. https://doi.org/10.1177/07591063221088317
- European Social Survey (ESS). (2022, May 31). ESS announces change to data collection methodology. European Social Survey. https://www.europeansocialsurvey.org/news/article/ess-announces-change-data-collection-methodology
- European Social Survey European Research Infrastructure (ESS ERIC). (2023a). ESS round 8—2016. Welfare attitudes, attitudes to climate change. Sikt – Norwegian Agency for Shared Services in Education and Research. https://doi.org/10.21338/NSD-ESS8-2016
- European Social Survey European Research Infrastructure (ESS ERIC). (2023b). ESS round 9—2018. Timing of life, justice and fairness. Sikt – Norwegian Agency for Shared Services in Education and Research. https://doi.org/10.21338/NSD-ESS9-2018
- European Social Survey European Research Infrastructure (ESS ERIC). (2023c). ESS round 10—2020. Democracy, digital social contacts. Sikt – Norwegian Agency for Shared Services in Education and Research. https://doi.org/10.21338/NSD-ESS10-2020
- European Social Survey European Research Infrastructure (ESS ERIC). (2023d). ESS8—Integrated file, edition 2.3 [Dataset]. Sikt – Norwegian Agency for Shared Services in Education and Research. https://doi.org/10.21338/ESS8E02_3
- European Social Survey European Research Infrastructure (ESS ERIC). (2023e). ESS9—Integrated file, edition 3.2 [Dataset]. Sikt – Norwegian Agency for Shared Services in Education and Research. https://doi.org/10.21338/ESS9E03_2
- European Social Survey European Research Infrastructure (ESS ERIC). (2023f). ESS10 Self-completion—integrated file, edition 3.1 [Dataset]. Sikt – Norwegian Agency for Shared Services in Education and Research. https://doi.org/10.21338/ESS10SCE03_1
- European Social Survey European Research Infrastructure (ESS ERIC). (2024a). ESS round 11—2023. Social inequalities in health, gender in contemporary Europe. Sikt – Norwegian Agency for Shared Services in Education and Research.
- European Social Survey European Research Infrastructure (ESS ERIC). (2024b). ESS11—Integrated file, edition 2.0 [Dataset]. Sikt – Norwegian Agency for Shared Services in Education and Research. https://doi.org/10.21338/ESS11E02_0
- Fricker, S., M. Galesic, R. Tourangeau, & T. Yan. (2005). An experimental comparison of web and telephone surveys. Public Opinion Quarterly, 69(3), 370-392. https://doi.org/10.1093/poq/nfi027
- Hadler, M., Eder, A., Aschauer, W., Bacher, J., Prandner, D., and Berghammer, C. (2024). Social Survey Austria 2023 (SUF edition) [Dataset]. AUSSDA. https://doi.org/10.11587/RJU0KE
- Hadler, M., Höllinger, F., Eder, A., Aschauer, W., Bacher, J., and Prandner, D. (2022). Social Survey Austria 2021 (SUF edition) [Dataset]. AUSSDA. https://doi.org/10.11587/S9D7HG
- Hadler, M., Höllinger, F., and Muckenhuber, J. (2019). Social Survey Austria 2018 (SUF edition) [Dataset]. AUSSDA. https://doi.org/10.11587/ERDG3O
- Institut für empirische Sozialforschung (IFES). (2018). Sozialer Survey Österreich 2018. Methodenbericht. Wien: Institut für empirische Sozialforschung.
- Institut für empirische Sozialforschung (IFES). (2021). ISSP Survey 2020 (2021). ISSP-Module: Soziale Ungleichheit, Umwelt und SSÖ-Modul. Feldbericht. Wien: Institut für empirische Sozialforschung.
- Institut für empirische Sozialforschung (IFES). (2023). Sozialer Survey Österreich (SSÖ) 2023 und International Social Survey Programme (ISSP) ‚Familie und Geschlechterrollen‘ sowie ‚Nationale Identität‘. Feldbericht. Wien: Institut für empirische Sozialforschung.
- Kappelhof, J. W. S. (2015). Face-to-face or sequential mixed-mode surveys among non-western minorities in the Netherlands: the effect of different survey designs on the possibility of nonresponse bias. Journal of Official Statistics, 31(1), 1–30. https://doi.org/10.1515/jos-2015-0001
- Lindholm, A., Steinmetz, S., and Sapin, M. (2024). Environmental attitudes, concerns, and behaviors across survey modes. Assessing selection and measurement biases in ISSP 2020 ‘push-to-web’ surveys. International Journal of Sociology, 54(5–6), 334–354. https://doi.org/10.1080/00207659.2024.2420295
- Lipps, O., Laganà, F., Pollien, A., and Gianettoni, L. (2013). Under-representation of foreign minorities in cross-sectional and longitudinal surveys in Switzerland. In M. Méndez and J. Font (Eds.), Surveying Ethnic Minorities and Immigrant Populations: Methodological Challenges and Research Strategies (pp. 241–267). Amsterdam: Amsterdam University Press. https://doi.org/10.26530/OAPEN_450851
- Lynn, P. (2020). Evaluating push-to-web methodology for mixed-mode surveys using address-based samples. Survey Research Methods, 19-30 Pages. https://doi.org/10.18148/SRM/2020.V14I1.7591
- Lynn, P., Nandi, A., Parutis, V., and Platt, L. (2018). Design and implementation of a high-quality probability sample of immigrants and ethnic minorities: Lessons learnt. Demographic Research, 38, 513–548. https://doi.org/10.4054/DemRes.2018.38.21
- Maehler, D. B., Martin, S., and Rammstedt, B. (2017). Coverage of the migrant population in large-scale assessment surveys. Experiences from PIAAC in Germany. Large-Scale Assessments in Education, 5(1), 9. https://doi.org/10.1186/s40536-017-0044-8
- Morales, L., and Ros, V. (2013). Comparing the response rates of autochthonous and migrant populations in nominal sampling surveys: The LOCALMULTIDEM study in Madrid. In M. Méndez and J. Font (Eds.), Surveying Ethnic Minorities and Immigrant Populations: Methodological Challenges and Research Strategies (pp. 147–172). Amsterdam: Amsterdam University Press. https://doi.org/10.26530/OAPEN_450851
- Morales, L., Saji, A., Tservenis, D. R., Winn, M., Bergh, J., Bernát, A., Méndez, M., and et al. (2024). Ethnic and Migrant Minorities (EMM) Survey Registry [Dataset]. Zenodo. https://zenodo.org/records/13934872
- Penker, M., and Eder, A. (2024). Analysing mixed-mode effects of computer assisted telephone and personal interviews: A case study based on survey data from the international social survey programme module on environment. Bulletin of Sociological Methodology/Bulletin de Méthodologie Sociologique, 162(1), 108–128. https://doi.org/10.1177/07591063241236066
- Pfündel, K., Stichs, A., and Tanis, K. (2021). Muslimisches Leben in Deutschland 2020. Studie im Auftrag der Deutschen Islam Konferenz. Nürnberg: Bundesamt für Migration und Flüchtlinge.
- Pötzschke, S. (2024). Surveys in migration research. In R. Zapata-Barrero and D. Vintila (Eds.), How to Do Migration Research (pp. 99–107). Edward Elgar Publishing. https://doi.org/10.4337/9781035306855.00021
- Prandner, D. (2019). Sozialer Survey Österreich – Methodik des Sozialen Survey Österreich 2016. In J. Bacher, A. Grausgruber, M. Haller, F. Höllinger, D. Prandner, and R. Verwiebe (Eds.), Sozialstruktur und Wertewandel in Österreich (pp. 515-531). Springer VS: Wiesbaden. https://doi.org/10.1007/978-3-658-21081-6_21
- Prandner, D., Seymer, A., and Weichbold, M. (2023). The new normal of online survey research. In R. Sooryamoorthy and V. Ojong (Eds.), Researching the ‘New Normal’ Social World: Methodological Adaptations and Innovations Post-Pandemic (1st ed., pp. 29–49). London: Routledge. https://doi.org/10.4324/9781003386087
- Prandner, D., and Weichbold, M. (2019). Building a sampling frame for migrant populations via an onomastic approach – Lesson learned from the Austrian Immigrant Survey 2016. Survey Methods: Insights from the Field. https://doi.org/10.13094/SMIF-2019-00006
- Rinken, S., and Pötzschke, S. (2022). Conclusion: migration research in times of ubiquitous digitization. In S. Pötzschke and S. Rinken (Eds.), Migration Research in a Digitized World (pp. 207–220). Springer International Publishing. https://doi.org/10.1007/978-3-031-01319-5_11
- Sievers, W., Bauböck, R., Josipovic, I., Karabegović, D., and Shinozaki, K. (Eds.). (2022). Jenseits der Migrantologie: Aktuelle Herausforderungen und neue Perspektiven der Migrationsforschung. Verlag der Österreichischen Akademie der Wissenschaften. https://doi.org/10.1553/978OEAW90493
- Statistics Austria. (2020a). Microcensus Labour Force Survey / Housing Survey 2016 (SUF edition) [Dataset]. AUSSDA. https://doi.org/10.11587/ROYRWO
- Statistics Austria. (2020b). Microcensus Labour Force Survey / Housing Survey 2018 (SUF edition) [Dataset]. AUSSDA. https://doi.org/10.11587/L33O5L
- Statistics Austria. (2021). Microcensus Labour Force Survey / Housing Survey 2021 (SUF edition) [Dataset]. AUSSDA. https://doi.org/10.11587/AROIHY
- Statistics Austria. (2023). Microcensus Labour Force Survey / Housing Survey 2023 (SUF edition) [Dataset]. AUSSDA. https://doi.org/10.11587/JRZMQK
- Statistik Austria. (2022). Arbeitsmarktstatistik. 4. Quartal 2021. Mikrozensus-Arbeitskräfteerhebung. Wien: Statistik Austria.
- Statistik Austria. (2024a). Arbeitsmarktstatistik. 4. Quartal 2023. Mikrozensus-Arbeitskräfteerhebung. Wien: Statistik Austria.
- Statistik Austria. (2024b). Statistisches Jahrbuch. Migration & Integration. Zahlen. Daten. Indikatoren. 2024. Wien: Statistik Austria.
- Steiner, I., and Landös, A. (2019). Surveying migrants in Europe. Experiences of the Swiss Migration-Mobility Survey. In I. Steiner and P. Wanner (Eds.), Migrants and Expats: The Swiss Migration and Mobility Nexus (pp. 21–54). Springer International Publishing. https://doi.org/10.1007/978-3-030-05671-1_2
- Tourangeau, R., Edwards, B., Johnson, T. P., Wolter, K. M., and Bates, N. (Eds.). (2014). Hard-to-Survey Populations (1st ed.). Cambridge University Press. https://doi.org/10.1017/CBO9781139381635
- Wolf, C., Christmann, P., Gummer, T., Schnaudt, C., and Verhoeven, S. (2021). Conducting general social surveys as self-administered mixed-mode surveys. Public Opinion Quarterly, 85(2), 623–648. https://doi.org/10.1093/poq/nfab039
- World Health Organization. (2020). ApartTogether survey. Preliminary overview of refugees and migrants self-reported impact of COVID-19. Geneva: World Health Organization.
- Wu, M.-J., Zhao, K., & Fils-Aime, F. (2022). Response rates of online surveys in published research: A meta-analysis. Computers in Human Behavior Reports, 7, 100206. https://doi.org/10.1016/j.chbr.2022.100206
-
Keywords
calibration CATI coverage coverage bias cross-national surveys data linkage data quality European Social Survey experiment face-to-face face-to-face survey Facebook hard to reach populations incentives item nonresponse measurement measurement error mixed-mode surveys multitasking non-probability samples Nonresponse nonresponse bias nonresponse rates paradata PIAAC Probability sample probability samples QR codes rare populations response rate Satisficing social desirability Social media survey survey-taking climate survey data survey management survey methods Telephone survey telephone surveys total survey error unit nonresponse validity web survey Web surveys weighting
