

Should We Worry About Problematic Response Behaviour in Social Media Surveys? Understanding the Impact of Social Group Cues in Recruitment

Zindel Z. (2026). Should We Worry About Problematic Response Behaviour in Social Media Surveys? Understanding the Impact of Social Group Cues in Recruitment. Survey Methods: Insights from the Field. Retrieved from https://surveyinsights.org/?p=21395.
© the authors 2026. This work is licensed under a Creative Commons Attribution 4.0 International License (CC BY 4.0) 
Abstract
Social media advertising has become a common tool for participant recruitment, especially when targeting hard-to-reach or underrepresented populations. A common strategy to boost engagement is the use of social group cues – textual or visual references to religion, gender identity, or ethnicity. While these cues can enhance recruitment efficiency, their impact on response data quality remains poorly understood. This study investigates how social group cues affect problematic response behaviour in a Facebook-recruited survey on labour market experiences in Germany. Respondents were recruited via four distinct ad conditions: two referencing Muslim identity, and two with neutral framing. Seven indicators were used to assess response quality, capturing satisficing (e.g., speeding, non-differentiation) and potential misrepresentation (e.g., implausible entries, inconsistent metadata). Results show that social group cues, particularly when targeting Muslim men, are associated with elevated rates of problematic response behaviour. Latent class analysis reveals three behavioural profiles: attentive respondents, likely misrepresentation, and likely satisficing. These groups differ in both sociodemographic patterns and attitudinal responses. Although problematic cases distort sample composition, sensitivity analyses confirm that core associations remain robust. The findings contribute to ongoing methodological debates on risks and opportunities of social media recruitment and offer practical insights for quality-conscious recruitment strategies.
Keywords
Facebook, non-probability samples, response quality, Satisficing, social media recruitment, Social media survey
Copyright
© the authors 2026. This work is licensed under a Creative Commons Attribution 4.0 International License (CC BY 4.0)
1 Introduction
In recent years, social media advertising has become an increasingly popular tool for recruiting participants in survey research. Platforms such as Facebook and Instagram offer researchers access to large and diverse user bases, along with technical tools for targeted outreach (Zindel, 2023). These platforms are particularly valuable when studying populations that are rare and typically hard-to-reach through conventional sampling frames, such as migrants (Pötzschke & Braun, 2017; Soehl et al., 2024), ethnic minorities (González & Grov, 2022; Pechmann et al., 2020; Tsai et al., 2019), or gender-diverse individuals (Kühne & Zindel, 2020; Stern et al., 2022; Waling et al., 2022). By tailoring advertising content to specific identities or social group affiliations, such campaigns aim to increase visibility, relevance and engagement among those for whom a topic is personally salient (Higgins et al., 2018; Mundel & Yang, 2022).
A common strategy in this context is the use of social group cues, that is, visual or textual references to social group identity-related characteristics such as religion, ethnicity, or gender (Fan et al., 2023; González & Grov, 2022; Kühne & Zindel, 2020). These cues aim to enhance perceived relevance and encourage participation by signalling that a survey is intended for people like “you”. However, they may also attract individuals outside the intended group. When recruitment occurs via publicly visible social media platforms, control over who sees an ad and what motivates engagement is inherently limited (Donzowa et al., 2025; Zindel et al., 2025). In algorithmically driven, publicly accessible, and politically charged digital environments, where partisan debates and conflicts are common, ads may also serve as ideological signals. What is meant to foster inclusion can be perceived by others as a political statement – potentially prompting curiosity, confrontation, or even intentional disruption (cf. Ribeiro et al., 2019; Vargo & Hopp, 2020). In these cases, data quality may be compromised by problematic response behaviour. To date, no empirical study has systematically investigated problematic response behaviour in the context of identity-targeted recruitment via social media.
This paper examines the impact of social group cues on response quality in a Facebook-recruited survey on labour market experiences in Germany. To assess whether such cues influence the prevalence and nature of problematic response behaviour, four recruitment conditions were implemented: two featuring explicit references to Muslim identity in both wording and imagery, and two using neutral framing. Drawing on a combination of established response quality indicators, latent class modelling, and sensitivity analysis, the study investigates whether problematic response behaviour distorts sample composition and alters key substantive findings. Five research questions guide the empirical investigation:
RQ1: Do social group cues in social media ads increase the prevalence of problematic response behaviour?
RQ2: Are specific profiles of problematic response behaviour more prevalent when social media ads include social group cues?
RQ3: Do problematic respondents systematically differ in their reported sociodemographic characteristics from non-problematic respondents?
RQ4: Do problematic respondents systematically differ in their reported attitudinal measures from non-problematic respondents?
RQ5: Do problematic respondents affect the estimation of key multivariate relationships?
2 Background: social group cues, algorithmic reach, and risk to data quality
Social media platforms offer technical tools to target advertisements to their users based on location, gender, age, and language. However, demographic filters alone are often not sufficient to reach specific social identities. Categories such as ethnicity, religion, or migration background are typically not available for direct targeting due to privacy policies and platform regulations (e.g., Meta, 2021). To circumvent these limitations, researchers frequently rely on indirect proxies, such as interest-based targeting, language preferences, or geographic clustering, to approximate their target population (Sapiezynski et al., 2024). Yet, these methods face constraints: interest-based targeting has become increasingly restricted, and when available, such proxies often lack precision. For instance, individuals interacting with political or oppositional content may be incorrectly flagged as belonging to a target group. Similarly, language or location-based targeting may systematically exclude segments of the intended audience or introduce uncontrolled variation in ad exposure (cf. Cotter et al., 2021; Sabir et al., 2022).
To address the limitations of technical targeting parameters, researchers can embed social group cues directly within the content of the ads. These cues consist of textual or visual elements that reference shared group characteristics and are designed to signal inclusion and build trust. A Facebook ad might, for instance, explicitly address “Muslim women” or feature imagery associated with Islamic religious markers, such as a headscarf (see Figure 1). These cues function as invitations that speak directly to the group of interest, seeking to increase perceived legitimacy and personal resonance of survey requests.

Figure 1. Example of a Facebook advertisement using social group cues to target Muslim women.
Note: Original ad text (translated from German): “Are you a Muslim woman? Then take part in our survey on “Work and job search” now.”
From a theoretical standpoint, this strategy is grounded in the Tailored Design Method (Dillman et al., 2014), which emphasises the importance of using invitations that are personalised and resonate with the recipient’s identity or experiences. Applied to social media recruitment, this implies that including social group-relevant terminology or imagery may foster a sense of being personally addressed, thereby increasing motivation to participate. Relatedly, the Leverage-Saliency Theory of survey participation (Groves et al., 2000) posits that individuals are more likely to respond when specific elements of the invitation are both salient – that is, noticeable and attention-grabbing – and carry leverage, meaning they are personally meaningful or motivating for the individual. In this sense, social group cues act as leverage factors that reinforce the perceived importance of topics and signal to the respondent that the survey is inclusive of their social group. This resonance effect may be especially important when recruiting from populations that experience systemic marginalisation. For individuals who rarely see themselves reflected in institutional research, the presence of group-specific cues can signal that their perspectives are valued and their participation is sought after. Consequently, these cues may serve as a form of non-material incentive (cf., Dolinski et al., 2024).
However, recruitment via social media platforms is not only shaped by the content of ads but also by the algorithmic infrastructure that governs ad delivery. Social media platforms optimise the delivery of ads based on early engagement signals. During the initial phase of a campaign, the platform’s algorithms learn which types of users are most likely to click on or interact with the ad, and then adjust delivery patterns accordingly (e.g., Meta, n.d.). If early interactions come from individuals within the intended population, the algorithm may reinforce this trajectory. As a result, social group cues may help concentrate ad exposure on relevant populations, even in the absence of direct targeting options for ethnicity or religion. But if the ad also triggers interaction from individuals outside the target group – due to curiosity, hostility, or ideological disagreement – the ad may be shown to a broader and potentially unintended audience.
This mechanism makes social group cues a double-edged sword: while they may help increase relevance and reach for underrepresented populations, they also carry the risk of attracting individuals who are not part of the intended group and may engage with the study for reasons unrelated or even antagonistic to its purpose.
Participation in social media-based surveys is typically unsupervised, anonymous, and self-selected. Researchers have no direct control over who clicks on an ad or what motivates the users to participate. Under these conditions, the risk of problematic response behaviours increases. Some forms of problematic response behaviour may be due to low motivation and result from reducing cognitive load, that is, a well-documented and theorised problem in survey research (Krosnick, 1991; Tourangeau et al., 2012). Other forms of response behaviour may be more systematic. In politically polarised or ideologically contested environments, social group cues have the ability to trigger opposition or provocation. Individuals who disagree with the survey’s presumed purpose may engage in expressive responding or deliberately corrupt the data. This includes falsely claiming membership in a group, providing nonsensical answers, or attempting to distort the survey’s findings (Graham & Yair, 2025; Yair & Huber, 2021). Research in related fields has documented such forms of bad-faith participation, particularly in online panels and crowdsourced environments (Bell & Gift, 2023; Chandler & Paolacci, 2017). In these cases, problematic responding is not merely a function of inattention but reflects strategic and ideologically motivated behaviour aimed at manipulating research outputs.
Despite a growing body of literature on social media recruitment, the specific role of social group cues in shaping data quality remains underexplored. Previous studies have examined how incentives (Carpenter et al., 2023; Ichimiya et al., 2023), topic framing (Donzowa et al., 2025; Höhne et al., 2025; Zindel et al., 2025), or ad design (Donzowa et al., 2023; Hebel et al., 2025) affect recruitment effectiveness or sample composition. Some evidence suggests that explicit references to social group identity can improve survey completion among target populations (Kühne & Zindel, 2020), but few studies have systematically assessed whether – and how – such cues influence the nature of response behaviour itself. Even less is known about how such behaviours affect downstream analyses: for example, whether problematic cases distort demographic distributions, bias key attitudinal estimates, or compromise the robustness of multivariate models. If respondents who engage in problematic behaviour report systematically different characteristics or show different response patterns, this may introduce both noise and bias into survey findings. In particular, this manifests in studies that focus on sensitive or contested topics such as discrimination, religion, or migration.
3 Data and methods
Survey context and recruitment
The data used in this study stem from an online survey on labour market discrimination in Germany, conducted between January 15 and February 14, 2021 (Salikutluk et al., 2022).[1] Participants were recruited via paid ads on Facebook and Instagram, linking to an externally hosted survey platform. Due to technical issues, the Instagram campaign was discontinued at the outset of recruitment; accordingly, only participants recruited via Facebook are considered in this paper. Participation was voluntary, with no incentives offered, and all questions could be skipped. The survey primarily targeted Muslim individuals, while members of the general population were included as a comparison group. No eligibility screening was applied, as the target group also included the general population.
Recruitment was implemented through a single ad campaign consisting of six ad sets (see Appendix Tables A1 and A2). For analytical clarity, this analysis focuses on four ad sets that systematically varied in their use of social group cues. Each ad set used multiple ad images to enhance reach, reflect group diversity, and increase visual heterogeneity – particularly among Muslim participants (see Table 1). Visuals were selected and evaluated by the research project team, which included researchers with and without Islamic affiliation.
Table 1. Facebook ad set configuration
| # | Ad set | No. of ads | Targeting parameters | Ad text | Daily budget (€) | Social group cues |
| 1 | Muslim women | 15 | Germany, women, 18-65+ | Are you a female Muslim? Then take part in our survey on the topic of ‘Working life and job search’ now! | 220.0 | Yes |
| 2 | Muslim men | 10 | Germany, men, 18-65+ | Are you a male Muslim? Then take part in our survey on the topic of ‘Working life and job search’ now! | 90.0 | Yes |
| 3 | General population, women | 5 | Germany, women, 18-65+ | Click here to take part in a short survey on the topic of ‘Working life and job search’ and become part of a nationwide study. | 10.0 | No |
| 4 | General population, men | 5 | Germany, men, 18-65+ | Click here to take part in a short survey on the topic of ‘Working life and job search’ and become part of a nationwide study. | 10.0 | No |
| Total | 35 | – | 330.00 |
Note: All ad texts are translated into English for illustrative purposes; see Figure 2 for original configurations.
Two ad sets included explicit references to Muslim identity in both text and imagery, directly addressing Muslim women (ad set #1) and Muslim men (ad set #2)(see Figure 2). Visuals ranged from depictions with more salient ethno-religious markers – such as women wearing a headscarf or men in prayer – to more ambiguous portrayals of individuals in professional settings whose appearance could be interpreted as suggestive of a Muslim background. The aim was to ensure recognizability for the Muslim population while representing their internal group diversity.
In contrast, the other two ad sets (#3 and #4) employed neutral language, referring broadly to job search and working life, and were accompanied by generic visuals deliberately devoid of social group cues. This variation in framing allows for an empirical assessment of how different recruitment designs affect response behaviour and sample composition.
All ads were geo-targeted to users in Germany aged 18 to 65+ and optimised for “Traffic” objective, meaning that delivery was algorithmically optimised for a high number of link clicks. Daily budgets were distributed unevenly across ad sets to prioritise Muslim-targeted ads and account for higher expected recruitment costs within this group, compared to the general population (see Table 1).
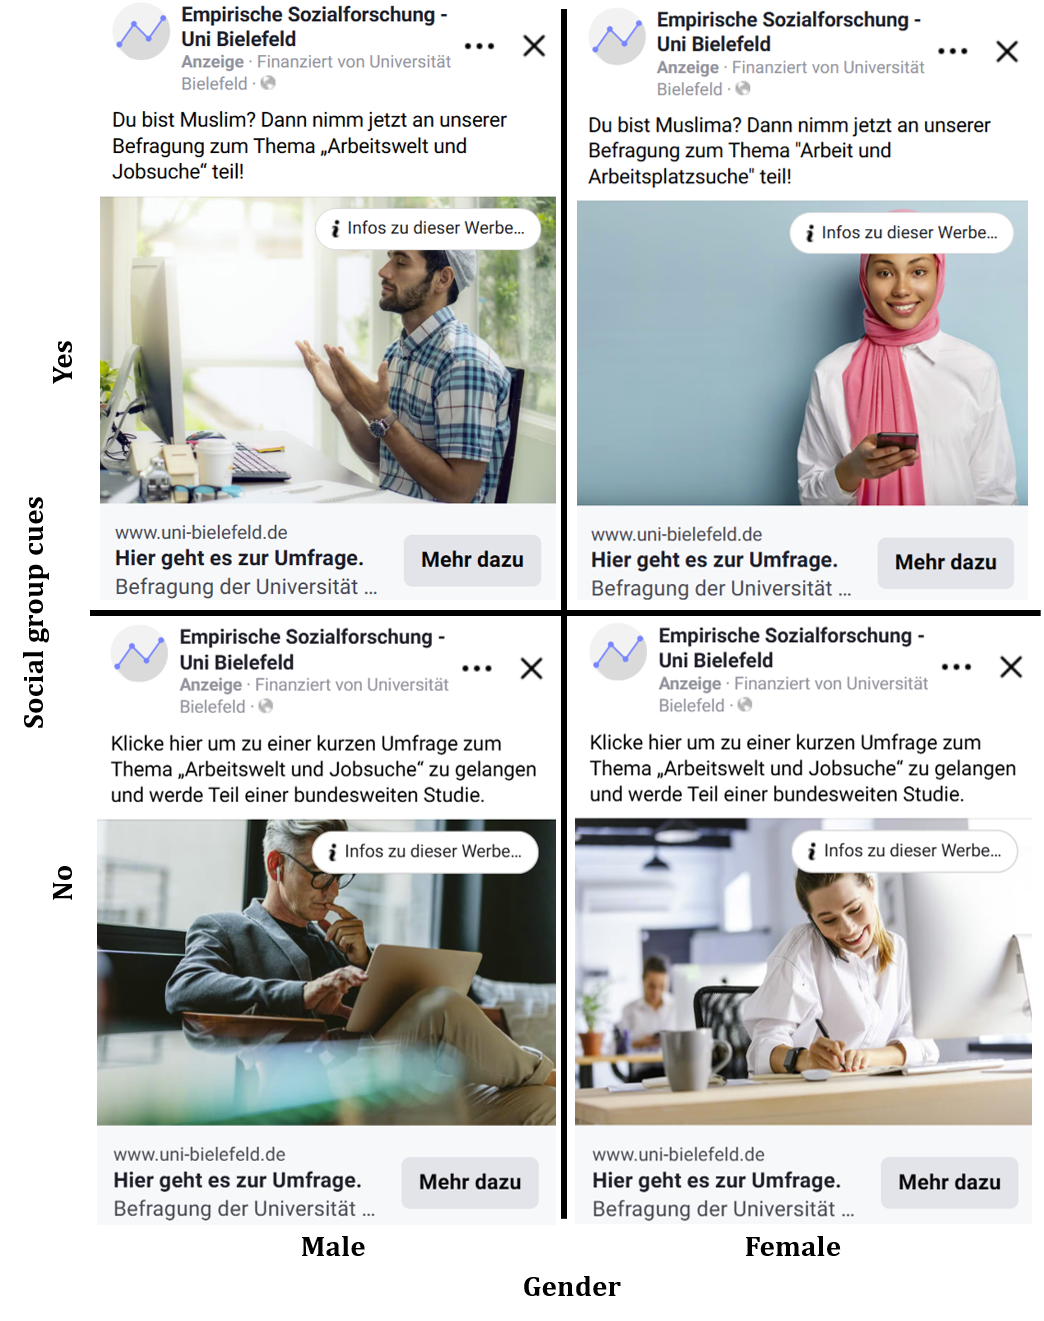
Figure 2. Examples of Facebook advertisements used for survey recruitment across four ad set conditions.
Note: English translation of the main texts, see Table 1.
Recruitment performance
Table 2 summarises key performance metrics for the four ad set conditions. The Facebook campaign generated a total of 899,347 impressions and 14,021 link clicks. Of those who clicked on an ad, 4,970 began the survey, and 1,955 completed it, resulting in a click-to-start rate of 35.5 percent and a completion rate of 13.9 percent among link clickers.[2] The total ad expenditure amounted to €3,789.8 (excl. VAT), yielding an average cost of €1.9 per completed interview. Among the final sample, 1,103 respondents (56.4%) self-identified as Muslim, indicating that the campaign successfully reached large segments of the intended target population.
Table 2. Performance metrics of Facebook ad set conditions.
| # | Ad set | Impres. | LC | CTR (%) | SI (% of LC) | CI (% of LC) | Muslim (self-reported) (% of CI) | Total cost (€) | Avg. cost per CI (€) |
| 1 | Muslim women | 507,990 | 8,767 | 1.7 | 2,555 (29.1) |
911 (10.4) |
491 (53.9) |
2,277.5 | 2.5 |
| 2 | Muslim men | 256,508 | 3,861 | 1.5 | 1,828 (47.4) |
807 (20.9) |
609 (75.5) |
1,026.5 | 1.3 |
| 3 | General population, women | 54,805 | 720 | 1.3 | 321 (44.6) |
148 (20.6) |
2 (1.4) |
240.9 | 1.6 |
| 4 | General population, men | 80,044 | 673 | 0.8 | 216 (32.5) |
89 (13.2) |
1 (1.1) |
244.9 | 2.8 |
| Total | 899,347 | 14,021 | 1.6 | 4,970 (35.5) |
1,955 (13.9) |
1,103 (56.4) |
3,789.8 | 1.9 |
Note: Impres. = Impressions; CTR = Click-Through Rate; LC = Link clicks; SI = started interviews; CI = completed interviews.
Substantial differences emerged across ad set conditions in terms of click-through rates (CTR), conversion patterns, and cost-efficiency. Ad sets containing social group cues (#1 and #2) showed slightly higher CTRs than neutral sets (#3 and #4). The ad set targeting Muslim women (#1) achieved a CTR of 1.7 percent, followed by the Muslim men ad set (#2) at 1.5 percent. In contrast, the neutral ads (sets #3 and #4) reached CTRs of 1.3 percent and 0.8 percent, respectively. These figures suggest that social group cues may enhance the salience and visibility of ads in the competitive attention environment of social media platforms.
However, higher visibility did not necessarily translate into higher participation. While the Muslim men ad set (#2) yielded a relatively high completion rate of 20.9 percent among those who clicked, the Muslim women ad set (#1) exhibited the lowest completion rate at just 10.4 percent. This discrepancy may reflect differences in perceived credibility, personal resonance, or the situational framing of the ads across gendered audiences.[3] Among the neutral sets, ads targeting women (set #3) outperformed those targeting men (set #4) on nearly all metrics, producing both higher click-through and completion rates.
Finally, the proportion of self-identified Muslim respondents was highest in the ad set targeting Muslim men (#2, 75.5%), followed by Muslim women ad sets (#1, 53.9%). In contrast, the neutral ad sets yielded only 2 Muslim respondents among women (ad set #3, 1.4%) and 1 Muslim respondent among men (ad set #4, 1.1%). These stark contrasts suggest that social group cues were not only effective at attracting attention but also instrumental in reaching the ethno-religious target population.
Response quality indicators
To assess data quality, this study relies on seven response quality indicators commonly used in the survey methodology literature. These indicators capture different forms of problematic response behaviour in self-administered online surveys, including signs of low respondent engagement, implausible or inconsistent entries, and technical anomalies. All indicators were constructed based on paradata, self-reported answers, and metadata linked to the survey session.
The first indicator captures instances of speeding, characterised by unusually short completion times and widely used as a proxy for low cognitive effort (Leiner, 2019; Schlosser & Mays, 2018; Ulitzsch et al., 2024). To account for variations in questionnaire length, a normalised response speed index was calculated by dividing the total survey duration by the number of answered items. Respondents falling below the 10th percentile of this distribution were flagged for speeding (using Stata module rspeedindex by Roßmann, 2015).
The second indicator captures non-differentiation (also known as straightlining), a response pattern in which respondents provide identical answers across all items within a battery. This pattern suggests insufficient attention or disengagement with item content (Kim et al., 2019; Maslovskaya et al., 2019). Two multi-item batteries, each containing at least one reverse-coded item, were used to identify such patterns. Respondents were flagged if they showed no variation in either battery (using Stata module: respdiff, Roßmann, 2017).
The third indicator captures item non-response, operationalised as the share of applicable items left unanswered, excluding structurally missing items. This skip rate is another typically used item to assess response quality in surveys (Čehovin et al., 2023; Décieux & Sischka, 2024; Schlosser & Mays, 2018). A binary flag was assigned to cases where more than 20 percent of relevant questions remained unanswered, indicating disengagement or low motivation.
The fourth indicator addresses duplicate enrolments, based on IP addresses. If the same IP address was used to submit multiple completed interviews, all related cases were flagged. While shared IP addresses may occur in institutional settings, multiple full completions from the same address might also raise concerns about misuse or scripted entries (Dennis et al., 2020; Nesoff et al., 2025; Teitcher et al., 2015).
The fifth indicator flags cases with non-Facebook referral sources (Bonett et al., 2024; Griffin et al., 2022). Since recruitment was exclusively conducted via Facebook ads, any other referral path – such as direct links, messenger apps, or blogs – was classified as a deviation from the intended recruitment procedure.
The sixth indicator combines several instances of implausible or inconsistent information (Meade & Craig, 2012; Ward & Meade, 2023). Respondents were flagged if they reported being younger than 18 or older than 85, claimed implausibly young parenthood (e.g., five children at the age of 18), or stated that they never used Facebook – despite having been recruited via the platform. While each condition occurred infrequently, they were conceptually aligned and jointly used to flag potentially problematic entries.
Finally, the seventh indicator concerns lower content quality in open-text responses. All open-ended responses were manually reviewed based on predefined coding criteria. Entries containing meaningless strings, off-topic content, or intentionally disruptive remarks were flagged as problematic (Behr et al., 2012; Cibelli Hibben et al., 2025; Singer & Couper, 2017).
In addition to these seven individual indicators, a binary summary measure was constructed, capturing whether a respondent triggered at least one of the flags. This provides a conservative estimate of the prevalence of problematic response behaviour within the sample.
Analytical strategy
The analytical strategy follows the five research questions of the present paper and proceeds cumulatively to examine how social group cues in recruitment affect data quality, sample composition, and substantive outcomes. All analyses were conducted using Stata (version 17/MP).
RQ1: Do social group cues in social media ads increase the prevalence of problematic response behaviour?
The prevalence of problematic response behaviour is compared across ad conditions. A binary indicator capturing whether at least one of the seven quality criteria was triggered. Group differences are assessed using chi-square tests, and proportions are examined with binomial confidence intervals. Additionally, individual indicators of problematic behaviour are analysed separately to identify which types are most sensitive to variation in recruitment framing.
RQ2: Are specific profiles of problematic response behaviour more prevalent when social media ads include social group cues?
A latent class analysis (LCA) is conducted to identify respondent subgroups based on all seven binary indicators. Class membership is assigned based on posterior probabilities. The distribution of latent classes is compared across ad sets using chi-square test to assess whether recruitment framings are associated with different response profiles.
RQ3: Do problematic respondents systematically differ in their reported sociodemographic characteristics from non-problematic respondents?
The sociodemographic composition of the identified classes is compared within the two ad conditions with social group cues (ad sets #1 and #2) to assess whether problematic response behaviour is randomly distributed or systematically linked to reported sociodemographic background. The sample restriction ensures that class differences are not confounded by variation in recruitment targets (i.e., Muslim vs. general population). Pairwise chi-square or, depending on cell sizes, Fisher’s exact tests are applied to compare class distributions.
RQ4: Do problematic respondents systematically differ in their reported attitudinal measures from non-problematic respondents?
To explore potential distortion of attitudinal outcomes, problem class membership is related to three dependent variables: tolerance toward Muslim practices, perceptions of anti-Muslim discrimination, and concerns about religious and racial intolerance. All three are measured as mean indices. Tolerance is based on four items, and perception of Anti-Muslim discrimination on five items – both using a range from 1 (do not agree at all) to 4 (completely agree). Concerns are based on five items with a range from 1 (no concerns at all) to 3 (strong concerns) (see Appendix A3-A5 for respective items). The analysis is restricted to respondents recruited via social group cue ads (sets #1 and #2) and who reported a Muslim group affiliation. Differences between response classes are tested using Kruskal-Wallis and post-hoc Dunn tests with Bonferroni correction.
RQ5: Do problematic respondents affect the estimation of key multivariate relationships?
Multiple linear regression models with robust standard errors are estimated to assess the robustness of key attitudinal outcomes, namely tolerance, perception, and concerns, as described for RQ4. As a key predictor, all models include frequency of prayer, a behavioural indicator of religious practice. Independent variables include Muslim group affiliation (0 = no, 1 = yes), male gender identity (0 = no, 1 = yes), age (grouped), in employment (0 = no, 1 = yes), region (0 = new federal states, 1 = old federal states), and country of birth (1 = Germany, 2 = predominantly Muslim country, 3 = another country).
To evaluate the influence of problematic response behaviour, model specifications are estimated for the full sample and for subsets excluding problematic respondents – either completely (class 1 only) or partially (class 1 combined with class 2 or class 3).
4 Results
Results are presented according to the five research questions in Section 3, combining a series of descriptive analyses with multivariate modelling.
RQ1: Do social group cues in social media ads increase the prevalence of problematic response behaviour?
Across the full sample, 31.8 percent of cases triggered at least one indicator, indicating that response quality concerns are non-trivial in this survey context. Comparing ad conditions, 24.1 percent (95% CI: 18.8-30.0) of respondents from ads without social group cues showed signs of problematic behaviour, compared to 32.9 percent (95% CI: 30.7-35.2) from social group cues ads. Although moderate in absolute size, this difference is statistically significant (χ²(1) = 7.5, p = 0.006), pointing to a systematic effect of recruitment framing on data quality.
A breakdown by advertisement conditions reinforces this pattern (Figure 3). Ads explicitly referencing Muslim male identity (ad set #2) showed the highest prevalence of problematic behaviour (39.0%, 95% CI: 35.7-42.5), followed by general population men (#4: 28.1%, 95% CI: 19.1-38.6), Muslim women (#1: 27.4%, 95% CI: 24.6-30.5) and general population women (#3: 21.6%, 95% CI: 15.3-29.1). Notably, the difference between general population men (ad set #4) and women (#3) is not statistically significant, suggesting that gender targeting alone does not account for variation in response quality. Rather, the data indicate that the intersection of ethno-religious cues and male targeting is especially sensitive to elevated levels of problematic behaviour.
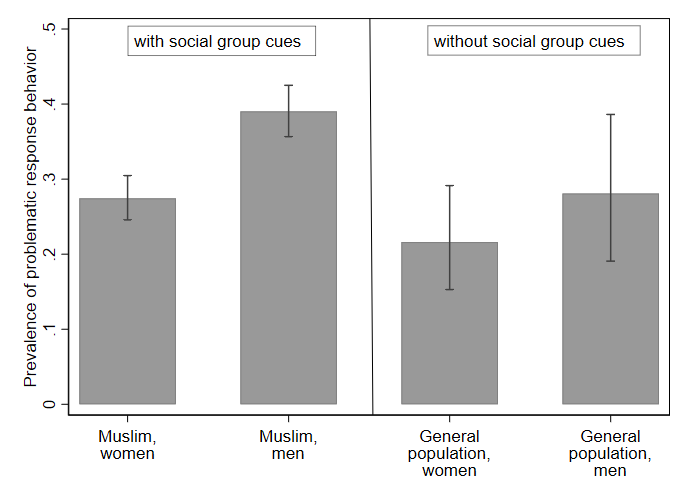
Figure 3. Prevalence of problematic response behaviour across ad set conditions with 95% confidence intervals.
Note: Group sizes – Muslim, women (n = 911), Muslim, men (n = 807), general population, women (n = 148), general population, men (n = 89). N=1,955.
To identify which quality issues drive these differences, each of the seven response quality indicators was examined separately (Table 3). As speeding is defined using a relative threshold – the lowest decile of corrected response speed – it is reported using mean completion times per survey question. Respondents recruited via ads targeting Muslim women (ad set #1) spent the most time per item (M = 8.1 minutes), whereas the shortest average was observed among ad set for the general population men (#4) (M = 6.8 minutes). For the remaining indicators, results are presented as proportions of flagged cases. Non-differentiation, which captures uniform responses to matrix items, ranged from 4.1 percent among general population, women ad set (#3) to 6.5 percent among the Muslim, women ad set (#1). Similarly, item non-response remained low across all ad conditions and did not exceed 8 percent.
Table 3. Prevalence of response quality indicators by ad set conditions
| Indicator
Flagged for … |
With social group cues | Without social group cues | ||
| Muslim, women (#1) | Muslim, men (#2) | Gen. pop., women (#3) | Gen. pop., men (#4) | |
| [95% CI] | [95% CI] | [95% CI] | [95% CI] | |
| speeding (Average time per survey question, in minutes) | 8.1 [7.8-8.4] |
7.0 [6.8-7.3] |
6.8 [6.3-7.3] |
6.7 [6.0-7.4] |
| non-differentiation (%) | 6.5 [5.0-8.3] |
6.1 [4.5-8-0] |
4.1 [1.5-8.6] |
4.5 [1.2-1.1] |
| item non-response (%) | 7.0 [5.5-8.9] |
7.2 [5.5-9.2] |
6.1 [2.8-11.2] |
7.9 [3.2-15.5] |
| duplicate enrolment (%) | 3.2 [2.1-4.5] |
3.6 [2.4-5.1] |
0.7 [0.0-3.7] |
2.3 [0.3-7.9] |
| non-Facebook referral source (%) | 0.3 [0.1-1.0] |
3.4 [2.2-4.8] |
0.7 [0.2-3.7] |
0.0 [0.0-4.1]* |
| implausible information (%) | 5.7 [4.3-7.4] |
8.2 [6.4-10.3] |
1.4 [0.2-4.8] |
0.0 [0.00-4.1]* |
| low content quality (%) | 4.9 [3.6-6.6] |
13.0 [10.8-15.5] |
2.0 [0.4-5.8] |
5.6 [1.9-12.6] |
Note: Percentage estimates are based on binomial exact confidence intervals. Interview duration is based on group means with corresponding confidence intervals. *For indicators with 0% prevalence, the upper bound of a one-sided 97.5% CI is reported. Group sizes: Muslim, women (n = 911), Muslim, men (n = 807), general population, women (n = 148), general population, men (n = 89). N=1,955.
Duplicate enrolments occurred more frequently in the ad sets using social group cues (Muslim, women, #1: 3.2%; Muslim, men, #2: 3.6%) than among general population respondents (women, #3: 0.7%; men, #4: 2.3%). Referral inconsistencies, that is, participation via non-Facebook links, were almost exclusively observed in the Muslim men ad set (#2, 3.4%), with rates near zero in the other ad conditions.
The indicator for implausible information followed a similar pattern: 8.2 percent of respondents coming from the Muslim, men ad set (#2) and 5.7 percent from the ad set for Muslim women (#1) showed substantially higher rates compared to ad sets targeted at the general population (women, #3: 1.4%; men, #4: 0.0%). The strongest variation emerged for the indicator of low-quality open-text responses. In the ad set targeted at Muslim, men (#2), 13.0 percent of responses were flagged, compared to 4.9 percent in the ad set for Muslim, women (#1), 5.6 percent in general population, men (#4) and 2.0 percent in the ad set for general population women (#3).
RQ2: Are specific profiles of problematic response behaviour more prevalent when social media ads include social group cues?
To move beyond the binary indicators, a latent class analysis (LCA) was conducted using the seven quality indicators to uncover recurring response patterns. A three-class solution provided the best empirical fit (LL = –2942.8, AIC = 5931.5, BIC = 6059.8), with posterior classification probabilities confirming sufficient separation between classes. Regression coefficients and Wald tests support the model’s structure, although the indicators for implausible information and non-differentiation contributed less clearly to class differentiation (see Appendix Table A6).
Class 1 comprises the majority of respondents (84.5%) and is characterised by uniformly low probabilities across all indicators. These respondents exhibit high engagement and consistent data quality and are therefore interpreted as the attentive, low-risk baseline group (Table 4). In contrast, class 2 (5.5%) and class 3 (10.0%) exhibit higher rates of problematic patterns. Class 2 is marked by elevated rates of implausible information (85.0%), low-quality open-text input (22.8%), and referral inconsistencies (8.0%), while other indicators remain low. This constellation suggests – either random or strategic – misrepresentation, possibly driven by falsified entries or misuse of the survey link beyond the intended audience. Finally, class 3 is characterised by elevated rates of speeding (69.3%) and item non-response (22.5%), along with moderate non-differentiation (8.4%). This pattern points to satisficing behaviour, indicating low cognitive effort or careless engagement. The indicator for duplicate enrolments is also elevated in this group (14.0%), underscoring that behaviour patterns can overlap and that individual indicators do not map neatly onto singular motivations.
Table 4. Latent class marginal means
| Indicators
Flagged for … |
Class 1 | Class 2 | Class 3 | |||
| M | SE | M | SE | M | SE | |
| speeding | 0.020 | 0.035 | 0.056 | 0.054 | 0.693 | 0.292 |
| non-differentiation | 0.049 | 0.011 | 0.058 | 0.029 | 0.225 | 0.075 |
| item non-response | 0.055 | 0.007 | 0.086 | 0.029 | 0.084 | 0.026 |
| duplicate enrolment | 0.135 | 0.008 | 0.063 | 0.028 | 0.140 | 0.056 |
| non-Facebook referral source | 0.007 | 0.005 | 0.080 | 0.031 | 0.042 | 0.021 |
| implausible information | 0.000 | 0.013 | 0.850 | 0.612 | 0.059 | 0.040 |
| low content quality | 0.071 | 0.011 | 0.228 | 0.055 | 0.068 | 0.024 |
Note: Group sizes: class 1 (n = 1,651), class 2 (n = 108), class 3(n = 196). N=1,955.
Figure 4 displays the relative frequency of latent classes within each ad set group, based on modal assignment. Respondents recruited via Muslim men ad set (#2) were most likely to fall into both class 2 (7.3%) and class 3 (13.1%). For the Muslim women ad set (#1), corresponding rates were 5.2 percent (class 2) and 7.0 percent (class 3). Problematic profiles were least frequent in the general population groups: in the female ad set (#3), class 2 percentage was 1.4 percent and class 3 was 11.5 percent; among the male ad set (#4), no class 2 cases were observed, and class 3 reached 10.1 percent.
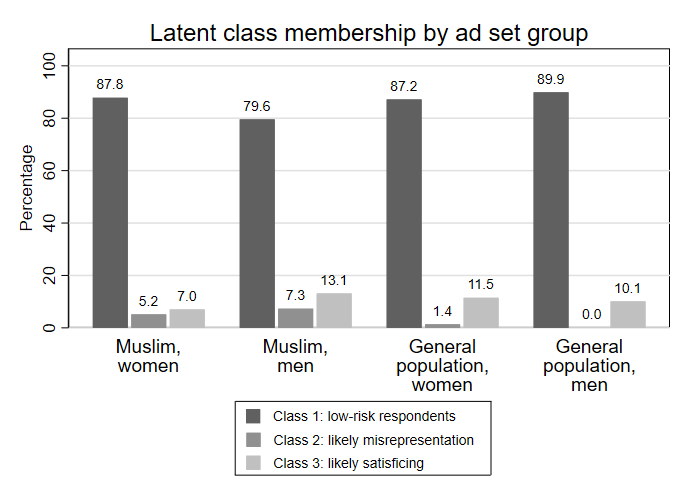
Figure 4. Latent class membership of ad set groups.
Note: Group sizes: Muslim, women (n = 911), Muslim, men (n = 807), general population, women (n = 148), general population, men (n = 89). N=1,955.
These findings mirror the pattern found when investigating RQ1. Both satisficing and misrepresentation behaviour occur more frequently with social group cue recruitment, particularly when referencing Muslim men. While problematic behaviour is not exclusive to any single group, the intersection of male targeting and ethno-religious framing appears particularly sensitive.
RQ3: Do problematic respondents systematically differ in their reported sociodemographic characteristics from non-problematic respondents?
Table 5 presents sociodemographic characteristics by latent class within the Muslim women ad set (#1). The attentive baseline group (class 1) closely matched the intended target group: these respondents were comparatively older (33.1% aged 50 or above), vocationally trained (83.2%), and employed (67.4%), with a high rate of German citizenship (81.7%). In contrast, class 2 – characterised as likely misrepresentation – diverged from class 1 across several dimensions. A significantly higher share selected a third gender option (15.4%).[4] Beyond this, nearly half of respondents in class 2 reported being under 30 (45.2%), and vocational qualifications were less common (58.7%). This group also includes more reports of unemployment (44.7%) and a larger share with three or more children (37.0%). Class 3 (likely satisficing) showed only one statistically significant deviation from the baseline class. A larger proportion of respondents reported having no children (43.4%), which may reflect satisficing behaviour given the order of response options. Across other indicators, including gender identity, age groups, vocational training, and employment, this group remains broadly comparable to the attentive baseline.
Table 5. Reported sociodemographic characteristics by response quality class – Muslim women ad set (#1).
| Class (%) | χ² | ||||
| Variable | 1 | 2 | 3 | 1 vs. 2 | 1 vs. 3 |
| Gender identity | 11.3** | 2.0 | |||
| Male | 8.0 | 15.4 | 15.2 | ||
| Female | 88.6 | 69.2 | 81.8 | ||
| Other | 3.4 | 15.4 | 3.0 | ||
| Age group | 13.2** | 7.4 | |||
| 18-29 | 23.5 | 45.2 | 38.6 | ||
| 30-39 | 23.5 | 23.8 | 27.3 | ||
| 40-49 | 20.0 | 19.1 | 15.9 | ||
| 50+ | 33.0 | 11.9 | 18.2 | ||
| Religious affiliation | 9.9** | 0.5 | |||
| Muslim | 53.0 | 76.6 | 42.4 | ||
| Other or no religion | 47.0 | 23.4 | 57.6 | ||
| Vocational training | 17.6*** | 2.7 | |||
| No | 16.8 | 41.3 | 25.5 | ||
| Yes | 83.2 | 58.7 | 74.6 | ||
| Employment status | 2.9 | 0.5 | |||
| Not employed | 32.6 | 44.7 | 28.1 | ||
| Employed | 67.4 | 55.3 | 71.9 | ||
| Children | 9.6* | 5.5 | |||
| None | 31.8 | 41.3 | 43.4 | ||
| One | 19.3 | 8.7 | 20.8 | ||
| Two | 25.2 | 13.0 | 24.5 | ||
| Three or more | 23.7 | 37.0 | 11.3 | ||
| German citizenship | 2.5 | 0.6 | |||
| No | 18.4 | 27.7 | 14.3 | ||
| Yes | 81.7 | 72.3 | 85.7 | ||
| Region (federal states) | 0.0 | 1.9 | |||
| New states (incl. Berlin) | 17.9 | 18.0 | 26.1 | ||
| Old states | 82.1 | 82.0 | 73.9 | ||
| Country of birth | 4.3 | 1.5 | |||
| Germany | 72.2 | 75.6 | 66.0 | ||
| Pred. Muslim country | 22.5 | 13.3 | 30.0 | ||
| Other | 5.3 | 11.1 | 4.0 | ||
Note: Values represent column percentages within each latent class. Statistical tests (Chi-squared) compare distributions between classes. * p <.05, ** p < .01, ***<.001. For all pairwise comparisons, Fisher’s exact tests were conducted as robustness checks due to unequal class sizes. Class sizes for social group cue ads only: class 1 (n=800), class 2 (n=47), class 3 (n=64). N = 911.
In the Muslim men ad set (#2), shown in Table 6, class 1 respondents again largely aligned with the recruitment target group: most identified as male (85.5%) and Muslim (77.1%). Most also indicated vocational training (67.3%), employment (64.5%), and German citizenship (63.1%). Compared to this baseline, class 2 showed multiple statistically significant deviations. A markedly higher share selected a third gender option (30.2%) and fewer reported vocational training (15.5%). Unemployment was substantially more frequent (74.1%), and a large majority reported having three or more children (72.4%). This group also had a significantly lower share of German-born respondents (19.6%) and German citizenships (29.8%), indicating an overall pattern of atypical and maybe even fraudulent demographic claims. Class 3 differs significantly from class 1 in only a few respects. The share without vocational training is higher (48.4%). And the distribution of children is notably polarised: 43.2 percent reported having no children, while 36.8 percent had three or more. These response patterns may reflect satisficing behaviour, as they cluster around the first and last options within the relevant items. For most other characteristics, class 3 remains statistically comparable to the attentive group.
Table 6. Reported sociodemographic characteristics by response quality class – Muslim men ad set (#2).
| Class (%) | χ² | ||||
| Variable | 1 | 2 | 3 | 1 vs. 2 | 1 vs. 3 |
| Gender identity | 34.9*** | 3.3 | |||
| Male | 85.5 | 62.3 | 79.8 | ||
| Female | 7.9 | 7.6 | 8.5 | ||
| Other | 6.6 | 30.2 | 11.7 | ||
| Age group | 8.4* | 3.5 | |||
| 18-29 | 29.0 | 48.9 | 34.1 | ||
| 30-39 | 34.4 | 28.9 | 35.3 | ||
| 40-49 | 21.0 | 11.1 | 22.4 | ||
| 50+ | 15.6 | 11.1 | 8.2 | ||
| Religious affiliation | 0.5 | 2.2 | |||
| Muslim | 77.1 | 81.0 | 70.3 | ||
| Other or no religion | 22.9 | 19.0 | 29.7 | ||
| Vocational training | 61.1*** | 8.6** | |||
| No | 32.7 | 84.5 | 48.4 | ||
| Yes | 67.3 | 15.5 | 51.7 | ||
| Employment status | 33.4*** | 0.0 | |||
| Not employed | 35.5 | 74.1 | 36.0 | ||
| Employed | 64.5 | 25.9 | 64.0 | ||
| Children | 38.4*** | 3.4 | |||
| None | 39.6 | 15.5 | 43.2 | ||
| One | 11.7 | 5.2 | 9.5 | ||
| Two | 16.9 | 6.9 | 10.5 | ||
| Three or more | 31.8 | 72.4 | 36.8 | ||
| German citizenship | 24.1*** | 0.6 | |||
| No | 37.0 | 70.2 | 33.0 | ||
| Yes | 63.1 | 29.8 | 67.0 | ||
| Region (federal states) | 8.3** | 4.2* | |||
| New states (incl. Berlin) | 19.0 | 36.0 | 28.6 | ||
| Old states | 81.0 | 64.0 | 71.4 | ||
| Country of birth | 19.4*** | 0.9 | |||
| Germany | 50.2 | 19.6 | 45.1 | ||
| Pred. Muslim country | 45.3 | 68.6 | 49.5 | ||
| Other | 4.6 | 11.8 | 5.5 | ||
Note: Values represent column percentages within each latent class. Statistical tests (Chi-squared) compare distributions between classes. * p <.05, ** p < .01, ***<.001. For all pairwise comparisons, Fisher’s exact tests were conducted as robustness checks due to unequal class sizes. Class sizes: class 1 (n=642), class 2 (n=59), class 3 (n=106). N = 807.
Across both recruitment frames, there is a notable share of respondents whose reported religious affiliation did not match the recruitment cue. Despite the explicit call for Muslim participants, 47.0 percent (ad set #1) and 22.9 percent (ad set #2) of class 1 respondents reported another or no religious affiliation.
Taken together, the results of sociodemographic comparisons indicate that problematic response profiles, particularly class 2, are associated with highly atypical or internally inconsistent reporting.
RQ4: Do problematic respondents systematically differ in their reported attitudinal measures from non-problematic respondents?
Table 7 displays the mean index values for each attitude dimension by latent class and ad condition, alongside results from Kruskal–Wallis tests and pairwise Dunn’s tests (Bonferroni-corrected). In the Muslim women ad set (#1), only tolerance regarding Muslim religious practices showed a statistically significant overall difference (χ²(2) = 6.6, p = 0.037). Pairwise Dunn tests showed that respondents in class 2 (likely misrepresentation) reported higher average tolerance scores than class 1 (z = -2.3, p = 0.036). However, this finding is contrary to theoretical expectations and is likely attributable to random variation, given the small subsample size, especially since no comparable effect was observed in the male-targeted (#2) sample. Although the overall test for concerns regarding religious and racial intolerance in Germany was only close to significance, the pairwise comparison between class 1 and class 3 revealed a significant difference (z = 2.3, p = .032), with class 3 respondents expressing lower levels of concern. No significant differences emerged for the index measuring the belief that Muslim individuals face more discrimination than other groups in Germany.
Table 7. Mean values and comparison tests for attitudinal indices by class and ad sets (#1 & #2).
| Tolerance | Discrimination | Concerns | ||||||||||
| Class | M | SD | χ² | z | M | SD | χ² | z | M | SD | χ² | z |
| Muslim women ad set (#1) | ||||||||||||
| 1 | 2.6 | 1.1 | 2.5 | 0.9 | 2.1 | 0.8 | ||||||
| 2 | 3.0 | 1.2 | 2.6 | 1.0 | 2.2 | 0.9 | ||||||
| 3 | 2.4 | 1.1 | 2.2 | 1.1 | 1.8 | 0.9 | ||||||
| Overall | 6.6* | 4.7 | 6.0 | |||||||||
| 1 vs. 2 | -2.3* | -1.4 | -0.7 | |||||||||
| 1 vs. 3 | 1.1 | 1.6 | 2.3* | |||||||||
| Muslim men ad set (#2) | ||||||||||||
| 1 | 2.8 | 1.1 | 2.4 | 1.1 | 2.0 | 0.8 | ||||||
| 2 | 2.5 | 1.3 | 2.3 | 1.3 | 1.6 | 0.8 | ||||||
| 3 | 2.6 | 1.2 | 2.1 | 1.2 | 1.7 | 0.9 | ||||||
| Overall | 6.9** | 4.7 | 21.3*** | |||||||||
| 1 vs. 2 | 1.9 | 0.7 | 3.9*** | |||||||||
| 1 vs. 3 | 2.1 | 2.1 | 2.9** | |||||||||
Note: Tolerance and discrimination range from 1 (do not agree at all) to 4 (completely agree). Concern ranges from 1 (no concerns at all) to 3 (big concerns). Omnibus comparisons were made via Kruskal–Wallis test statistics ( ), pairwise comparisons were made using Dunn’s test with Bonferroni correction. * p <.05, ** p < .01, ***<.001. For all Kruskal-Wallis tests: df = 2.
In the Muslim men ad set (#2), group differences were more pronounced. A strong effect emerges in the concern index (χ²(2) = 21.3, p < .001), where class 2 respondents reported significantly lower concern levels than both class 1 (z = 3.9, p<.001) and class 3 (z = 2.9, p = .005). These patterns support the interpretation that class 2, marked by potential misrepresentation, systematically deviates from the expected in-group attitudinal profile. For tolerance, the Kruskal–Wallis test was also significant (χ²(2) = 6.9, p = .032), though the pairwise comparison between class 1 and class 2 fell short of significance (z = 1.9, p = .098). Again, no significant contrasts emerged for the discrimination index.
Taken together, these results indicate that response quality profiles – particularly class 2 in the male-targeted recruitment group – are associated with meaningful variation in the reporting of key attitudes. Most notably, reduced concern about societal discrimination and intolerance among likely misrepresenting respondents may reflect disengagement, strategic distortion, or even hostile response tendencies. And although class 3 differences are less pronounced, selective underreporting due to satisficing cannot be ruled out and may still affect the interpretation of key attitudinal measures.
RQ5: Do problematic respondents affect the estimation of key multivariate relationships?
To assess the robustness of estimated associations under varying quality assumptions, four model specifications are estimated for each attitudinal outcome: (1) a full model including all respondents, (2) a model restricted to class 1 (i.e., attentive respondents), (3) a model including class 1 and 2 (excluding satisficing respondents), and (4) a model including class 1 and 3 (excluding likely misrepresenting respondents).
Table 8 summarises central model diagnostics across these specifications.
Table 8. Model fit statistics under different response quality specifications
| Tolerance | Discrimination | Concerns | |
| (1) full model | |||
| N | 1,578 | 1,571 | 1,577 |
| Adjusted R² | 0.355 | 0.140 | 0.198 |
| RMSE | 0.865 | 0.912 | 0.718 |
| (2) only class 1 | |||
| N | 1,374 | 1,368 | 1,373 |
| Adjusted R² | 0.361 | 0.148 | 0.196 |
| RMSE | 0.851 | 0.885 | 0.708 |
| (3) class 1 & 2 | |||
| N | 1,452 | 1,445 | 1,451 |
| Adjusted R² | 0.363 | 0.151 | 0.205 |
| RMSE | 0.858 | 0.895 | 0.709 |
| (4) class 1 & 3 | |||
| N | 1,500 | 1,494 | 1,499 |
| Adjusted R² | 0.353 | 0.137 | 0.189 |
| RMSE | 0.859 | 0.904 | 0.718 |
Note: Dependent variables are continuous indices. Models include identical covariates, with frequency of prayer as the key independent variable.
Model fit varies only modestly across specifications. For concerns about intolerance, excluding satisficing respondents (class 3) yields slightly improved fit (R² = 0.205 vs. 0.198 in full model; RMSE = 0.709 vs. 0.718). For discrimination, excluding class 3 leads to a small gain in explained variance (R² = 0.151 vs. 0.140), while for tolerance, differences in fit are negligible. Overall, these differences suggest that excluding problematic response profiles does not dramatically alter model performance but may incrementally improve model precision.
That said, coefficient sensitivity reveals more meaningful implications. Some interaction effects between ad set and prayer frequency are significant in the full model but disappear when problematic respondent classes are excluded (see Appendix Tables A7-A9). For example, in the tolerance model, interactions involving the general population ad sets are no longer significant when the analysis is restricted to class 1 respondents. This inconsistency suggests that problematic response patterns may artificially inflate or suppress subgroup effects. Likewise, in the concerns model, excluding likely misrepresenting respondents (class 2) yields not only slightly higher R² values but also more pronounced effects for key predictors, such as religious affiliation. This implies that noise from problematic respondents can attenuate the strength of substantive associations, conceivably distorting analytical conclusions.
Finally, the effect of the ad set targeted at Muslim men (#2) remains statistically significant and substantively strong across all model specifications for both concerns and discrimination. This robustness suggests that recruitment via social group cues not only influences sample composition but may also introduce persistent attitudinal skews, potentially through self-selection – even when controlling for response quality classes.
5 Discussion & conclusion
This paper examined the methodological potentials and pitfalls of recruiting ethno-religious minorities via social media advertisements, with particular focus on the use of social group cues. While such cues remain among the few viable tools for reaching rare, hard-to-reach or underrepresented populations – especially as social media platform-level targeting options become increasingly restricted – their use is not without risk.
The findings reveal a central tension. On the one hand, social group cues increase the prevalence of reaching the intended target population. Among completed interviews, more than half of the respondents self-identified as Muslim. In contrast, neutral ads resulted in virtually no respondents from the intended group. This stark contrast shows that social group cues are not just helpful but often indispensable when aiming to sample marginalised identities and thereby trying to enhance their visibility in scientific research.
On the other hand, social group cues can trigger problematic response behaviours – particularly when referencing politicised identities such as Muslim men. Ads targeting this group elicited disproportionately high rates of quality issues, including implausible entries and hostile or disengaged responses, in comparison to ads directed at the general population. This suggests that such cues operate not only as recruitment signals but may also act as ideological triggers. Rather than being interpreted as neutral invitations, they may be perceived as politically charged statements and provoke oppositional participation or strategic disruption.
Using latent class analysis, three response profiles were identified: attentive and valid respondents (84.5%), likely misrepresentation (5.5%), and likely satisficing (10.0%). These classes differed not only in response quality indicators but also in the plausibility of demographic data and the nature of attitudinal responses. Notably, misrepresentation cases mirrored stereotypical portrayals of Muslims in German public discourse, characterised by low levels of education, unemployment, and large numbers of children. Satisficing respondents, while less overtly inconsistent, displayed disengaged behaviours such as straightlining or default answer selection.
Although the exclusion of problematic cases resulted in only modest gains in overall model fit, even small gains in adjusted R² and RMSE suggest that data quality management improves model precision. More crucially, individual coefficients proved sensitive to data quality. Several interaction effects between ad set and religious practice lost significance when problematic classes were excluded, indicating that such response patterns can artificially inflate subgroup differences. Notably, the negative association between the male-targeted ad set and attitudes toward discrimination and intolerance remained consistently strong and significant across all model variants, including those excluding problematic profiles. This suggests that recruitment framing itself, independent of data quality, can shape the attitudinal composition of the respondent pool through self-selection processes.
Thus, should we worry about problematic response behaviour in social media surveys? The answer is yes, but not unconditionally. Problematic responses are a real and measurable concern in social group cue-based recruitment, particularly when targeting politicised groups. However, these challenges are not fatal to the method. With appropriate diagnostic tools and design strategies, quality issues can be identified, mitigated, and managed.
Thus, researchers should worry – not to avoid, but to improve. Social media platforms offer unique opportunities to give voice to groups that remain largely invisible in traditional sampling infrastructures. If designed with methodological care and political sensitivity, social group cues can help surface lived realities that are otherwise overlooked. Rather than avoiding the risks associated with social group cues-based recruitment, researchers should take them seriously and adapt reflexive, transparent, and context-aware advertising strategies. This includes pilot-testing ad variants to identify and avoid unwanted, distorting tendencies early on, integrating quality diagnostics into survey design, for instance, in the form of attention checks, and openly reporting on recruitment materials and procedures to enable replication.
These findings come with limitations. Misclassification in response quality assessment is possible, and latent class modelling relies on assumptions such as local independence. Moreover, problematic response behaviour remains relatively rare, which increases statistical uncertainty. While this study focused on the ethno-religious group of Muslims in the German context, similar mechanisms likely apply to other stigmatised group identities. Future research should explore these dynamics across platforms, demographic groups, and political environments to better understand the intersection of identity, data quality, and digital recruitment.
[1] Ethical approval for this study was obtained from Bielefeld University’s ethics committee (reference no. 2020-154).
[2] For non-probability samples, the term “response rate” should be avoided, as it is tied to probability sampling and not applicable here. Following Callegaro and DiSogra (2008), “completion rate” is used to denote the share of individuals who potentially saw the ad and completed the survey.
[3] Several explanations are possible for the lower completion rate observed in the Muslim women ad set (#1). Muslim women may be underrepresented on Facebook or less inclined to participate in surveys. Alternatively, explicit reference to Muslim male identity may have provoked more attention, whether through supportive interest or oppositional engagement. The current ad design, however, does not allow for a definitive interpretation of these dynamics.
[4] The third gender option combines respondents selecting either “diverse” or “another gender identity, namely: ____”. Since responses to the open-ended part also contributed to the indicator of lower content quality, elevated proportions in this category – particularly in class 2 – may largely reflect dependencies between class-defining indicators.
Online Appendix
References
- Behr, D., Kaczmirek, L., Bandilla, W., & Braun, M. (2012). Asking Probing Questions in Web Surveys. Social Science Computer Review, 30(4), 487–498. https://doi.org/10.1177/0894439311435305
- Bell, A. M., & Gift, T. (2023). Fraud in Online Surveys: Evidence from a Nonprobability, Subpopulation Sample. Journal of Experimental Political Science, 10(1), 148–153. https://doi.org/10.1017/XPS.2022.8
- Bonett, S., Lin, W., Sexton Topper, P., Wolfe, J., Golinkoff, J., Deshpande, A., Villarruel, A., & Bauermeister, J. (2024). Assessing and Improving Data Integrity in Web-Based Surveys: Comparison of Fraud Detection Systems in a COVID-19 Study. JMIR Formative Research, 8, e47091. https://doi.org/10.2196/47091
- Callegaro, M., & DiSogra, C. (2008). Computing Response Metrics for Online Panels. Public Opinion Quarterly, 72(5), 1008–1032. https://doi.org/10.1093/poq/nfn065
- Carpenter, J., Jackson, C., & Behrens, L. (2023). INCENTIVES + SOCIAL MEDIA RECRUITMENT + MINIMAL SUBJECT INTERACTION = POTENTIAL FOR FRAUD! Innovation in Aging, 7(Supplement_1), 354. https://doi.org/10.1093/geroni/igad104.1178
- Čehovin, G., Bosnjak, M., & Lozar Manfreda, K. (2023). Item Nonresponse in Web Versus Other Survey Modes: A Systematic Review and Meta-Analysis. Social Science Computer Review, 41(3), 926–945. https://doi.org/10.1177/08944393211056229
- Chandler, J. J., & Paolacci, G. (2017). Lie for a Dime. Social Psychological and Personality Science, 8(5), 500–508. https://doi.org/10.1177/1948550617698203
- Cibelli Hibben, K., Smith, Z., Rogers, B., Ryan, V., Scanlon, P., & Hoppe, T. (2025). Semi-Automated Nonresponse Detection for Open-Text Survey Data. Social Science Computer Review, 43(1), 166–190. https://doi.org/10.1177/08944393241249720
- Cotter, K., Medeiros, M., Pak, C., & Thorson, K. (2021). “Reach the right people”: The politics of “interests” in Facebook’s classification system for ad targeting. Big Data & Society, 8(1), Article 2053951721996046. https://doi.org/10.1177/2053951721996046
- Décieux, J. P., & Sischka, P. E. (2024). Comparing Data Quality and Response Behavior Between Smartphone, Tablet, and Computer Devices in Responsive Design Online Surveys. Sage Open, 14(2), Article 21582440241252116. https://doi.org/10.1177/21582440241252116
- Dennis, S. A., Goodson, B. M., & Pearson, C. A. (2020). Online Worker Fraud and Evolving Threats to the Integrity of MTurk Data: A Discussion of Virtual Private Servers and the Limitations of IP-Based Screening Procedures. Behavioral Research in Accounting, 32(1), 119–134. https://doi.org/10.2308/bria-18-044
- Dillman, D. A., Smyth, Jolene, D., & Christian, L. M. (2014). Internet, Phone, Mail, and Mixed-Mode Surveys: The Tailored Design Method (4th ed.). Wiley.
- Dolinski, D., Grzyb, T., Kulesza, W., Błaszczyk, P., Laska, D., Liebersbach, F., Redkiewicz, D., & Strzelczyk, Ł. (2024). ‘We are looking for people like you’ – new technique of social influence as a tool of improving response rate in surveys. Social Influence, 19(1), Article 2316348. https://doi.org/10.1080/15534510.2024.2316348
- Donzowa, J., Kühne, S., & Zindel, Z. (2025). From Clicks to Quality: Assessing Advertisement Design’s Impact on Social Media Survey Response Quality. Method, Data, Analyses, 19(1), 95–136. https://doi.org/10.12758/mda.2025.05
- Donzowa, J., Perrotta, D., & Zagheni, E. (2023). Assessing self-selection biases in online surveys: evidence from the COVID-19 Health Behavior Survey. https://doi.org/10.4054/MPIDR-WP-2023-047
- Fan, C. A., Upham, M., Beaver, K., Dashtestani, K., Skiby, M. M., Pentel, K. Z., Rhew, I. C., Kauth, M. R., Shipherd, J. C., Kaysen, D., Simpson, T., & Lehavot, K. (2023). Recruiting Sexual and Gender Minority Veterans for Health Disparities Research: Recruitment Protocol of a Web-Based Prospective Cohort Study. JMIR Research Protocols, 12, e43824. https://doi.org/10.2196/43824
- González, S. K., & Grov, C. (2022). Recruiting young women of color into a pilot RCT targeting sexual health: Lessons learned and implications for applied health technology research. Journal of American College Health : J of ACH, 70(1), 305–313. https://doi.org/10.1080/07448481.2020.1746663
- Graham, M. H., & Yair, O. (2025). Less Partisan but No More Competent: Expressive Responding and Fact-Opinion Discernment. Public Opinion Quarterly, 89(1), 7–30. https://doi.org/10.1093/poq/nfaf008
- Griffin, M., Martino, R. J., LoSchiavo, C., Comer-Carruthers, C., Krause, K. D., Stults, C. B., & Halkitis, P. N. (2022). Ensuring survey research data integrity in the era of internet bots. Quality & Quantity, 56(4), 2841–2852. https://doi.org/10.1007/s11135-021-01252-1
- Groves, R. M., Singer, E., & Corning, A. (2000). Leverage-Saliency Theory of Survey Participation: Description and an Illustration. The Public Opinion Quarterly, 64(3), 299–308. http://www.jstor.org/stable/3078721.
- Hebel, A., Weiß, B., & Pötzschke, S. (2025). Is an image worth a thousand respondents? The relationship between ad images, ad performance, and sample composition in social media recruitment. https://doi.org/10.31219/osf.io/af3nr_v2
- Higgins, S. F., Mulvenna, M. D., Bond, R. B., McCartan, A., Gallagher, S., & Quinn, D. (2018). Multivariate Testing Confirms the Effect of Age-Gender Congruence on Click-Through Rates from Online Social Network Digital Advertisements. Cyberpsychology, Behavior and Social Networking, 21(10), 646–654. https://doi.org/10.1089/cyber.2018.0197
- Höhne, J. K., Claassen, J., Kühne, S., & Zindel, Z. (2025). Social media ads for survey recruitment: Performance, costs, user engagement. International Journal of Market Research, 0(0). https://doi.org/10.1177/14707853251367805
- Ichimiya, M., Muller-Tabanera, H., Cantrell, J., Bingenheimer, J. B., Gerard, R., Hair, E. C., Donati, D., Rao, N., & Evans, W. D. (2023). Evaluation of response to incentive recruitment strategies in a social media-based survey. Digital Health, 9, 20552076231178430. https://doi.org/10.1177/20552076231178430
- Kim, Y., Dykema, J., Stevenson, J., Black, P., & Moberg, D. P. (2019). Straightlining: Overview of Measurement, Comparison of Indicators, and Effects in Mail–Web Mixed-Mode Surveys. Social Science Computer Review, 37(2), 214–233. https://doi.org/10.1177/0894439317752406
- Krosnick, J. A. (1991). Response strategies for coping with the cognitive demands of attitude measures in surveys. Applied Cognitive Psychology, 5(3), 213–236. https://doi.org/10.1002/acp.2350050305
- Kühne, S., & Zindel, Z. (2020). Using Facebook and Instagram to Recruit Web Survey Participants: A Step-by-Step Guide and Application. Survey Methods: Insights from the Field. Advance online publication. https://doi.org/10.13094/SMIF-2020-00017
- Leiner, D. J. (2019). Too Fast, too Straight, too Weird: Non-Reactive Indicators for Meaningless Data in Internet Surveys. Survey Research Methods, 13(3), 229–248. https://doi.org/10.18148/srm/2019.v13i3.7403
- Maslovskaya, O., Durrant, G. B., Smith, P. W., Hanson, T., & Villar, A. (2019). What are the Characteristics of Respondents using Different Devices in Mixed‐device Online Surveys? Evidence from Six UK Surveys. International Statistical Review, 87(2), 326–346. https://doi.org/10.1111/insr.12311
- Meade, A. W., & Craig, S. B. (2012). Identifying careless responses in survey data. Psychological Methods, 17(3), 437–455. https://doi.org/10.1037/a0028085
- Meta. (n.d.). Learning Phase (Business Help Center). Meta. https://www.facebook.com/business/help/411605549765586
- Meta. (2021, November 9). Removing Certain Ad Targeting Options and Expanding Our Ad Controls [Press release]. https://www.facebook.com/business/news/removing-certain-ad-targeting-options-and-expanding-our-ad-controls
- Mundel, J., & Yang, J. (2022). Hispanics’ Response to Ethnic Targeting Ads for Unhealthy Products: Examining the Roles of Endorser Identification and Endorser–Product Matchup. Journal of Interactive Advertising, 22(1), 28–41. https://doi.org/10.1080/15252019.2021.2014371
- Nesoff, E. D., Palamar, J. J., Li, Q., Li, W., & Martins, S. S. (2025). Challenging the Continued Usefulness of Social Media Recruitment for Surveys of Hidden Populations of People Who Use Opioids. Journal of Medical Internet Research, 27, e63687. https://doi.org/10.2196/63687
- Pechmann, C., Phillips, C., Calder, D., & Prochaska, J. J. (2020). Facebook Recruitment Using Zip Codes to Improve Diversity in Health Research: Longitudinal Observational Study. Journal of Medical Internet Research, 22(6), e17554. https://doi.org/10.2196/17554
- Pötzschke, S., & Braun, M. (2017). Migrant Sampling Using Facebook Advertisements. Social Science Computer Review, 35(5), 633–653. https://doi.org/10.1177/0894439316666262
- Ribeiro, F. N., Saha, K., Babaei, M., Henrique, L., Messias, J., Benevenuto, F., Goga, O., Gummadi, K. P., & Redmiles, E. M. (2019). On Microtargeting Socially Divisive Ads. In Proceedings of the Conference on Fairness, Accountability, and Transparency (pp. 140–149). ACM. https://doi.org/10.1145/3287560.3287580
- Roßmann, J. (2015). RSPEEDINDEX: Stata module to compute a response speed index and perform outlier identification. Statistical Software Components, Boston College Department of Economics. https://ideas.repec.org/c/boc/bocode/s458007.html
- Roßmann, J. (2017). RESPDIFF: Stata module for generating response differentiation indices. Statistical Software Components, Boston College Department of Economics. https://ideas.repec.org/c/boc/bocode/s458315.html
- Sabir, A., Lafontaine, E., & Das, A. (2022). Analyzing the Impact and Accuracy of Facebook Activity on Facebook’s Ad-Interest Inference Process. Proceedings of the ACM on Human-Computer Interaction, 6(CSCW1), 1–34. https://doi.org/10.1145/3512923
- Salikutluk, Z., Krieger, M., Kühne, S., Zindel, Z., Masghina, R., & Scheffler, B. (2022). Kopftuch und Arbeit? Erfahrungen von Musliminnen und Muslimen auf dem deutschen Arbeitsmarkt. (DeZIMinutes). https://www.dezim-institut.de/fileadmin/user_upload/Demo_FIS/publikation_pdf/FA-5433.pdf
- Sapiezynski, P., Kaplan, L., Mislove, A., & Korolova, A. (2024). On the Use of Proxies in Political Ad Targeting. Proceedings of the ACM on Human-Computer Interaction, 8(CSCW2), 1–31. https://doi.org/10.1145/3686917
- Schlosser, S., & Mays, A. (2018). Mobile and Dirty. Social Science Computer Review, 36(2), 212–230. https://doi.org/10.1177/0894439317698437
- Singer, E., & Couper, M. P. (2017). Some Methodological Uses of Responses to Open Questions and Other Verbatim Comments in Quantitative Surveys. Method, Data, Analyses, 11(2), 115–134. https://doi.org/10.12758/mda.2017.01
- Soehl, T., Chen, Z., & Erlich, A. (2024). Promises and Limits of Using Targeted Social Media Advertising to Sample Global Migrant Populations: Nigerians at Home and Abroad. Sociological Methods & Research, 0(0). https://doi.org/10.1177/00491241241266634
- Stern, M. J., Fordyce, E., Carpenter, R., Viox, M. H., Michaels, S., Harper, C., Johns, M. M., & Dunville, R. (2022). Evaluating the Data Quality of a National Sample of Young Sexual and Gender Minorities Recruited Using Social Media: The Influence of Different Design Formats. Social Science Computer Review, 40(3), 663–677. https://doi.org/10.1177/0894439320928240
- Teitcher, J. E. F., Bockting, W. O., Bauermeister, J. A., Hoefer, C. J., Miner, M. H., & Klitzman, R. L. (2015). Detecting, preventing, and responding to “fraudsters” in internet research: Ethics and tradeoffs. The Journal of Law, Medicine & Ethics : A Journal of the American Society of Law, Medicine & Ethics, 43(1), 116–133. https://doi.org/10.1111/jlme.12200
- Tourangeau, R., Rips, L. J., & Rasinski, K. (2012). The Psychology of Survey Response. Cambridge University Press. https://doi.org/10.1017/CBO9780511819322
- Tsai, W., Zavala, D., & Gomez, S. (2019). Using the Facebook Advertisement Platform to Recruit Chinese, Korean, and Latinx Cancer Survivors for Psychosocial Research: Web-Based Survey Study. Journal of Medical Internet Research, 21(1), e11571. https://doi.org/10.2196/11571
- Ulitzsch, E., Pohl, S., Khorramdel, L., Kroehne, U., & Davier, M. von (2024). Using Response Times for Joint Modeling of Careless Responding and Attentive Response Styles. Journal of Educational and Behavioral Statistics, 49(2), 173–206. https://doi.org/10.3102/10769986231173607
- Vargo, C. J., & Hopp, T. (2020). Fear, Anger, and Political Advertisement Engagement: A Computational Case Study of Russian-Linked Facebook and Instagram Content. Journalism & Mass Communication Quarterly, 97(3), 743–761. https://doi.org/10.1177/1077699020911884
- Waling, A., Lyons, A., Alba, B., Minichiello, V., Barrett, C., Hughes, M., & Fredriksen-Goldsen, K. (2022). Recruiting stigmatised populations and managing negative commentary via social media: a case study of recruiting older LGBTI research participants in Australia. International Journal of Social Research Methodology, 25(2), 157–170. https://doi.org/10.1080/13645579.2020.1863545
- Ward, M. K., & Meade, A. W. (2023). Dealing with Careless Responding in Survey Data: Prevention, Identification, and Recommended Best Practices. Annual Review of Psychology, 74, 577–596. https://doi.org/10.1146/annurev-psych-040422-045007
- Yair, O., & Huber, G. A. (2021). How Robust Is Evidence of Partisan Perceptual Bias in Survey Responses? Public Opinion Quarterly, 84(2), 469–492. https://doi.org/10.1093/poq/nfaa024
- Zindel, Z. (2023). Social Media Recruitment in Online Survey Research: A Systematic Literature Review. Methods, Data, Analyses, 17(2), 207–248. https://doi.org/10.12758/mda.2022.15
- Zindel, Z., Kühne, S., Perrotta, D., & Zagheni, E. (2025). Ad images in social media survey recruitment: what they see is what we get. International Journal of Social Research Methodology, 1–20. https://doi.org/10.1080/13645579.2025.2597303
-
Keywords
calibration CATI coverage coverage bias cross-national surveys data linkage data quality European Social Survey experiment face-to-face face-to-face survey Facebook hard to reach populations incentives item nonresponse measurement measurement error mixed-mode surveys multitasking non-probability samples Nonresponse nonresponse bias nonresponse rates paradata PIAAC Probability sample probability samples QR codes rare populations response rate Satisficing social desirability Social media survey survey-taking climate survey data survey management survey methods Telephone survey telephone surveys total survey error unit nonresponse validity web survey Web surveys weighting
