

Comparing the ‘Most Important Problem’ Measure of Issue Salience and Google Trends: Methodological Lessons from the Field
Julia Weiss  GESIS-Leibniz Institute for the Social Sciences, Germany
Barbara Binder GESIS-Leibniz Institute for the Social Sciences, Germany
Weiss, J. & Binder, B. (2026). Comparing the ‘Most Important Problem’ Measure of Issue Salience and Google Trends: Methodological Lessons from the Field. Survey Methods: Insights from the Field. Retrieved from https://surveyinsights.org/?p=21902
© the authors 2026. This work is licensed under a Creative Commons Attribution 4.0 International License (CC BY 4.0) 
Abstract
Survey-based measures such as the ‘most important political problem’ (MIP) question are a central tool for studying public issue salience, but they are costly to field frequently and provide only temporally sparse snapshots. Digital trace data, e.g. Google Trends, are therefore increasingly discussed as a low-cost, high-frequency alternative or complement. However, systematic evidence on how closely search data align with survey-based measures remains limited. This paper presents a methodological comparison of survey-reported issue salience and Google search interest using German Longitudinal Election Study (GLES) surveys and matching Google Trends data from the same field periods. We document a comprehensive procedure for mapping coded open-ended MIP responses to Google Trends topics, highlighting practical challenges related to topic availability, scaling, and cross-topic comparability. The results reveal a pronounced mismatch between survey priorities and search interest. Within the observed field periods, issues that dominate MIP responses rank comparatively low in Google Trends, while search interest is primarily concentrated on short-term, event-related topics. These findings indicate that Google Trends cannot serve as a proxy for survey-based MIP measures. At the same time, the divergence suggests that surveys and digital trace data capture distinct dimensions of public attention, pointing to their complementary use in survey research.
Keywords
digital trace data, google trends, issue salience measurement, measurement, most important political problem
Copyright
© the authors 2026. This work is licensed under a Creative Commons Attribution 4.0 International License (CC BY 4.0)
Introduction
Issue salience is a central concept in survey-based public opinion research, as it shapes how citizens interpret political conflicts, evaluate parties and governments, and orient their political behaviour (Dennison, 2019). The main instrument for measuring salience in empirical research is the survey-based ‘most important problem’ (MIP) question. Yet relying on this measure poses well-known challenges. Surveys capture only momentary snapshots, are costly to field frequently, and increasingly face declining participation, social selectivity and difficulties in reaching marginalized groups (Keusch, 2015; Cornesse et al., 2020; Jabkowski and Cichocki, 2025). These limitations restrict our ability to observe how public priorities evolve and to capture the full breadth of politically relevant concerns. From a survey methodological perspective, these limitations raise the question of whether alternative data sources can meaningfully extend or complement established survey instruments.
At the same time, digital trace data offer new opportunities to observe public attention in real time. Web search data may indicate what issues people are currently concerned about. Unlike survey measures, Google Trends provides daily, low-cost data on search interest. Given that Google accounts for around 90 percent of all searches in Germany, including 96 percent of mobile searches in October 2023 (Statcounter 2024), Google Trends is frequently discussed as a potential proxy for online information-seeking behaviour (e.g. Mellon, 2013; Chykina and Crabtree, 2018), although its suitability for measuring survey-based constructs remains contested (e.g. Franzén, 2023; Hölzl, Keusch and Sajons, 2025). This study examines how such digital indicators relate to survey-based measures of issue salience in Germany. Rather than addressing substantive changes in issue salience, this study reports methodological insights from a systematic comparison of a standard survey-based measure and digital trace data collected during the same field periods. Using the German Longitudinal Election Study (GLES), we compare coded open-ended MIP responses with corresponding Google search interests during the same field phase. Our key question is whether the most frequently reported issues in the GLES also rank among the most searched issues on Google.
By comparing both data sources, we assess to what extent digital trace data can complement traditional surveys in monitoring public concerns. The paper proceeds with a literature review, data and methods, results, and implications for survey practice and the integration of digital trace data into survey research.
State-of-the-art
Recent research across disciplines illustrates the potential of Google Trends data to capture collective attention and public meaning-making processes. In economics, such data have been used to trace shifts in unemployment and consumption patterns, while in political science they inform analyses of protest dynamics and information seeking during election campaigns (Woo and Owen, 2019; Simionescu and Cifuentes-Faura, 2022; Timoneda and Wibbels, 2022; Behnert, Lajic and Bauer, 2024). Studies linking search data with political advertising further reveal how media exposure translates into heightened public engagement (Housholder, Watson and LoRusso, 2018). In public health and tourism, Google Trends has served as a proxy for collective sentiment and mobility, particularly during the COVID-19 pandemic (Brodeur et al., 2021; Havranek and Zeynalov, 2021). Beyond these domains, analyses of aggregated search patterns have shed light on broader sociocultural phenomena, such as the public resonance of human rights discourse and shifts in attention with authoritarian contexts (Cunha, Schuler and Williamson, 2022; Dancy and Fariss, 2024). From a survey methodological perspective, these applications demonstrate the analytical potential of Google Trends, but they also highlight that most existing studies focus on substantive outcomes rather than on measurement comparability with established survey instruments.
Previous research has examined the potential of Google Trends data to capture political issue salience. Compared to surveys, search data offer advantages of low cost, global coverage, and high temporal resolution (Mellon, 2013). These properties have been used to trace fluctuations in public attention and to compare digital indicators with traditional measures such as Gallup’s ‘most important problem’ question. Mellon’s (2014) analysis, based on U.S. data (2004–2010) combining weekly Google Trends indices with survey-based measures of issue salience from Gallup’s ‘most important problem’ question, applied a systematic time-series validation strategy to assess the correspondence between both data sources. His findings showed that search data reliably mirrored salience only for a limited set of issues, particularly those that were clearly defined and likely to trigger information-seeking behavior, such as the economy, immigration, and terrorism. At the same time, many issues could not be adequately captured due to ambiguous or heterogeneous search behavior, underscoring that the validity of Google Trends as a measure of issue salience was conditional on careful query design and issue characteristics. Further studies combined Google Trends with survey data to explore reciprocal agenda-setting processes between media and public attention (Lee, Kim and Scheufele, 2016). Recent work also highlights its utility for capturing concerns among hard-to-survey populations, particularly around immigration and deportation policies (Chykina and Crabtree, 2018). Overall, these findings underscore the promises and limitations of digital trace data for studying the dynamics of political salience.
While these studies demonstrate the versatility of Google Trends data, they have also prompted debates about its usability and methodological limits. In addition to longstanding concerns about representativeness, conceptual validity and the interpretation of search behaviour as an indicator of public opinion (e.g. Mellon, 2014; Hölzl, Keusch and Sajons, 2025), recent contributions extend these critiques to the internal properties of Google Trends data itself, particularly with regard to transparency, reliability and reproducibility. A central issue is that Google Trends relies on an opaque sampling procedure and provides no information about sample size or uncertainty measures, which makes it difficult to assess sampling variability and measurement error (Hölzl, Keusch and Sajons, 2025). Franzén (2023) for example, reports substantial inconsistencies in Google Trends outputs for identical queries for the same time and location, raising doubts about the reliability of the data. In response, Raubenheimer (2023) argues that these discrepancies largely result from Google’s sampling and scaling procedures, as well as characteristics of search terms and country size. Complementing this argument, Behnen et al. (2020) provide experimental evidence that inconsistencies in Google Trends data are systematic and particularly pronounced for short time spans and low-volume queries, where repeated requests may even produce contradictory trend patterns. Further methodological evidence suggest that such inconsistencies are not evenly distributed across all applications of Google Trends. Instead, reliability problems tend to be more pronounced for low-frequency search terms, small regions/countries, and contexts with low internet penetration, implying that the usability of Google Trends data is conditional on both the search term and the size of the underlying search market (Hölzl, Keusch and Sajons, 2025).
This pattern is further supported by recent empirical work indicating a reliability-frequency continuum, where Google Trends time series appear substantially more stable for high-frequency search terms, whereas low-frequency terms exhibit markedly higher between-sample variation and less consistent identification of distribution maxima (Gummer and Oehrlein, 2025). At the same time, even high-frequency terms are not entirely free from instability, reinforcing the need for repeated retrieval and aggregation strategies as a robustness measure (Gummer and Oehrlein, 2025). Beyond sample instability, Google Trends introduces additional methodological complications through its scaling and normalization procedures. Since the platform provides only relative indices scaled to the maximum value within the selected time frame and region, comparisons across time and across regions cannot be made simultaneously without further adjustments (Hölzl, Keusch and Sajons, 2025). Moreover, measurement outcomes depend strongly on query design choices, including spelling variants, accents, quotation marks, and the distinction between “search terms” and “topics.” These features can lead to substantively different time series even when researchers aim to capture the same underlying concept (Mavragani, Ochoa and Tsagarakis, 2018; Hölzl, Keusch and Sajons, 2025). Together, these studies show that while Google Trends can be useful, it requires careful methodological handling and transparent documentation. For survey researchers, these debates raise fundamental questions about transparency, replicability, and the conditions under which Google Trends data can be meaningfully integrated into survey-based research designs.
Beyond the growing literature on digital trace data, it is equally important to consider the long-standing debates surrounding survey-based measures of issue salience. The ‘most important problem’ (MIP) question has long served as a standard instrument in survey-based measurement of issue salience and as a foundation for studies of issue voting and party competence (Rabinowitz, Prothro and Jacoby, 1982; Giger and Lefkofridi, 2014; Dennison, 2020).
Yet, its methodological limitations are well known, as respondents are typically asked to name only the most important problem (in some surveys followed by separate questions on the second most important problem), thereby capturing relative prioritization rather than a comprehensive assessment of all salient concerns. Moreover, the MIP may reflect perceptions of societal rather than personal importance (Miller, Krosnick and Fabrigar, 2017; Hanretty, Lauderdale and Vivyan, 2020). At the aggregate level, however, the distribution of issues mentioned in MIP responses often corresponds to other survey-based measures of issue importance, such as ratings of predefined issues, indicating that MIP measures capture meaningful patterns of collective attention (Bartle and Laycock, 2012; Dennison, 2019).
Alternative survey measures ask respondents to rate the importance of several predefined issues, providing a broader view of perceived salience (Johns, 2010; Züll and Menold, 2019). Yet such closed formats risk inducing or constraining responses and may overrepresent media-driven topics. Open-ended questions, while cognitively more demanding (Züll and Menold, 2019), remain indispensable when the aim is to capture spontaneous and freely expressed issue perceptions. These long-standing methodological tensions underscore that issue salience is not a single, fixed construct but depends strongly on how it is measured. This measurement dependency poses particular challenges when survey-based indicators are compared with alternative data sources that rely on fundamentally different behavioural traces. While survey responses reflect prompted, momentary assessments that may be shaped by recall processes and social desirability considerations, digital trace data such as Google search behavior capture unprompted, situational information-seeking activities. What remains largely unexamined is how coded open-ended MIP responses can be methodologically aligned with Google Trends data collected during the same survey field periods, and what such alignment implies for survey-based measurement of issue salience.
Research design and data
Our aim is to assess whether coded open-ended MIP responses from the GLES can be meaningfully aligned with Google Trends data collected during the same field periods. While this question relates closely to earlier work, for example, by Mellon (2013, 2014), our study differs in both analytical focus and methodological design. Rather than validating selected search queries against long survey time series, we examine the practical comparability of two data sources within identical survey windows in the German context. Specifically, we compare the rank order of all coded MIP categories with the relative ranking of matched Google Trends topics. This design allows us to evaluate whether Google Trends captures the same issue priorities as survey-based MIP measures and, more broadly, what its scope and limits are as a complement to established survey instruments. In the following, we will shortly introduce the used survey data and elaborate on the scraping of matching search interest in political issues from Google Trends.
Survey data: Coded MIPs from the GLES
We use responses to the MIP question from two surveys, allowing for comparisons with Google Trends data for two time windows, namely the GLES Panel and GLES Tracking. The GLES Panel is a web-based longitudinal survey focusing on changes in political attitudes and behaviours. We use wave 25, collected from 11.10.-24.10.2023 and a total of 10.030 respondents (GLES, 2024b).
GLES Tracking is based on multiple cross-sections surveyed at regular intervals each calendar year and geared towards investigating public opinion and its changes between federal elections (Schmitt-Beck et al., 2010). We use the T56 survey, which took place from 8.11.-15.11.2023 and a total of 1.118 respondents (GLES, 2024c). Both surveys are based on quota-based samples from an online access panel.
Both surveys include the question on the most important political problem (MIP) and use the same scheme of topics to code the open responses of respondents (GLES, 2024a). The original question in the surveys was: ‘Was ist Ihrer Meinung nach gegenwärtig das wichtigste politische Problem in Deutschland? Nennen Sie bitte nur ein einziges Problem.‘ [Translated: In your opinion, what is currently the most important political problem in Germany? Please name only one problem.].
The inclusion of both the GLES Panel and the GLES Tracking serves to assess whether the observed relationship between survey-based MIP measures and Google Trends holds across two different survey settings and adjacent field periods, thereby providing a robustness check for our methodological argument.
Google Trends data: Search interest in topics matching the MIPs
Google Trends is a freely accessible service that allows users to track search interest for specific topics across time and regions (Google News Initiative, 2026). Although Google offers no official API, R and Python packages enable API-like data collection, but they can be temporarily unavailable, as also occurred during our field phase. We therefore used the R package ‘gtrendsR’ by Massicotte and Eddelbuettel (2022), and retrieved data manually via the Google Trends website when automated collection failed.
Google Trends data is a random, unbiased sample of Google searches (Google News Initiative, 2026), which is indexed and normalized. The provided data are relative search volumes (RSVs), calculated by dividing the total number of queries for a keyword by the overall Google queries within the specified period (see also Gummer and Oehrlein (2023)). These values are then normalized for the specified time frame and location, with the highest value set at 100 and other values scaled proportionally. Interpretation of RSVs follows a logic where a value of 50 indicates 50% less search interest compared to the peak point, which has an RSV of 100.
Furthermore, Google Trends generates time series with different temporal granularities depending on the query timeframe. While all Google Trends data are normalized on a scale from 0 to 100, queries covering the last seven days return hourly RSV data, whereas longer timeframes yield RSV data aggregated at the daily level. To preserve short-term dynamics in public search behavior while accounting for known sampling variability and reproducibility issues in Google Trends data, we repeatedly retrieved hourly data for the same Google Trends query on each day throughout the field phases of both surveys using automated daily retrieval scripts, for each MIP. These scripts were scheduled to run at the same time each day, while manual downloads were performed whenever automated retrieval temporarily failed; all files were time-stamped and stored separately. Because these repeated retrievals generated overlapping real-time observations for the same calendar dates, we harmonized all observations to the daily level and aggregated them using the arithmetic mean to reduce fluctuations resulting from Google Trends’ underlying sampling procedures. This procedure resulted in a continuous daily Google Trends time series for each topic used in the analysis. The full dataset as well as replication files for the data aggregation procedure are available on the OSF: https://osf.io/se3u9 .
The structure of RSVs makes cross-comparison across different queries challenging. Google states that search terms with low volume appear as 0 for a given time period, and rare keywords may skew results. In addition, Google Trends excludes repeated searches from the same user over short period of time (Google News Initiative, 2026). Details on definitions or thresholds are not available.
Google Trends displays search interest in ‘search terms’ and ‘topics’. Topics are considered to be more reliable as they pull in the exact phrase as well as misspellings and acronyms and cover all languages (Google News Initiative, 2026). Besides misspellings, acronyms, and other languages, topics do not include substantially different searches. We do not have information on the exact alternative spellings of the search term that have been included by Google but chose this strategy instead of manually including all types of necessary variations, which again could introduce bias. By default, Google Trends suggests topics when users type in search terms in the Trends Explore tool (Google News Initiative, 2026).
To compare search interest in political issues with the frequency of MIPs identified by respondents in the surveys, we defined matching ‘topics’ available on Google Trends.
Table 1 provides an overview of all MIP codes and their corresponding Google Trends (GT) topics (see Table A1 in the appendix for the German original). The selection of GT topics followed a hierarchical and standardized procedure. First, whenever available, we used GT topics that directly matched the titles of the MIP codes as defined in the GLES codebook. Second, if no such topic existed, we relied on closely related keywords derived from the codebook descriptions to identify suitable GT topics. Third, if neither approach yielded an available and retrievable GT topic, we used the most frequently occurring words in the open-ended survey responses associated with the respective MIP code. This stepwise approach balances conceptual validity (by prioritizing code-based definitions) and empirical feasibility (by ensuring that GT topics are available and yield stable time series). Superscripts in table 1 indicate the basis on which each GT topic was selected and table A2 in the appendix provides a detailed overview of the decision basis for each mapping.
For comparability, we relied exclusively on GT topics (and not on search terms). While topics aggregate different query variants referring to the same underlying concept, their use is particularly advantageous in our context, as it allows us to align conceptually defined MIP categories with broader patterns of search behavior. In contrast, using search terms would require specifying multiple alternative expressions for each category, thereby introducing additional researcher decisions and potential inconsistencies across topics. In addition, Google recommends that topics should only be compared with other topics, and search terms with other search terms (Google News Initiative, 2026). Not all terms exist as topics, but Google Trends provides a list of ‘topics’ which may fit the query.
In some cases, multiple MIP codes were consolidated into a single GT topic (e.g., the MIP codes ‘Party criticism, general’ and ‘Party criticism, specific’ were combined into the GT topic ‘Party system’) due to insufficiently distinct GT topics for each individual code. Conversely, there were instances where multiple suitable GT topics corresponded to a single MIP code (e.g., the MIP code ‘Price Level’ matched with the Google Trends topics ‘Price Level’, ‘Inflation’, and ‘Deflation’). In these cases, a weighted average was calculated matching the frequency of these words in the survey responses post-field phase.
Data on all identified GT topics was collected for the period of the field phase for Germany, specifying no particular category of searches and using the default search type ‘Web Search’. Other search types are YouTube search, image search, Google News, and Google Shopping. These are discrete datasets without overlap. Instead of all categories, it is possible to use categories to consider search context, e.g. `politics’. This way, the data reflect searches for topics in this particular context. However, we deliberately refrained from applying such filters, as Google provides only limited documentation on how searches are assigned to categories or how these subsets are constructed (Google News Initiative, 2026). The data only includes search interest in the matching GT topics, all other web searches are excluded.
Several peculiarities arose when matching MIP codes with GT topics. Some MIP codes lacked corresponding topics (e.g., ‘Germany’s relations with the USA’), and one topic (‘Education’) ceased to yield data during the collection period and was therefore excluded. Additionally, the topic ‘School’, used for the MIP code School Policy, proved unsuitable, as it dominated the results without a corresponding trend in the survey data or any external developments to explain this prominence. It is likely that most searches for ‘School’ reflect everyday interests rather than politically motivated queries. Consequently, this topic and code were excluded from the final analysis.
Table 1. Table of MIP Codes and matching Google Trends Topics (English translations)
| MIP Code | Google Trends Topics |
|---|---|
| Election campaign and government formation | Government a) |
| Political structures and processes | Election; Election promises; Opposition (Politics) |
| Values, political culture and social criticism | Political Culture |
| Democracy | Direct democracy (form of government) |
| Media | Social Media; Freedom of the press |
| Bureaucracy | Bureaucracy |
| Lobbying | Lobbying |
| Corruption | Corruption; Political Corruption |
| Disenchantment with politics | Disenchantment with politics |
| Criticism of Political Parties, general | Party system |
| Criticism of Politicians, general | Politician (profession) |
| Populism | Populism (political ideology) |
| Domestic security | Internal security; Domestic policy |
| Crime and violence | Violence |
| Terrorism | Combating terrorism |
| Radicalization and extremism | Radicalization; Extremism |
| Law and justice | Law; Legislation |
| Foreign policy | Foreign policy |
| Europe and the European Union | European Union |
| International conflicts and peace | War |
| Defense | Security policy |
| Social policy | Social policy |
| Social justice | Distributive justice |
| Poverty | Poverty |
| Labor market policy | Labor market |
| Unemployment and basic income support | Unemployment |
| Wage policy | Minimum wage |
| Pensions and demographic change | Retirement age; Retirement provision |
| Immigration and Integration | Immigration |
| Health policy | Health policy |
| Care | Nursing home |
| Corona pandemic | Coronavirus (Virus) |
| Family policy | Family |
| Equality | Gender equality |
| Education policy | Education b) |
| School policy | School c) |
| Energy policy | Energy policy; Energy; Electricity price |
| Environmental policy | Environmental policy; Environmental protection |
| Climate policy | Climate protection |
| Natural disasters | Earthquake (disaster); Disaster |
| Economic policy | Economy |
| Price level | Price level; Inflation; Deflation |
| Infrastructure | Infrastructure |
| Digital infrastructure | Digitization |
| Transport policy | Road traffic |
| Housing policy | Affordable housing |
| Financial policy | Finances a) |
| Tax policy | Tax |
| East Germany | East |
Note: All GT topics were derived from GLES MIP code titles or codebook descriptions unless indicated otherwise by superscript a), which indicates that GT topic were derived from most frequent words in open-ended survey responses. b) GT topic ceased to yield data during the collection period and was therefore excluded c) GT topic excluded due to disproportionate dominance not reflected in survey data or external developments. Appendix A1 corresponds to this table but is in German. MIP codes with multiple rows of matching GT topics are the MIPs where multiple GT topics were identified as suitable. Multiple rows of MIP codes matching only one GT topic are the cases in which multiple MIP codes were consolidated into a single GT topic.
Because Google Trends allows the comparison of only up to five terms at a time, we included the anchor topic “Dance” in each query and expressed search interest in each political issue relative to the search interest in the anchor topic. More specifically, for each day and topic, we computed the ratio of the focal topic’s search volume to the anchor topic’s search volume. This ratio-based transformation is invariant to the query-specific rescaling of Google Trends and therefore allows comparison across separately retrieved topic sets. When selecting the anchor topic, several factors were considered: stability of search frequency, absence from the study’s topic codes, and moderate popularity to prevent dominance over the study’s topics. While some practical guidelines recommend selecting a benchmark term that consistently attains the maximum RSV within each query (e.g. Fowle, 2020), this condition is not strictly necessary when using ratio-based normalization. Instead, the anchor serves as a common reference point that allows relative differences in search interest to be recovered across queries. Various topics were tested on the basis of these criteria, each time in combination with four highly prominent topics from the GLES Codebook, namely ‘climate change’ (‘Klimawandel’), ‘inflation’ (‘Inflation’), ‘poverty’ (‘Armut’) and ‘economy’ (‘Wirtschaft’). During this process, it became apparent that terms related to consumption (e.g. ‘Amazon Prime’) exhibited considerable fluctuations and were thus unsuitable. Global terms such as ‘medicine’ or ‘language’ exhibited disproportionally high search volumes compared to the political issues of interest. Ultimately, the topic ‘Dance’ was selected as the anchor and its search volume was then used as a reference value (see Figure 1).
Figure 1. Screenshot of the Google Trends tool comparing the selected anchor topic (‘Dance’) with five frequently mentioned topics in the GLES survey data
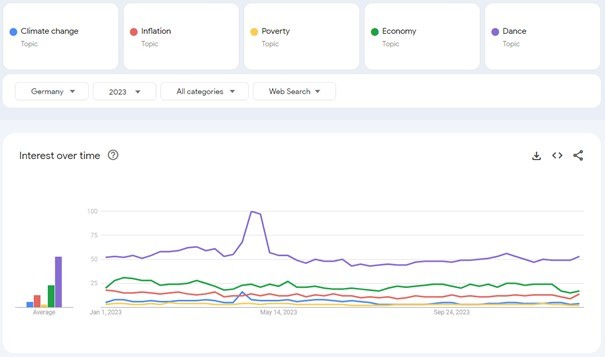
Note: Screenshot obtained from Google Trends Explore (trends.google.com/trends/explore) on October 6, 2023.
The RSV value of a given political issue was subtracted from the RSV value of ‘Dance’, yielding a standardized measure of relative search interest, ensuring comparability across all political topics.
To derive the relative importance of topics shown in Figures 2 and 3, we applied a multi-step normalization and aggregation procedure. First, for each topic and day, we calculated ratios relative to the anchor topic “Dance.” These daily values were then normalized across all topics within each day using min-max normalization. Based on these normalized values, we computed each topic’s daily share by dividing the normalized value of a topic by the sum of normalized values across all topics on that day. These daily shares were then aggregated across the respective field period and rescaled to sum to one, yielding each topic’s proportion in all searched topics. When multiple Google Trends topics corresponded to one MIP category, they were aggregated beforehand using either simple or weighted averages. Finally, the Google Trends search interest in political problems for the respective time window was merged to the survey data.
Results and discussion
Figure 2 illustrates on the left-hand side the ten most frequently mentioned issues by respondents in the GLES Panel data. Immigration and Integration is by far the most frequently mentioned issue, with about 50% of respondents citing it as the most important political problem. Climate Policy and Price Level follow at a significant distance in second and third place, respectively. Comparing this with the top 10 political issues in form of topics searched on Google during the survey period (figure 2, right-hand side), a completely different pattern emerges. None of the top three issues from the survey appear in the top ranks among the matched political issues in the Google Trends data. Additionally, there is no comparably strong dominance of one topic as is the case in the survey data. The most frequently searched topics during the field phase were War, Coronavirus (Virus), and Tax. In fact, there are only two issues that appear in the top 10 of both data sets, namely Energy Policy/Energy, Energy Policy, and Electricity Price, and Economic Policy/Economy.
Figure 2. Comparative presentation of the top 10 topics in the GLES Panel data (Survey Data) and Google Trends Data
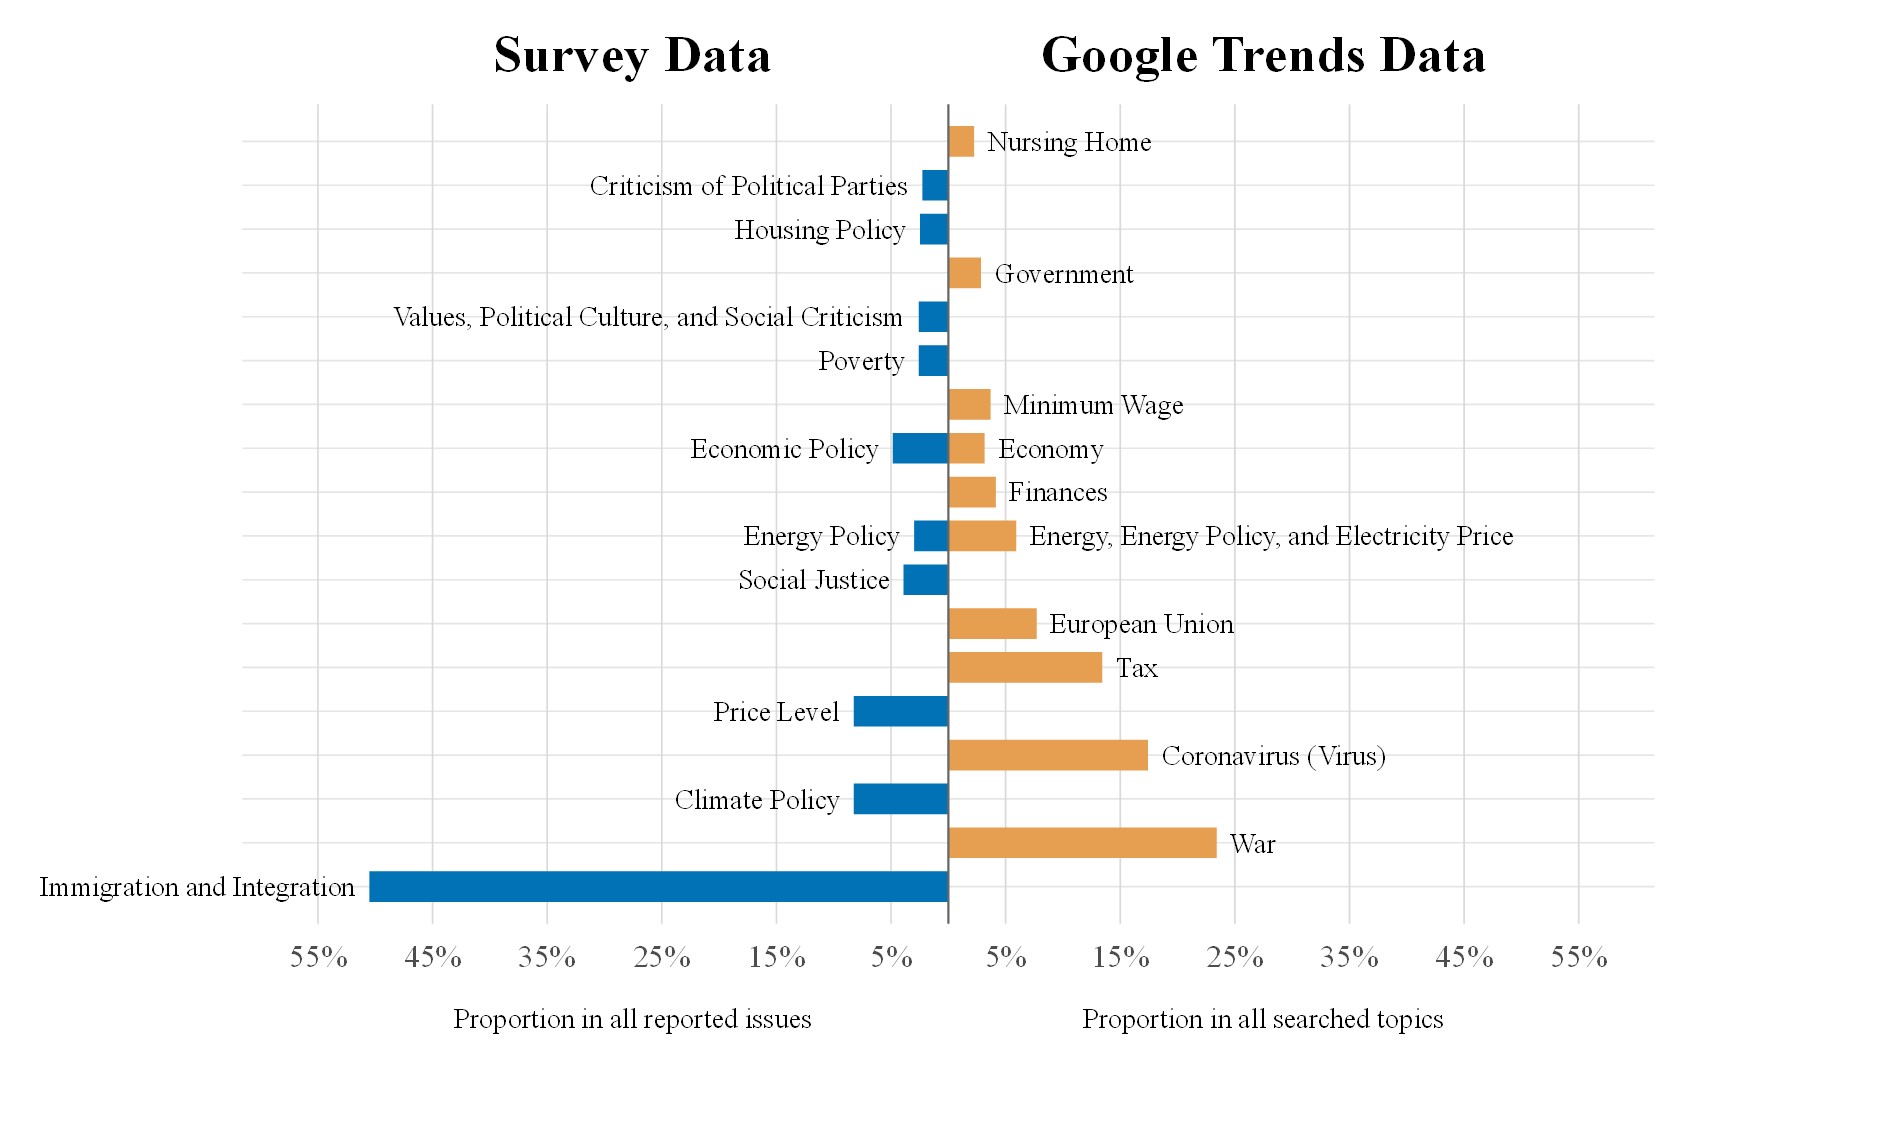
Note: Survey Data: GLES Panel Data, Wave 25 (ZA7731). Google Trends Data: aggregated real-time data. Field period for both data types: 11.10.-24.10.2023.
A very similar pattern is observed in the GLES Tracking survey (figure 3, left-hand side). Nearly 50% of respondents identified Immigration and Integration as the primary issue. In second place, with just over 10% of responses, is Price Level, followed by Climate Policy in third place. Looking at the search interest of the same political issues during this period (see figure 3, right-hand side), none of the top three issues from the GLES Tracking appear in the top ranks in the GT data. Instead, again, the most frequently searched topics during the survey period were Coronavirus (Virus), followed by Tax and War.
Figure 3. Comparative presentation of the top 10 topics in the GLES Tracking data (Survey Data) and Google Trends Data
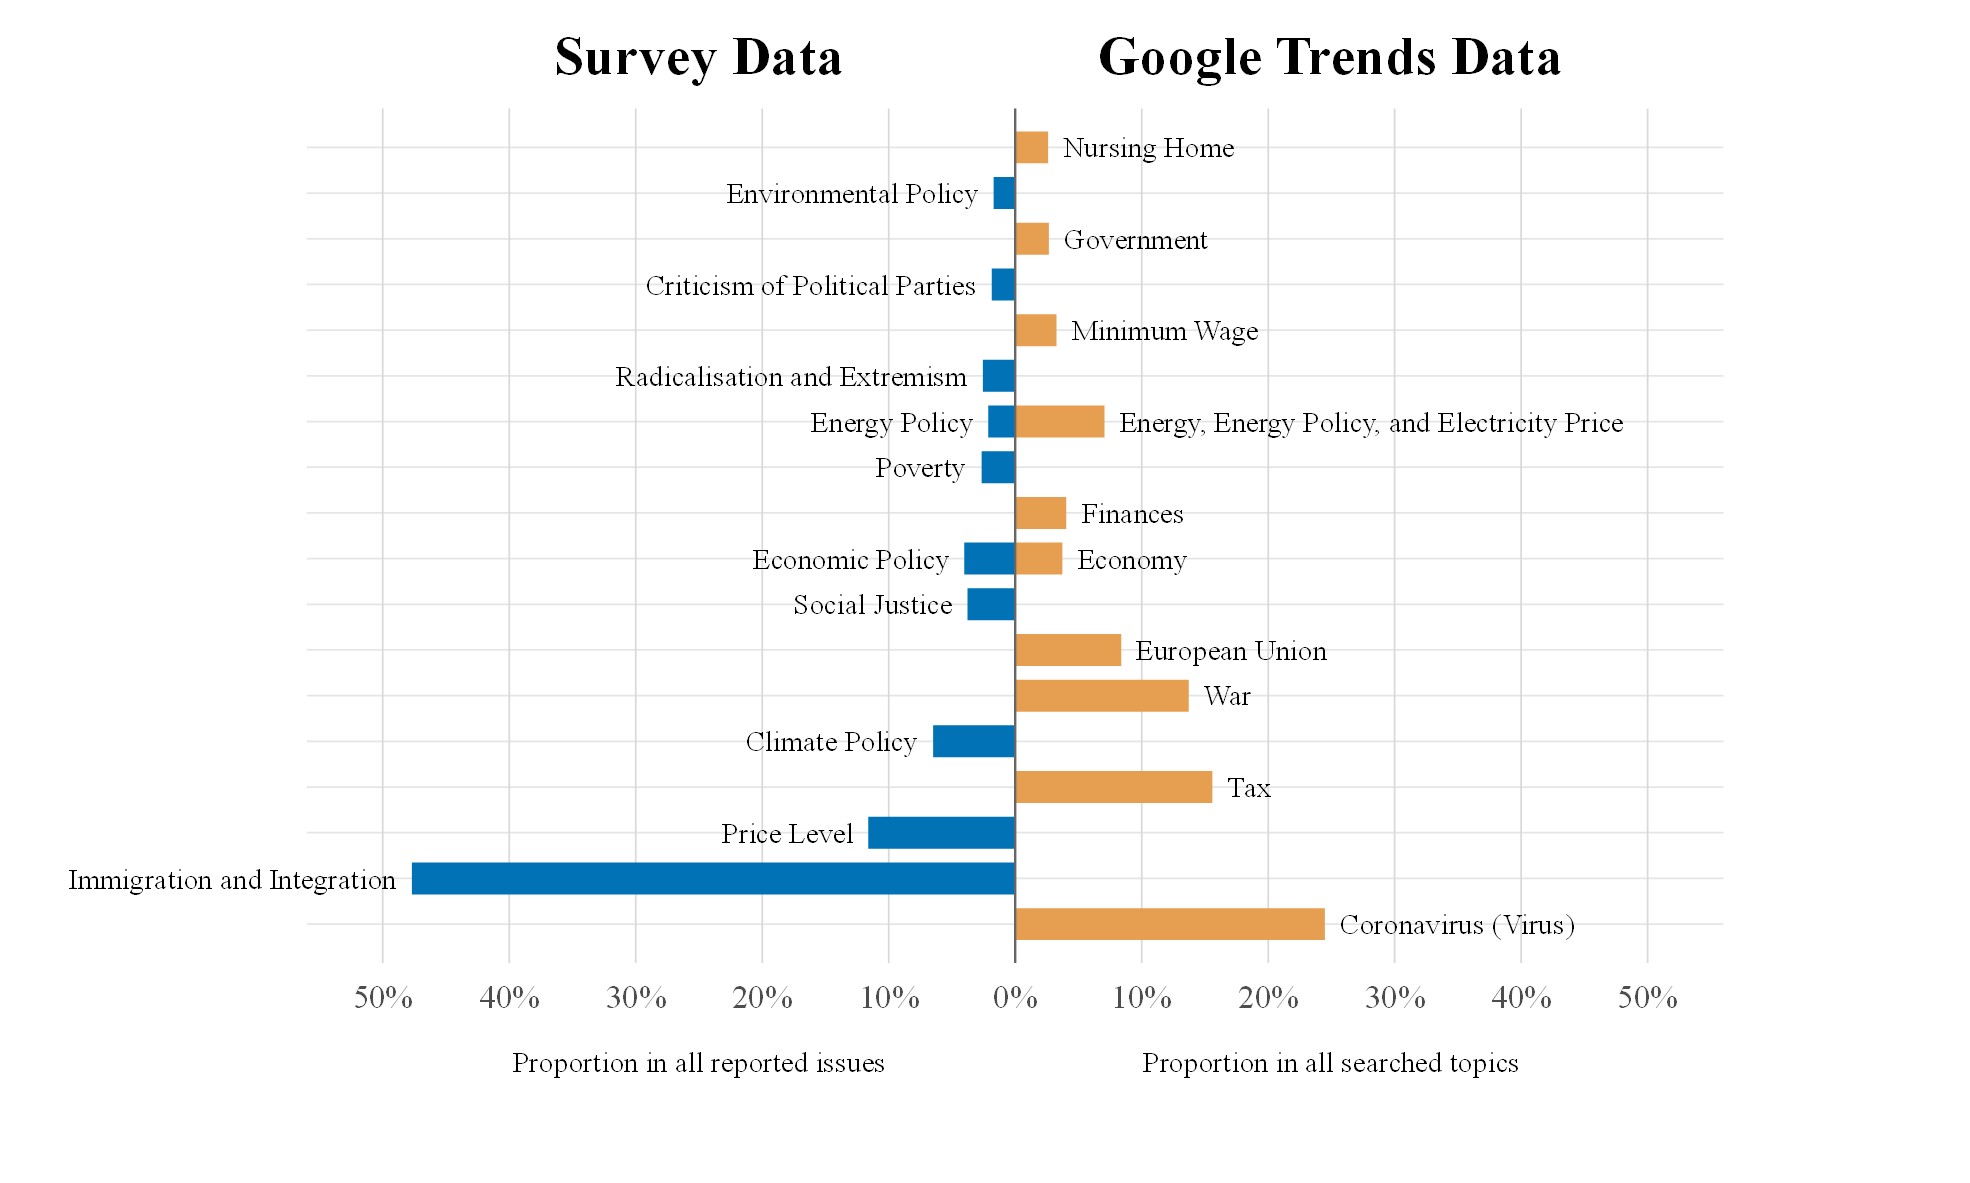
Note: Survey Data: GLES Tracking Data, T56 (ZA7714). Google Trends Data: aggregated real-time data. Field period for both data types: 8.11.-15.11.2023.
The disparity between the issues mentioned in the survey responses and the ranking of their frequency as searched topics on Google suggests a divergence in the issues that respondents identify as an important political problem and the issues that showed high search interest on the web. This discrepancy could potentially be explained by several factors.
Firstly, the survey responses reflect a task that explicitly requires respondents to rank societal problems, whereas Google searches capture unprompted information-seeking behaviour triggered by situational stimuli. Issues like Immigration and Integration, Price Level, and Climate Policy are often at the forefront of political discourse and public debate, prompting respondents to identify them as key concerns when asked directly. This may weaken the relationship between search interest in an issue and its weight in the MIP question.
Secondly, prioritized issues do not necessarily translate into online search interest. The prominence of searches for Coronavirus (Virus), Tax and War during the survey period suggests that people sought information on urgent or personal matters. The surveys were fielded shortly after the outbreak of the Israel–Gaza conflict, which began on October 7, 2023 (Barnea, 2024), and Germany experienced a wave of colds, flu and Covid-19 infections (Buda et al., 2023a, 2023b, 2023c, 2023d), all of which likely increased related searches. Google queries may therefore reflect efforts to understand ongoing events or manage everyday concerns rather than political priorities. Thus, issues like Immigration and Integration, while seen as important long-term problems, do not generate the same immediate informational demand. Moreover, much information seeking about such issues may take place via news websites, as indicated by consistently high search interest in ‘news’ (see below). Methodologically, this suggests that Google Trends primarily captures short-term, event-driven attention rather than the evaluative prioritization elicited by standard survey instruments such as the MIP question.
Beyond substantive interpretations, several measurement-related factors contribute to the observed divergence. One factor concerns differences in population coverage. The GLES surveys are based on quota samples drawn from online access panels and therefore do not represent the full online population. As respondents self-select into participation by registering with panel providers and may drop out over time, such samples can differ systematically from the general population in terms of socio-demographic and political characteristics. In contrast, Google Trends reflects the behavior of users of the Google search engine, which also constitutes a selective subset of the online population. Although Google accounts for over 90 percent of searches in Germany, it is unclear whether certain demographic or political groups are more likely to use alternative search engines.
Another important aspect is the operationalization of prioritized issues in surveys for the Google Trends data collection. Whenever possible, we used the title of the MIP code as provided in the codebook. This title can but must not be included in the open response of the individual. Therefore, the same word may also not be used when individuals seek information on this issue. Individual-level data on search engine use could help address this limitation, for example by using information on individuals’ past browsing or search behaviour. Individually used search terms could then be classified and coded in line with the MIP coding scheme. However, such data were not available in this study.
Moreover, MIP respondents can name only a few issues, so emphasizing one topic inherently downplays others. Google searches are not subject to this constraint, since interest in one issue does not limit searches for others.
In the end, one might question whether such an extensive matching procedure as done in this study is truly necessary, or if researchers could make use of the provided ‘top’ topics within the ‘Politics’ category on the Google Trends website for Germany. To examine this, we additionally retrieved these ‘top’ results for the survey period (see Table 2; table A3 in the appendix shows the German original).
However, these results highlight the limitations of this approach. The list is dominated by generic entries such as ‘News’ or the names of media outlets (‘Der Spiegel’, ‘Bild’), which Google classifies as topics within the ‘Politics’ category. These are not substantive political issues but rather represent channels or aggregators through which people access information. Their appearance reflects the way Google’s algorithm groups search queries, not the public’s concern about specific policy problems. We do not know how Google classifies searches into overarching categories and if search interest in the topics matching the MIPs (and which rank high) are categorized into the Politics category. Moreover, several entries (e.g., ‘weather’) are unrelated to political issue salience, while others (e.g., ‘state elections in Bavaria’) reflect temporary event-driven spikes.
Consequently, the automatically suggested ‘top’ political topics on Google Trends mainly capture information-seeking behaviour about political news sources and ongoing events, not the (perceived) relevance of political problems. They therefore cannot serve as a meaningful proxy for survey-based measures of issue salience, nor as a straightforward supplement without extensive preprocessing and conceptual alignment. In contrast, our comprehensive approach, based on systematically matching MIP categories with corresponding Google topics, enables direct comparison of issue relevance as represented in the GLES MIP codebook.
Table 2. Table of the original Google Trends Topics (category: top, Germany, area: politics) including RSV value translated to English.
| 08.11.2023 | 09.11.2023 | 10.11.2023 | 11.11.2023 | 12.11.2023 | 13.11.2023 | 14.11.2023 | 15.11.2023 |
|---|---|---|---|---|---|---|---|
| News,100 | News,100 | News,100 | News,100 | News,100 | News,100 | News,100 | News,100 |
| Election,26 | Election,25 | Election,25 | Election,23 | Election,25 | Election,23 | Der Spiegel,23 | Election,23 |
| Der Spiegel,23 | Der Spiegel,22 | Der Spiegel,23 | Der Spiegel,23 | Der Spiegel,25 | Der Spiegel,23 | Election,23 | Der Spiegel,22 |
| Der Spiegel,17 | Der Spiegel,16 | Der Spiegel,16 | Der Spiegel,17 | Der Spiegel,17 | Der Spiegel,16 | Der Spiegel,17 | Der Spiegel,16 |
| 2023,16 | 2023,15 | 2023,16 | 2023,16 | 2023,16 | 2023,16 | 2023,16 | 2023,15 |
| Bavaria,15 | Bavaria,14 | Bavaria,14 | Bavaria,14 | Bavaria,15 | Bavaria,14 | Bavaria,15 | Bavaria,15 |
| recent,9 | recent,8 | recent,8 | recent,9 | Bild,8 | recent,8 | Bild,8 | recent,8 |
| Bild,8 | Bild,7 | Bild,8 | Bild,8 | recent,8 | Bild,7 | recent,8 | Hesse,7 |
| Hesse,7 | Hesse,7 | Hesse,7 | Hesse,7 | Hesse,7 | Berlin,7 | Hesse,7 | Bild,7 |
| Berlin,7 | Berlin,7 | Berlin,7 | Berlin,7 | Berlin,7 | Hesse,7 | Berlin,7 | Berlin,7 |
| Germany,7 | Germany,6 | Germany,6 | Germany,7 | Germany,7 | Germany,6 | Germany,7 | Germany,6 |
| Ukraine,5 | Ukraine,5 | Ukraine,5 | Ukraine,5 | Ukraine,6 | Ukraine,5 | Ukraine,5 | Ukraine,5 |
| USA,5 | Wladimir Putin,4 | Wladimir Putin,5 | Wladimir Putin,4 | Wladimir Putin,5 | Wladimir Putin,4 | Wladimir Putin,5 | Wladimir Putin,4 |
| Political Party,4 | Survey,4 | Survey,4 | Political Party,4 | Political Party,5 | Survey,4 | Political Party,4 | Survey,4 |
| Wladimir Putin,4 | Political Party,4 | Political Party,4 | Survey,4 | Survey,4 | Wahl-O-Mat,4 | Survey,4 | Political Party,4 |
| Survey,4 | USA,4 | Wahl-O-Mat,4 | Wahl-O-Mat,4 | Wahl-O-Mat,4 | Political Party,4 | Wahl-O-Mat,4 | Wahl-O-Mat,4 |
| Wahl-O-Mat,4 | Wahl-O-Mat,4 | Sonntagsfrage,4 | Federal Election,4 | Federal Election,4 | Alternative for Germany,4 | Federal Election,4 | Federal Election,4 |
| today,4 | Alternative for Germany,4 | Weather,4 | today,4 | Sonntagsfrage,4 | Sonntagsfrage,4 | Weather,4 | Sonntagsfrage,4 |
| Sonntagsfrage,4 | Weather,4 | today,4 | Weather,4 | The axis of good,4 | today,4 | today,4 | today,4 |
| Alternative for Germany,4 | today,4 | Alternative for Germany,4 | Sonntagsfrage,4 | Alternative for Germany,4 | Weather,4 | State elections in Bavaria,4 | Weather,3 |
| Federal Election,4 | CDU,4 | Federal Election,4 | Election to the 19th state parliament in Bavaria,3 | Weather,4 | Federal Election,4 | Alternative for Germany,4 | The axis of good,3 |
| Weather,4 | Sonntagsfrage,4 | The axis of good,4 | Christian Democratic Union of Germany,3 | today,4 | Election to the 19th state parliament in Bavaria,3 | The axis of good,4 | Election to the 19th state parliament in Bavaria,3 |
| The axis of good,4 | Federal Election,3 | State elections in Bavaria,3 | The axis of good,3 | Election to the 19th state parliament in Bavaria,4 | CDU,3 | Sonntagsfrage,4 | Alternative for Germany,3 |
| Election to the 19th state parliament in Bavaria,4 | The axis of good,3 | Election to the 19th state parliament in Bavaria,3 | The Greens,3 | State elections in Bavaria,4 | The axis of good,3 | Election to the 19th state parliament in Bavaria,4 | The Greens,3 |
| State elections in Bavaria,4 | Election to the 19th state parliament in Bavaria,3 | The Greens,3 | Alternative for Germany,3 | CDU,4 | The Greens,3 | CDU,4 | Christian Democratic Union of Germany,3 |
Note: ‘Der Spiegel’ and ‘Bild’ are news outlets. ‘Wahl-O-Mat’ is an online tool that helps voters in Germany compare their political views with the programs of various parties. ‘Sonntagsfrage’ is a regular opinion poll in Germany that gauges voter preferences for political parties if an election were held on the upcoming Sunday. ‘Alternative for Germany‘ (‘Alternative für Deutschland‘), ‘CDU‘ and ‘The Greens‘ (‘Die Grünen‘) are German parties.
Source: Google Trends Explore, trends.google.com/trends/explore (data manually retrieved on July 12, 2024).
Conclusion
In summary, our analysis reveals a substantial inconsistency between the political issues identified as most important in survey responses and those most frequently searched on Google. While respondents in both GLES surveys predominantly cited long-term, structurally embedded problems such as immigration, inflation, and climate policy, Google Trends data appears to reflect more short-term informational interests related to immediate events (e.g., the Covid-19 pandemic, taxation, or the war in Ukraine). Previous research has shown that GT data may only be suitable for certain topics, to reflect long-term trends in interest, or in certain countries (Mellon, 2013, 2014). Our findings demonstrate that Google Trends data cannot be used as a proxy or replacement for survey-based MIP measures of issue salience, at least not in the German context.From a survey methodological perspective, this divergence is not a weakness of either data source but a consequence of fundamentally different measurement logics. It suggests that digital trace data and survey data may capture different dimensions of public attention: surveys reflect the normative prioritization of issues, while GT data reflects situational information-seeking behaviour. Integrating both data sources does not mean merging them into a single indicator but rather juxtaposing them to reveal these complementary dimensions of public concern. For instance, the temporal structure of GT data can help identify short-term fluctuations in attention to specific MIP categories, which can then be contextualized with the long-term evaluations derived from survey data. For survey researchers, this implies that the value of Google Trends lies primarily in temporal sensitivity rather than in measuring issue prioritization.Nevertheless, Google Trends poses a black-box problem in research practice. It remains unclear under what circumstances Google offers data on a certain ‘topic’ and not just a ‘search term’ to enable comparable searches without the problem of excluding searches with misspellings or based on acronyms. Moreover, researchers lack insight into how Google groups searches into overarching categories, which makes it difficult to make use of a category like ‘politics’ in the hope to yield data on searches driven by political interest. Furthermore, factors like VPN usage can distort geo-locations of search queries, and Google’s handling of such externalities remains unclear. Consequently, researchers must trust in the integrity of Google’s processes despite the lack of transparency, highlighting the need for further transparency and scrutiny in utilizing Google Trends for research purposes. These limitations are particularly consequential for survey researchers seeking to integrate Google Trends into survey-based measurement frameworks.Thus, rather than suggesting substitution, our study demonstrates how integration can enhance survey-based public opinion research: by combining the conceptual clarity of established survey instruments with the temporal granularity of digital trace data. Used in this complementary way, Google Trends can help contextualize short-term attention dynamics without undermining the strengths of survey-based measures of issue salience. Future applications should therefore treat Google Trends not as an alternative measurement of issue salience, but as a supplementary indicator that requires careful conceptual alignment with survey instruments. In this context, the selection of search topics plays a crucial role. While our approach prioritizes alignment with analytically defined MIP categories, alternative strategies that more directly incorporate frequently used expressions from open-ended responses may provide complementary insights into how individuals articulate issue-related concerns in their everyday information-seeking behavior.
Appendix
A1. Table of the original MIP Codes and Google Trends Topics in German
A2. Documentation of the Topic Selection Procedure for Mapping MIP Codes to Google Trends Topic
References
- Barnea, A. (2024) “Israeli Intelligence Was Caught Off Guard: The Hamas Attack on 7 October 2023—A Preliminary Analysis,” International Journal of Intelligence and CounterIntelligence, 37(3), pp. 1056–1082. https://doi.org/10.1080/08850607.2024.2315546.
- Bartle, J. and Laycock, S. (2012) “Telling more than they can know? Does the most important issue really reveal what is most important to voters?,” Electoral Studies, 31(4), pp. 679–688. https://doi.org/10.1016/j.electstud.2012.07.005.
- Behnen, P. et al. (2020) “Experimental Evaluation of Scale, and Patterns of Systematic Inconsistencies in Google Trends Data,” in I. Koprinska et al. (eds.) ECML PKDD 2020 Workshops. Cham: Springer International Publishing (Communications in Computer and Information Science), pp. 374–384. https://doi.org/10.1007/978-3-030-65965-3_25.
- Behnert, J., Lajic, D. and Bauer, P.C. (2024) “Can we predict multi-party elections with Google Trends data? Evidence across elections, data windows, and model classes,” Journal of Big Data, 11(1), p. 30. https://doi.org/10.1186/s40537-023-00868-4.
- Brodeur, A. et al. (2021) “COVID-19, lockdowns and well-being: Evidence from Google Trends,” Journal of Public Economics, 193, p. 104346. https://doi.org/10.1016/j.jpubeco.2020.104346.
- Buda, S. et al. (2023a) “ARE-Wochenbericht KW 41.” https://doi.org/10.25646/11723.
- Buda, S. et al. (2023b) “ARE-Wochenbericht KW 42.” https://doi.org/10.25646/11733.
- Buda, S. et al. (2023c) “ARE-Wochenbericht KW 45.” https://doi.org/10.25646/11751.
- Buda, S. et al. (2023d) “ARE-Wochenbericht KW 46.” https://doi.org/10.25646/11783.
- Chykina, V. and Crabtree, C. (2018) “Using Google Trends to Measure Issue Salience for Hard-to-Survey Populations,” Socius: Sociological Research for a Dynamic World, 4, p. 237802311876041. https://doi.org/10.1177/2378023118760414.
- Cornesse, C. et al. (2020) “A Review of Conceptual Approaches and Empirical Evidence on Probability and Nonprobability Sample Survey Research,” Journal of Survey Statistics and Methodology, 8(1), pp. 4–36. https://doi.org/10.1093/jssam/smz041.
- Cunha, R., Schuler, P. and Williamson, S. (2022) “Signal received? Authoritarian elections and the salience of autocrats,” Electoral Studies, 76, p. 102441. https://doi.org/10.1016/j.electstud.2022.102441.
- Dancy, G. and Fariss, C.J. (2024) “The Global Resonance of Human Rights: What Google Trends Can Tell Us,” American Political Science Review, 118(1), pp. 252–273. https://doi.org/10.1017/S0003055423000199.
- Dennison, J. (2019) “A Review of Public Issue Salience: Concepts, Determinants and Effects on Voting,” Political Studies Review, 17(4), pp. 436–446. https://doi.org/10.1177/1478929918819264.
- Dennison, J. (2020) “How Issue Salience Explains the Rise of the Populist Right in Western Europe,” International Journal of Public Opinion Research, 32(3), pp. 397–420. https://doi.org/10.1093/ijpor/edz022.
- Fowle, C. (2020) “Using Google Trends at Scale,” 25 May. Available at: https://medium.com/data-science/using-google-trends-at-scale-1c8b902b6bfa (Accessed: March 22, 2026).
- Franzén, A. (2023) “Big data, big problems: Why scientists should refrain from using Google Trends,” Acta Sociologica, 66(3), pp. 343–347. https://doi.org/10.1177/00016993221151118.
- Giger, N. and Lefkofridi, Z. (2014) “Salience‐Based Congruence Between Parties & their Voters: The Swiss Case,” Swiss Political Science Review, 20(2), pp. 287–304. https://doi.org/10.1111/spsr.12069.
- GLES (2024a) “GLES Coding of the Most Important Political Problem (2018-2023).” GESIS, Köln. ZA7957 Datenfile Version 3.0.0, http://dx.doi.org/10.4232/1.14338.
- GLES (2024b) “GLES Panel 2023, Welle 25.” GESIS, Köln. ZA7731 Datenfile Version 1.0.0, https://doi.org/10.4232/1.14242.
- GLES (2024c) “GLES Tracking November 2023, T56.” GESIS, Köln. ZA7714 Datenfile Version 1.0.0, https://doi.org/10.4232/1.14243.
- Google News Initiative (2026) Google Trends. Basics of Google Trends. https://newsinitiative.withgoogle.com/resources/trainings/google-trends/basics-of-google-trends/ (Accessed: May 8, 2026).
- Gummer, T. and Oehrlein, A.-S. (2023) “Using Google Trends Data to Learn More About Survey Participation,” Social Science Computer Review, 41(6), pp. 1968–1985. https://doi.org/10.1177/08944393221129179.
- Gummer, T. and Oehrlein, A.-S. (2025) “Using Google Trends Data to Study High-Frequency Search Terms: Evidence for a Reliability-Frequency Continuum,” Social Science Computer Review, 43(4), pp. 814–826. https://doi.org/10.1177/08944393241279421.
- Hanretty, C., Lauderdale, B.E. and Vivyan, N. (2020) “A Choice-Based Measure of Issue Importance in the Electorate,” American Journal of Political Science, 64(3), pp. 519–535. https://doi.org/10.1111/ajps.12470
- Havranek, T. and Zeynalov, A. (2021) “Forecasting tourist arrivals: Google Trends meets mixed-frequency data,” Tourism Economics, 27(1), pp. 129–148. https://doi.org/10.1177/1354816619879584.
- Hölzl, J., Keusch, F. and Sajons, C. (2025) “The (mis)use of Google Trends data in the social sciences – A systematic review, critique, and recommendations,” Social Science Research, 126, p. 103099. https://doi.org/10.1016/j.ssresearch.2024.103099.
- Housholder, E., Watson, B.R. and LoRusso, S. (2018) “Does Political Advertising Lead to Online Information Seeking? A Real-World Test Using Google Search Data,” Journal of Broadcasting & Electronic Media, 62(2), pp. 337–353. https://doi.org/10.1080/08838151.2018.1451854.
- Jabkowski, P. and Cichocki, P. (2025) “Survey response rates in European comparative surveys: a 20-year decline irrespective of sampling frames or survey modes,” Quality & Quantity, 59(S1), pp. 635–655. https://doi.org/10.1007/s11135-024-01993-9.
- Johns, R. (2010) “Measuring Issue Salience in British Elections: Competing Interpretations of ‘Most Important Issue,’” Political Research Quarterly, 63(1), pp. 143–158. https://doi.org/10.1177/1065912908325254.
- Keusch, F. (2015) “Why do people participate in Web surveys? Applying survey participation theory to Internet survey data collection,” Management Review Quarterly, 65(3), pp. 183–216. https://doi.org/10.1007/s11301-014-0111-y.
- Lee, B., Kim, J. and Scheufele, D.A. (2016) “Agenda Setting in the Internet Age: The Reciprocity between Online Searches and Issue Salience,” International Journal of Public Opinion Research, 28(3), pp. 440–455. https://doi.org/10.1093/ijpor/edv026.
- Massicotte, P. and Eddelbuettel, D. (2022) “Package ‘gtrendsR.’” https://cran.r-project.org/web/packages/gtrendsR/gtrendsR.pdf.
- Mavragani, A., Ochoa, G. and Tsagarakis, K.P. (2018) “Assessing the Methods, Tools, and Statistical Approaches in Google Trends Research: Systematic Review,” Journal of Medical Internet Research, 20(11), p. e270. https://doi.org/10.2196/jmir.9366.
- Mellon, J. (2013) “Where and When Can We Use Google Trends to Measure Issue Salience?,” PS: Political Science & Politics, 46(02), pp. 280–290. https://doi.org/10.1017/S1049096513000279.
- Mellon, J. (2014) “Internet Search Data and Issue Salience: The Properties of Google Trends as a Measure of Issue Salience,” Journal of Elections, Public Opinion and Parties, 24(1), pp. 45–72. https://doi.org/10.1080/17457289.2013.846346.
- Miller, J.M., Krosnick, J.A. and Fabrigar, L.R. (2017) “The origins of policy issue salience: Personal and national importance impact on behavioral, cognitive, and emotional issue engagement.,” Political psychology: New explorations., pp. 125–171.
- Rabinowitz, G., Prothro, J.W. and Jacoby, W. (1982) “Salience as a Factor in the Impact of Issues on Candidate Evaluation,” The Journal of Politics, 44(1), pp. 41–63. https://doi.org/10.2307/2130283.
- Raubenheimer, J. (2023) “Of babies, bathwater, and big data: Going beneath the surface of Franzén’s (2023) Google Trends recommendations,” Acta Sociologica, p. 00016993231187489. https://doi.org/10.1177/00016993231187489.
- Schmitt-Beck, R. et al. (2010) “Die deutsche Wahlforschung und die German Longitudinal Election Study (GLES),” in F. Faulbaum and C. Wolf (eds.) Gesellschaftliche Entwicklungen im Spiegel der empirischen Sozialforschung. Wiesbaden: VS Verlag für Sozialwissenschaften, pp. 141–172. https://doi.org/10.1007/978-3-531-92590-5_7.
- Simionescu, M. and Cifuentes-Faura, J. (2022) “Forecasting National and Regional Youth Unemployment in Spain Using Google Trends,” Social Indicators Research, 164(3), pp. 1187–1216. https://doi.org/10.1007/s11205-022-02984-9.
- Timoneda, J.C. and Wibbels, E. (2022) “Spikes and Variance: Using Google Trends to Detect and Forecast Protests,” Political Analysis, 30(1), pp. 1–18. https://doi.org/10.1017/pan.2021.7.
- Woo, J. and Owen, A.L. (2019) “Forecasting private consumption with Google Trends data,” Journal of Forecasting, 38(2), pp. 81–91. https://doi.org/10.1002/for.2559.
- Züll, C. and Menold, N. (2019) “Offene Fragen,” in N. Baur and J. Blasius (eds.) Handbuch Methoden der empirischen Sozialforschung. Wiesbaden: Springer Fachmedien Wiesbaden, pp. 855–862. https://doi.org/10.1007/978-3-658-21308-4_59.
-
Keywords
calibration CATI coverage coverage bias cross-national surveys data linkage data quality European Social Survey experiment face-to-face face-to-face survey Facebook hard to reach populations incentives item nonresponse measurement measurement error mixed-mode surveys multitasking non-probability samples Nonresponse nonresponse bias nonresponse rates paradata PIAAC Probability sample probability samples QR codes rare populations response rate Satisficing social desirability Social media survey survey-taking climate survey data survey management survey methods Telephone survey telephone surveys total survey error unit nonresponse validity web survey Web surveys weighting
