A Review of Reporting Standards in Academic Journals – A Research Note
von Hermanni, H. & Lemcke, J. (2017): A Review of Reporting Standards in Academic Journals – A Research Note. Survey Methods: Insights from the Field. Retrieved from https://surveyinsights.org/?p=8625
© the authors 2017. This work is licensed under a Creative Commons Attribution 4.0 International License (CC BY 4.0) 
Abstract
Response rates can be calculated by various means, allowing the researchers the usage of different disposition codes, which in turn can result in vastly different response rates for the same survey. One of the most comprehensive reporting conventions is the ‘Standard Definitions’ by the American Association of Public Opinion Research (AAPOR), which describes specific definitions of disposition codes and various outcome rates in great detail, allowing for only a marginal variance of results. In this inquiry, we aim to document the reporting of response rates and other survey characteristics in recent publications of scientific journals. Our analyses are based on two sample of articles, which allow a comparison with earlier reviews as well as between different scientific disciplines. Our findings show, that while there is an overall increase in the reporting of response rates and other defining survey characteristics, these improvements are from universal. While the AAPOR standard might be considered an established convention within the survey research community, other disciplines of the social sciences can be considered far more heterogeneous in their reporting styles. A comparison between social sciences and public health journals reveals further a mostly similar reporting pattern, with only specific details underreported in the latter.
Keywords
AAPOR, data quality, response rate, standards, survey reporting, Telephone survey
Acknowledgement
We like to thank Michael Häder and Robert Neumann for valuable comments and suggestions.
Copyright
© the authors 2017. This work is licensed under a Creative Commons Attribution 4.0 International License (CC BY 4.0)
1. Introduction
Rather recently Open Science, as a structured concept, has emerged, trying to foster the development of open and intersubjective standards in the social science and humanities. Its fundamental principles are open data, open source, open methodology, open peer review, open access und open educational resources. Projects like FOSTER (Facilitate Open Science Training for European Research) for example aim “to contribute to a real and lasting shift in the behaviour of European researchers to ensure that Open Science (OS) becomes the norm” (FOSTER, 2016). In the case of survey research the full disclosure of used methods, including the calculation of response rates and the description of the employed study design, e.g. the full disclosure of disposition codes and other survey specific information, can be considered as a valuable contribution to this cause.
In this paper, we will review the dissemination of this open standard within different scientific journals. This approach pursues different interests: First, we give an overview of the dissemination, starting by examining the literature with an emphasis on earlier reviews of the reporting of response rates. Next we sampled scientific articles and in a selection of social science journals between 2010 and 2013, comparing the outcomes with earlier reviews (Marshall, 2006; Smith, 2002). Additionally, we expand on this review by drawing a complete sample of all articles describing computer-aided telephone interviews (CATI) published in journals listed in the Web of Science (WoS) in 2013, which in turn allows a comparison of the reporting over different scientific fields.
2. Background
One of the earliest conventions to communicate survey data quality is the reporting of response rates. Since they can be calculated by various means, either by using different definitions or by varying strategies in handling disposition codes (Martsolf et al., 2013; Skalland, 2011; Smith, 2009), they can only be considered as a ‘minimal disclosure’. AAPORs ‘Standard Definitions’ addresses this issue by allowing the calculation of various response metrics and defining mode-specific disposition codes, leaving little no room for uncertainty in the calculation of response rates. Further, they give a clear outline of what constitutes “excellence in survey practice [promoting] that survey methods be fully disclosed and reported in sufficient detail to permit replication by another researcher” (AAPOR, 2011). While the normative nature of these standards represents a ‘best practice’, we are foremost interested in its empirical application, wondering whether it has been disseminated to the survey research community. We, therefore, started our inquiry by searching for articles scrutinizing the (standardized) reporting of surveys, which yielded multiple results presented in Table 1.
Table 1: Reviews of survey reporting
| Reviewed | Sampling period | # of papers | |
| Smith (Smith, 2002) | 2 Political science journals; 3 Sociology journals; 3 Survey research journals |
Jan 1998 – Dec 2001 |
571 |
| Johnson & Owens (Johnson & Owens, 2003) | 9 Social science Journals; 9 Health & medical science journals |
Jan 2000 – Mar 2003 |
95 |
| Marshall (Marshall, 2006) | POQ; 3 Political science journals; 3 Sociology journals; 3 Health and medical journals |
Jan 2004 – Mar 2006 |
332 |
| Bennett et al. (Bennett et al., 2011) | Database research in Web of Science (WoB); MEDLINE and PsycINFO |
Jan 2008 – Feb 2009 |
117 |
Smith (2002) reviewed the reporting of response rates in political science, sociological, and survey research journals for the first four years after AAPORs initial publication of their ‘Standard Definitions’. He observed that “60 percent of articles provided no information on response rates, 8.5 percent incomplete information, 20 percent gave a response rate, but no definition, nine percent gave a response rate and at least some definition, and [only] 2.5 percent used an AAPOR defined response rate” (Smith, 2002, p. 470). While the frequency of reporting varied strongly between the disciplines, all three showed only “minimal signs of progress” (ibid.) over the sample period, and even in journals published by AAPOR “in 2001, only 14 percent of articles reported AAPOR rates” (Smith, 2002, p. 472).
Johnson and Owens (Johnson & Owens, 2003) expanded their focus towards health science journals and surveyed journal editors about their article review guidelines. After the initial coding of a sample of articles from 18 journals, they contacted authors who had underreported survey characteristics and asked for additional information, to replicate the reported response rates. The results yielded that “some of the papers reporting AAPOR response rates were correct and some were not” (Johnson & Owens, 2003, p. 131). Of the 95 sampled articles over 45% reported either the full sample disposition or an AAPOR response rate, with an additional 26% reporting an undefined rate. The authors point out, that the reporting of AAPOR standards in health journal papers were as prevalent as in the social science journals of the sample. They concluded, “we have yet to encounter any case in which a response rate has been underestimated [while] we have identified a number of cases in which response rates have been overestimated” (Johnson & Owens, 2003, p. 132).
Marshall (Marshall, 2006) sampled another 332 articles from health, political science, and sociological journals and compared them against the survey reporting of Public Opinion Quarterly (POQ) in the same period (2004 – 2006). He found “no articles in leading health and medical journals reported AAPOR response rates” (Marshall, 2006, p. 4173), contradicting Johnson and Owens, who had indicated 11.5% of the health journal articles were explicitly documenting AAPOR rates. While 67% of the POQ articles reported AAPOR rates, this number increased (77%) for surveys collected after the initial publication of AAPOR Standards (1998), suggesting an effect of delayed publications and showing a rigorous change in reporting practice compared to the results of Smith and Johnson & Owens. While sociological and political science journals also increased their share of papers reporting (any) response rate, with a rise from 30% in sociology in 2002 to 50% in 2006, only 6% of them employed the AAPOR standard.
In the most recent study, Bennett et al. (2011) went beyond the mere reporting of response rates and also reviewed the reporting of other survey characteristics, like sampling design, question-wording or the transparency of funding focusing on health and medical science journals. 76% of the sampled articles reported a defined response rate, with another 17% reporting undefined rates. The authors remark “the wide variation in how response rates are reported in the literature is perhaps a historical reflection of the limited consensus or explicit journal policy for response rate reporting” (Bennett et al., 2011, p. 9).
Although this might certainly be true, the reporting of response rates, as well as the decision to use specific formulas, are also influenced by – at least in part – a trade-off between transparency and “presenting one’s work in the most favourable light possible” (Johnson & Owens, 2003, p. 132). While (relatively) low response rates might be enough on its own, to be rejected in a peer-review process, authors can easily mitigate such weaknesses by applying idiosyncratic formulas, thus improving their chances of acceptance. At the same time it has been understood, that a low response rate might be an indicator for, but not a predictor of, nonresponse error, which in turn is the only reason to care about response rates in the first place (Curtin et al., 2000; Keeter et al., 2000; Groves & Peytcheva, 2008; Singer, 2010).
3. Data
3.1. Samples
For our inquiry we sampled two sets of articles: In a first sample (A) we selected nine peer-reviewed journals, following the example of Smith (2002). As already mentioned in Table 1, Smith sampled two political science journals, three sociology journals, and three survey research journals. We decided to sample two journals dedicated to survey research, three sociology, and four political science publications, between 2010 and 2013. The sampled articles used the term ‘survey’ in the title, subtitle, abstract or keywords. Of the initial 431 articles identified between 2010 and 2013, only 103 presented primary survey results based on either a random or a complete sampling of the population in question. Studies were excluded when they conducted secondary analyses, if they referred to other sources for documentation or did not present original data.
The sampling procedure for sample (A) replicates Smiths review with just one minor difference: We reviewed four political science journals (two more then Smith (2002)) and two sociological journals. The reason behind this decision was justified by the fact, that in Smiths review “sociology journals were less likely than political science journals to provide no information on response rates” (Smith, 2002. p. 471). Table 2 shows an overview of the sampled journals, the number of the papers fitting the search criteria and the final number of studies that entered our investigation. As can be seen, several articles included more than one study.
Table 2: Sample A – Number of sampled journals, articles, and studies
| Discipline | Journal |
Initial # of paper |
# papers |
# studies |
| Survey research | Public Opinion Quarterly (POQ) |
129 |
38 |
104 |
| Journal of Official Statistics (JoOS) |
94 |
7 |
19 |
|
| Sociology | Social Forces |
65 |
7 |
9 |
| American Journal of Sociology (AJoS) |
25 |
2 |
5 |
|
| American Sociological Review (ASR) |
34 |
8 |
9 |
|
| Political science | American Journal of Political Science (AJoPS) |
38 |
12 |
18 |
| American Political Science Review (APSR) |
18 |
7 |
9 |
|
| Journal of Politics (JoP) |
43 |
12 |
18 |
|
| Political Research Quarterly (PRQ) |
34 |
10 |
11 |
|
| Total |
480 |
103 |
202 |
For Sample B we used the Web of Science (WoS) to select articles published in 2013 and tagged with the description ‘telephone survey’, which resulted in 501 articles. 62 of those articles were excluded, since they were duplicates, written in languages other than English or German, were no scientific article but a pre- or review or could simply not be obtained by the authors. Of the 439 papers resulting from this, we ended up with 320 articles (400 studies) from 260 different journals, including scientific disciplines like medicine and health science (191), sociology and political science (21), psychology (24) and miscellaneous others. Finally, we removed all articles not presenting results of a telephone survey, which left us with 302 papers (ns=83 / nm=219).
Sample (B) allows the investigation of the more recent reporting practice in a wide range of scientific fields. Since Johnson and Owens (2003) could not identify a difference in the reporting of AAPOR based response rates between health and social science journals, we differentiate scientific fields into the two broad categories of (1) medical and health vs. social science and miscellaneous (see Table 3).
Table 3: Sample B – Number of sampled journals, articles, and studies
| Discipline |
# Journals |
# Initial paper |
# Articles |
# Studies |
| Medical & Health science Journals |
190 |
309 |
219 |
260 |
| Social, Political & Psychological Science as well as Journals with multiple topics (e.g., PLOS one) |
70 |
130 |
83 |
109 |
| Total |
320 |
439 |
302 |
369 |
3.2. Coding
Papers were coded using an EpiData input mask, collecting response rates as well as an additional 36 items characterizing the described surveys. The input mask contained three separate filter questions that had to be answered in the affirmative for the paper to be included in the sample. Initial coding was done between January and March 2016 by one coder. A subsample of 44 studies (10%) of Sample B was drawn and recoded by a second coder afterwards. While the other reported studies did not report any indicator for intercoder reliability, we calculated the interrater agreement using Krippendorff’s alpha for selected items, which ranged from 0.84 (‘type of article’) to 1 (‘being an empirical article’) for the filter questions and .93 (‘response rates reported’) to 1 (‘kind of rates reported’) for the reported response characteristics.
Papers were subsequently grouped following a scheme adapted loosely from Smith (2002):
1) No rates – only absolute sizes of starting and/or final sample size;
2) Other rates, like Cooperation, Completion, Contact or Refusal Rates;
3) Undefined Response Rates, where calculation formulas were not reported;
4) Defined Response Rates, which calculation have been made transparent (incl. studies in which response rates have been calculated analogously to an AAPOR standard without acknowledging it); and
5) AAPOR Response Rates.
Johnson and Owens (2003) did also use a five-tier scale, yet do not distinguish between defined and AAPOR defined response rates, while adding ‘full sample disposition’ as a topmost tier. The authors determine that about “one in five of the papers examined (21.5 %) provided a complete accounting of sample disposition”, yet only one paper allowed “the reader to track the sample from starting sample size to completed interviews” (p. 131). Considering the importance of partial interviews and the size of the eligibility rate for the calculation of RR2 to RR6, the exact meaning of this category remains somewhat unclear. Since each study was coded separately, several articles presented more than one study and thus producing different response rates. For the following comparisons, studies, therefore, were recombined, assigning each the highest reporting score of all surveys nested within the article.
4. Results
4.1. Reporting of response rates in articles
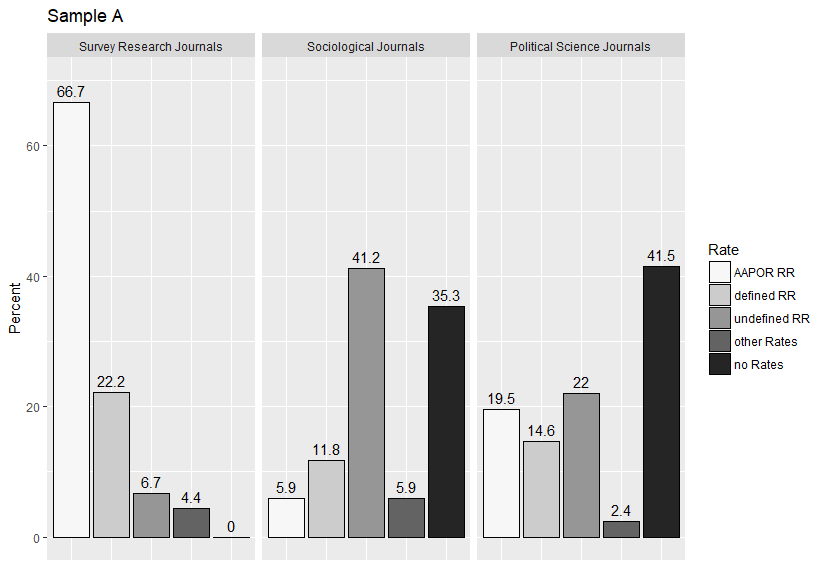
Figure 1: Categorization of journal articles by the method of response rate reporting – Sample A
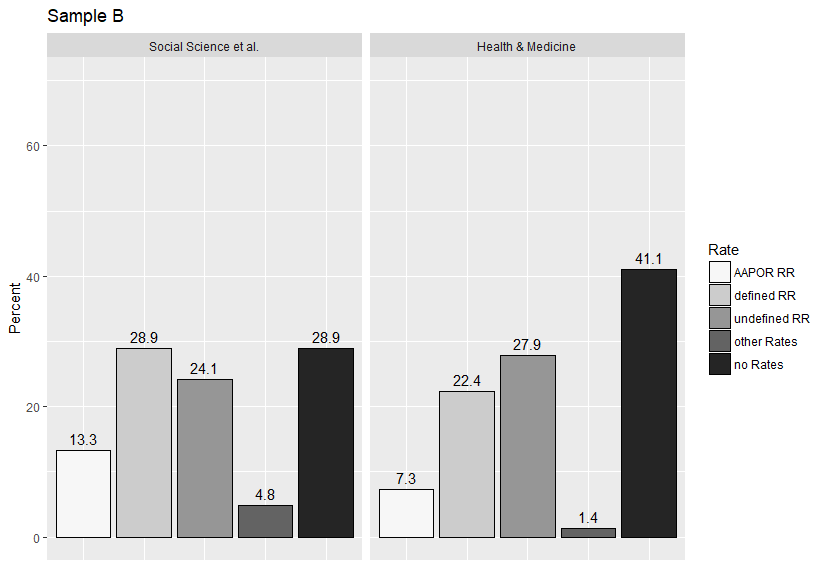
Figure 2: Categorization of journal articles by the method of response rate reporting – Sample B
Figure 1 and 2 display the reporting of response rates in papers for both samples, grouped by their respective disciplines. Considering Sample A, AAPOR rates were reported in 37.9% of all articles, with another 18.5% reporting defined rates (that may rely on AAPOR standards without stating so), 18.4% reported an undefined response rate, 3.9% employed other reporting rates and 22.3% reported no rates at all. While this already vouchers for a significant change in the reporting style compared to the results of Smith (2002), the actual distribution of the different journal topics presents a more diverse picture. Survey research journals reported defined response rates in almost 90% of the cases (66.7% AAPOR), with only five articles (11.1%) reporting either an undefined or different rate for the description of web surveys.
Comparing sociological (n=17) and political science articles (n=41), both share a similar likelihood of reporting response rates (58.8% vs. 56.1%), with most of the sociological papers reporting only undefined rates (41.2%). Compared to the results of Smith (2002), the different likelihood of reporting response rates between sociological and political science articles has levelled out. Again, papers not reporting response rates consist almost exclusively of either web or multistage mixed-mode studies, with a single CATI panel wave being the lone exception. Comparing only the reporting of AAPOR defined response rates, it becomes evident, that neither sociological nor political science journals have adopted it as a mandatory standard, although the latter contained at least one paper in each of the five sampled journals making use of it. Although the general likelihood of reporting response rates increased in the last ten years, the already discovered pattern by Smith (2002) remains. Survey research journals are far more likely of reporting APPOR or defined response rates.
In ‘Sample B’ 7.3% of the health and medicine articles reported an AAPOR response rate, 22.4% a defined and another 27.9% an undefined response rate. That left 1.4% of the papers reporting other rates and 41.1% reporting no rates at all. A comparison between the categories shown in Figure 1 and 2 yield significant differences between response categories across all groups and hints at a very uneven dissemination of the AAPOR standard.
4.2. Reporting of other survey characteristics
While response rates might help to assess survey quality, they are in no way sufficient to describe a specific survey. For this reason, we compared the reporting of several survey characteristics between the two scientific fields. We found that they – first of all – followed a most similar pattern. Medical and social science articles were almost equally alike to report survey characteristics, with only a few exceptions, as can be seen in Figure 3.
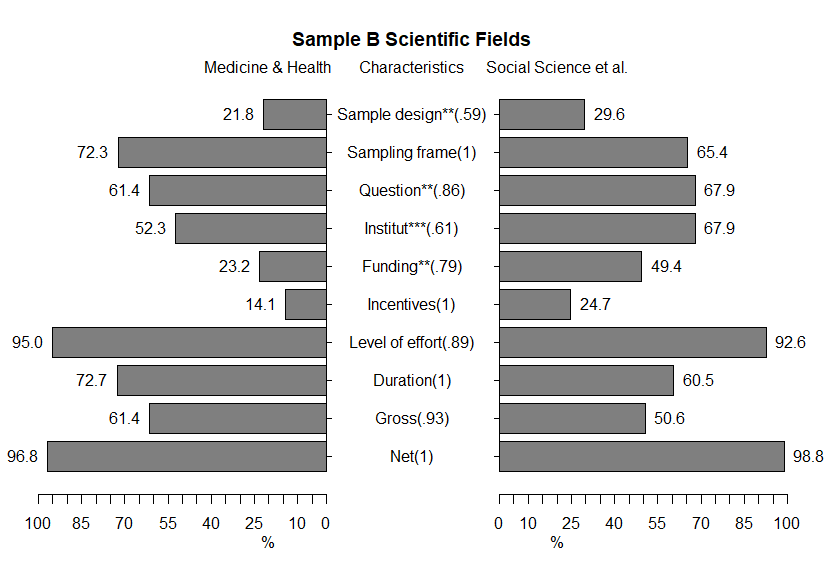
Figure 3: Percent of papers reporting on specific survey characteristics (two-sided t-test with p < 0.10, ** p < 0.05, *** p < 0.01; Krippendorff’s alpha for interrater agreement in parenthesis)
Of the ten displayed survey properties the two journal categories did only differ significantly in (1) the reporting of the sampling design (2) the reporting of the exact question wording on which the study is focused, (3) naming the institute that conducted the data collection and (4) declaring the source of funding for the study. Considering that many medical studies bear the possibility of conflicting interest and even collusion, this result is rather peculiar. Testing for a possible correlation between the reporting of each of the items and the reporting of either an AAPOR or other defined response rate yielded no significant result.
5. Conclusion
Our inquiry aimed at the standards and conventions governing the reporting of survey characteristics in academic journals. By reviewing earlier investigations, we were able to trace the development of the reporting of response rates over the past decade. Building on this, we chose a corresponding sample of journals to present current results for comparison and expanded on this by a sample of articles describing CATI surveys published in 2013.
While the standards of the American Association of Public Opinion have been intensely disseminated in comparison to earlier investigations, they are far from being universally accepted outside of the survey research community. Descriptive comparisons of reporting conventions between medical and non-medical articles suggested a rather common practice, yet the underreporting of funding and survey conducting institutes in medical articles made for a disturbing fact. Future reviews should address these findings as well as the limitations of our study, of which we like to address two: First, while our sampling strategy produced a very diverse sample of journals, a better comparison between different scientific fields, calls for the separate sampling of representative journals. Second, as can be seen in Figure 3, the interrater agreement after coding was heterogeneous and strongly dependent on the specific survey characteristics. While the coding of numerical indicators, like rates and sample sizes, was rather straightforward, non-numerical characteristics, like the type of sampling procedure or the definition of eligibility within the household was rather error-prone and thus produced lower agreement results.
References
- AAPOR. (1998). Standard Definitions: Final Dispositions of Case Codes and Outcome Rates for RDD Telephone Surveys and In-Person Household Survey. Ann Arbor, Michigan.
- AAPOR. (2011). Best Practice for Research. Retrieved October 1, 2016, from http://www.aapor.org/Standards-Ethics/Best-Practices.aspx
- Bennett, C., Khangura, S., Brehaut, J. C., Graham, I. D., Moher, D., Potter, B. K., & Grimshaw, J. (2011). Reporting guidelines for survey research: An analysis of published guidance and reporting practices. PLoS Medicine, 8 (8), 1–11. https://doi.org/10.1371/journal.pmed.1001069
- Curtin, R., Presser, S., & Singer, E. (2000). The effects of response rate changes on the index of consumer sentiment. Public Opinion Quarterly, 64 (4), 413–28. https://doi.org/10.1086/318638
- FOSTER (2016). Facilitate Open Science Training for European Research. https://www.fosteropenscience.eu/about.
- Groves, Robert M., & Peytcheva, E. (2008). The impact of nonresponse rates on nonresponse bias: a meta-analysis. Public Opinion Quarterly, 72(2), 167-189. https://doi.org/10.1093/poq/nfn011
- Guerrero-Bote, V. P., & Moya-Anegón, F. (2012). A further step forward in measuring journals’ scientific prestige: The SJR2 indicator. Journal of Informetrics, 6 (4), 674–688. https://doi.org/10.1016/j.joi.2012.07.001
- Johnson, T., & Owens, L. (2003). Survey Response Rate Reporting in the Proessional Literature. In 2003 proceedings of the section on survey research methods (pp. 127–133). Alexandria, VA: American Statistical Association. https://doi.org/10.1190/1.9781560802129.ch1
- Keeter, S., Miller, C., Kohut, A., Groves, R. M., & Presser, S. (2000). Consequences of Reducing Nonresponse in a National Telephone Survey. The Public Opinion Quarterly, 64 (2), 125–148. https://doi.org/10.1093/poq/nf1035
- Marshall, T. R. (2006). AAPOR Standard Definitions & Academic Journals. In AAPOR – ASA Section on Survey Research Methods (pp. 4172–4174).
- Martsolf, G. R., Schofield, R. E., Johnson, D. R., & Scanlon, D. P. (2013). Editors and Researchers beware: Calculating Response Rates in Random Digit Dial Health Surveys. Health Services Research, 48 (2 PART1), 665–676. https://doi.org/10.1111/j.1475-6773.2012.01464.x
- SCImago. (2013). SJR — SCImago Journal & Country Rank.
- Singer, E. (2010). Nonresponse bias in Household surveys. Public Opinion Quarterly, 70 (5), 637–645.
- Skalland, B. (2011). An alternative to the response rate for measuring a survey’s realization of the target population. Public Opinion Quarterly, 75 (1), 89–98. https://doi.org/10.1093/poq/nfq072
- Smith, T. W. (2002). Reporting Survey Nonresponse in Academic Journals. International Journal of Public Opinion Research, 14 (4), 469–474. https://doi.org/10.1093/ijpor/14.4.469
- Smith, T. W. (2009). A Revised Review of Methods to estimate Status of Cases with Unknown Eligibility. Journal of Chemical Information and Modeling. Chicago. https://doi.org/10.1017/CBO9781107415324.004
-
-
Call for the Special Issue:
Surveying people living in nursing homes –Challenges and Solutions
Keywords
calibration CATI coverage coverage bias cross-national surveys data linkage data quality European Social Survey experiment face-to-face face-to-face survey Facebook hard to reach populations incentives item nonresponse measurement measurement error mixed-mode surveys multitasking non-probability samples Nonresponse nonresponse bias nonresponse rates paradata PIAAC Probability sample probability samples QR codes rare populations response rate Satisficing social desirability Social media survey survey-taking climate survey data survey management survey methods Telephone survey telephone surveys total survey error unit nonresponse validity web survey Web surveys weighting