

Comparing Continuous and Dichotomous Scoring of Social Desirability Scales: Effects of Different Scoring Methods on the Reliability and Validity of the Winkler-Kroh-Spiess BIDR Short Scale
Schnapp P., Eggert S. & Suhr R. (2017). Comparing Continuous and Dichotomous Scoring of Social Desirability Scales: Effects of Different Scoring Methods on the Reliability and Validity of the Winkler-Kroh-Spiess BIDR Short Scale. Survey Methods: Insights from the Field. Retrieved from https://surveyinsights.org/?p=8708
© the authors 2017. This work is licensed under a Creative Commons Attribution 4.0 International License (CC BY 4.0) 
Abstract
Survey researchers often include measures of social desirability in questionnaires. The Balanced Inventory of Desirable Responding (BIDR; Paulhus, 1991) is a widely used instrument that measures two components of socially desirable responding: self-deceptive enhancement (SDE) and impression management (IM). An open question is whether these scales should be scored dichotomously (counting only extreme values) or continuously (taking the mean of the answers). This paper compares the two methods with respect to test-retest reliability (stability) and internal consistency using a short German version of the BIDR (Winkler, Kroh, & Spiess, 2006). Tests of criterion validity are also presented. Data are taken from a post-stratified national probability sample of German family doctors (n = 166). All retest reliabilities exceed .70. No significant differences in test-retest reliability are found for the SDE subscale and the combined scale; the IM subscale attains significantly higher test-retest reliability when scored continuously. Internal consistency is significantly higher for the continuously scored scales in one of two Waves. Tests of criterion validity yield expected results. Overall, these results suggest that the short German scale is a valid measure of socially desirable responding and support the case for continuous rather than dichotomous scoring of BIDR scales.
Keywords
Balanced Inventory of Desirable Responding (BIDR), impression management, self-deceptive enhancement, social desirability, socially desirable responding, test-retest reliability
Acknowledgement
This project was funded by Center for Quality in Care, project no. 082/15/EP. We thank A. Berzlanovich for her very valuable contributions to the development of the questionnaires used in the pretests. We are also grateful to our colleagues at Center for Quality in Care for supporting the research reported herein in a variety of ways. Correspondence concerning this article should be addressed to Patrick Schnapp, Zentrum für Qualität in der Pflege, Reinhardtstr. 45, 10117 Berlin, Germany. Contact: patrick.schnapp@zqp.de
Copyright
© the authors 2017. This work is licensed under a Creative Commons Attribution 4.0 International License (CC BY 4.0)
Introduction
A major threat to the validity of survey data is socially desirable responding, “the tendency to give overly positive self-descriptions” (Paulhus, 2002, p. 50). Accordingly, researchers have developed a number of scales which aim to measure this tendency. These scales are used to identify respondents who tend to describe themselves in an overly positive manner or items and scales which tend to elicit answers tainted by desirability bias (see Paulhus, 1991; Tourangeau & Yan, 2007); also, measures of desirable responding can be used as covariates in multivariate analyses to remove the influence of desirability on the relationship of interest between other variables (see van de Mortel, 2008).
One of the most popular measures is the Balanced Inventory of Desirable Responding (BIDR; Paulhus, 1991). It is based on the two-dimensional conception of social desirability (Paulhus, 1984) and “usually operationalized via the impression management (IM) and self-deceptive enhancement (SDE) scales” (Trapnell & Paulhus, 2012, p. 44). According to the revised interpretation of the inventory (Paulhus & John, 1998), the SDE scale measures agentic self-descriptions; high scores on this scale indicate “egoistic bias”, “a self-deceptive tendency to exaggerate one’s social and intellectual status” (Paulhus, 2002, p. 63) and ascribe “superhero-like” attributes to oneself (Paulhus, 2002, p. 63); the IM scale measures overly positive self-descriptions in terms of communal values; high scores on this scale indicate “moralistic bias”, “a self-deceptive tendency to deny socially-deviant impulses and claim sanctimonious, ‘saint-like’ attributes” (Paulhus, 2002, p. 64). The BIDR 6 contains 20 statements each to measure SDE and IM. Answers are given on a Likert-type scale ranging from “1 – NOT TRUE” to “7 – VERY TRUE” (Paulhus, 1991).
The length of the BIDR limits its utility to survey researchers. Winkler, Kroh and Spiess (2006) have hence developed a six-item German short form of the BIDR. It has proven popular for use in surveys of the general population (Naef & Schupp, 2009a, b; Schneider & Schupp, 2014; Shajek, 2007), consumers (Goetzke, Nitzko, & Spiller, 2014), teachers (Hertzsch, 2012), employees (Heß, 2012; Schneider, 2015) and businesses (Schneider, 2015); it has also been used with student samples (Becker & Swim, 2012; Liebig, May, Sauer, Schneider, & Valet, 2015; Linhoff, 2015; Tondello, Wehbe, Diamond, Busch, Marczewski, & Nacke, 2016). The short scale has been employed to identify respondents who describe themselves in an overly positive manner (Goetzke et al., 2014), as a covariate in multivariate analyses (Becker & Swim, 2012; Heß, 2012; Liebig et al., 2015; Seifried, 2015) and to flag items and scales that correlate with social desirability scores when scales are developed, evaluated and validated (Hertzsch, 2012; Linhoff, 2015; Naef & Schupp, 2009a, b; Schneider, 2015; Schneider & Schupp, 2014; Tondello et al., 2016).
One aim of the present paper is to determine how to use the BIDR short form best. We focus on a consequential detail that has proven contentious: how best to calculate values for SDE and IM from the raw data. Paulhus (1991) recommends “dichotomous scoring” (p. 39): “After reversing the negatively keyed items, one point is added for each extreme response (6 or 7)” (p. 37).
This recommendation has been contested. Stöber, Dette and Musch (2002) suggest that continuous scoring – taking the mean of the response values (after reversing the negatively keyed items) – may be preferable. They see three potential reasons for this. First, “it may be plausible to assume that the processes underlying socially desirable responding are continuously distributed variables” (p. 373); second, dichotomous scoring confounds socially desirable responding and the tendency to give extreme answers; third, the dichotomisation leads to a loss of information.
Empirically, Stöber et al. (2002) and Kam (2013) find that continuous scoring yields superior results. Specifically, internal consistencies (Cronbach’s alphas) are higher when continuous scoring is used (Stöber et al., 2002, Studies 1-3), though some of these differences are not significant (Stöber et al., 2002, Study 2). Convergent validity is significantly higher for continuously scored BIDR results in five out of seven comparisons (Kam, 2013; Stöber et al., 2002, Study 1). Concerning criterion validity, Stöber et al. (2002) find that “continuous SDE scores display significantly higher correlations with the Big Five personality traits for which previous research has found correlations [. . .] than do dichotomous SDE scores” (p. 385). However, for the two versions of the IM scores the results are equivocal (Stöber et al., 2013, Study 3).
It is important not to overstate the significance of these findings. Cronbach’s alpha is of limited value, as it is in part a function of the number of items in a scale (Cortina, 1993; Schmitt, 1996, p. 350; Sijtsma, 2009, p. 114; Streiner, 2003, p. 101), which means its value can be increased by simply adding items (Boyle, 1991; Rammstedt, 2010, p. 249; Streiner, 2003, p. 102), it can also be increased by narrowing the content of the construct that is measured (Boyle, 1991; McCrae, Kurtz, Yamagata, & Terracciano, 2011, p. 230; Streiner, 2003, p. 102), it may exhibit high values when the underlying structure is mulitdimensional or low values when the underlying structure is unidimensional (Cortina, 1993; Sijtsma, 2009) and it is a poor predictor of validity (McCrae, Kurtz, Yamagata, & Terracciano, 2011). Accordingly, the relevance of the results concerning Cronbach’s alpha is limited.
Comparisons of criterion validity are hard to interpret unless one knows what the correlation between a measure and its criterion measure ought to be – contrary to what Stöber et al. (2002, pp. 381-382) imply, more is not necessarily better in this respect (Stanton, Sinar, Balzer, & Smith, 2002, p. 178). The most convincing evidence on the superiority of continuous scoring comes from the tests of convergent validity, but not all of these tests yield clear results. These limitations of the evidence may help explain why some authors (e.g., Mallinckrodt, Miles, Bhaskar, Chery, Choi, & Sung, 2014) continue using dichotomous scoring despite extant research favouring the continuous method.
Our main aim in this paper is to contribute to the resolution of this issue. To do so, we present the first comparisons of dichotomously vs. continuously scored test-retest results based on BIDR data. Retest reliability is a variant of reliability that is devoid of the weaknesses of consistency measures mentioned above and is clearly interpretable in a more-is-better fashion (Streiner, 2003, p. 102). We also supplement previous results by presenting comparisons of measures of internal consistency and associations with external criteria. Our paper is the first to address this question in a survey context and the first to use the BIDR short form (Winkler et al., 2006). Hence, this article is also a validation study of this scale, the first to present retest data. We address both questions – dichotomous vs. continuous scoring and the validity of the BIDR short scale – throughout the article.
Another unusual feature of this article is that it uses data representative of an identifiable population, family doctors in Germany. We use post-stratification weights to compensate differential nonresponse. Unweighted results are displayed in the Appendix, and differences between weighted and unweighted results are noted throughout the text. However, as weighted results are likely to be closer to the results that would have been obtained had data on the whole population been available, we base our interpretation of the data almost exclusively on the weighted results.
Method
Participants and Procedure
BIDR short scales were included in both waves of a pilot study of a questionnaire addressing family doctors in Germany. The questionnaire contained 53 items in 14 questions. The topic of the survey was abuse and neglect of doctors’ patients in need of long-term care and assistance. We asked about subjective confidence in the respondent’s ability to deal with such problems as well as experiences, attitudes and continuing medical education regarding the survey topic. Questions about sociodemographic information and the proportion of the respondent’s patients in need of long-term care were also included. The study was approved by the review board of Ärztekammer Berlin (Eth-21/16).
Four versions of the questionnaire were tested simultaneously. Each version dealt with one facet of abuse and neglect: physical violence, sexual abuse, restraint and neglect. Questionnaires were highly similar, with analogous questions asked in the same order in all questionnaires in an attempt to ensure comparability across questionnaire types. The BIDR short scale (described in detail below) was identical in all questionnaires and placed between the substantial portion of the questionnaire and sociodemographic items.
The aim was to draw a small but representative sample of family doctors in Germany. We obtained data from the commercial provider ArztData. The provider aims to cover all resident doctors in Germany and claims 99% coverage (ArztData, n.d.); accordingly, this database has been used by a previous large-scale study aiming for a representative sample of German family doctors, the ÄSP-kardio study (e. g., Görig et al., 2014; Diehl et al., 2015). From the provider’s dataset, a random sample of 11,000 was drawn. From this list, 2369 respondents were randomly selected and sent questionnaires by mail. Respondents were randomly assigned to one of the four questionnaires. Personal codes were included. In the cover letter, participants were promised (and later received) a € 50 Amazon gift card if they returned, by mail or fax, two completed questionnaires on time. When a Wave 1 questionnaire was received, the participant was sent an identical Wave 2 questionnaire. No reminders were sent. The field period for the two Waves was June and July 2016.
Measures
Social desirability. The six-item, German language short version of the BIDR developed by Winkler et al. (2006) contains three items each for SDE and IM. For this instrument, the authors chose items on the basis of their psychometric properties from a pool of ten items, which, in turn, were chosen and translated from Paulhus’ original 40 item scale. Responses are given on a Likert-type scale ranging from “1 – trifft überhaupt nicht zu” [“1 – is not accurate at all”] to “7 – trifft voll zu” [“7 – is completely accurate”]; the other points are labelled by integers only. Winkler et al. (2006) report that the items in question load on two different principal components, consistent with the two-component model of social desirability. Internal consistencies are .60 (SDE) and .55 (IM). Correlations with the Big Five personality factors are largely as expected. Correlating results of the BIDR short scale with a short version of the Marlowe-Crowne (1960) scale (a test of convergent validity) shows that “the expected results can be observed, though the relationships are somewhat weak” (Winkler et al., 2006, p. 18).
Winkler et al. (2006) argue that future research should use the scale with some items reverse keyed to reduce confounding of the results with acquiescence. The resulting items are shown in Table 1.
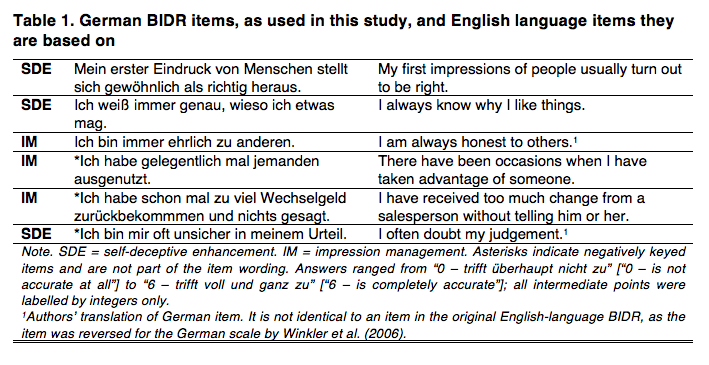
For the purposes of the present research, four slight alterations were made to the scale proposed by Winkler et al. First, while a seven-point scale was used as in Paulhus (1991) and Winkler et al. (2006), the one used here ranged from “0 – trifft überhaupt nicht zu” [“0 – is not accurate at all”] to “6 – trifft voll und ganz zu” [“6 – is completely accurate”] rather than from 1 to 7; as in the original, all intermediate points were labelled by integers only and high values indicate a strong tendency towards socially desirable responding (after recoding appropriate items). This change was made to improve consistency with the rest of the questionnaire. Second, and for the same reason, full stops were added at the end of the items. Third, spelling was adjusted to reflect current German orthography. Fourth, the item concerning one’s judgement was moved to the end of the scale to minimize halo effects. Given the context, we assumed that some respondents would interpret this item to refer to medical decision making only if it was placed towards the beginning of the list and that any such misunderstanding would be reduced by moving the item to the end of the list. We did not test these assumptions.
Subjective confidence. As an external criterion, we use the BEACON-C-3, a scale constructed to measure the extent to which the respondent feels competent to take action against abuse of his or her patients in need of long-term care and assistance (Schnapp & Suhr, 2017). The exact wording differs between types of abuse. The measure consists of the question stem “If I suspected that a patient in need of long-term care was being [abused in the specific manner] . . .” and the three items “. . . I’d know exactly what to do next.”, “. . . I’d be unsure how to proceed.” (reverse scored) and “. . . I’d be well prepared.” It is scored on a five-point scale from 0 to 4, with high values indicating high confidence. As reported in Schnapp & Suhr (2017), this scale yields a one-factorial solution, a retest correlation of .89, a small and marginally significant negative correlation with a measure of interest in further education (used as a criterion) and an average k* value for the three items of .84. k* is a measure of content validity derived from expert judgements of item relevance, with values of .75 or above considered “excellent” (Polit, Buck, & Owens, 2007).
Test-retest interval. We estimate the time between test and retest by subtracting the return date of the first questionnaire from the return date for the second questionnaire, allowing one day for each (first or second Wave) questionnaire returned by mail (but zero days if it is returned by fax).
Sociodemographic information. We estimate participants’ age by subtracting respondents’ self-reported year of birth from 2016. Gender was measured by a standard question.
Results
Response rate and weighting procedure
Twenty-three questionnaires were undeliverable and 14 addressees notified us that they did not work as family doctors. This reduced the effective sample to 2332. Two hundred and sixty questionnaires were received in Wave 1 and 176 in Wave 2, for response rates of 11% and 8%, respectively. The response rates for the different versions of the questionnaire are: restraint, 9% (Wave 1)/7% (Wave 2); physical violence, 11%/8%; sexual abuse, 11%/8%; neglect, 9%/7% (AAPOR [2016] Response Rate 1). Cases with incomplete data on any of the social desirability items or age are excluded from the analysis, but missing data on other variables are accepted. This results in a sample of 166.
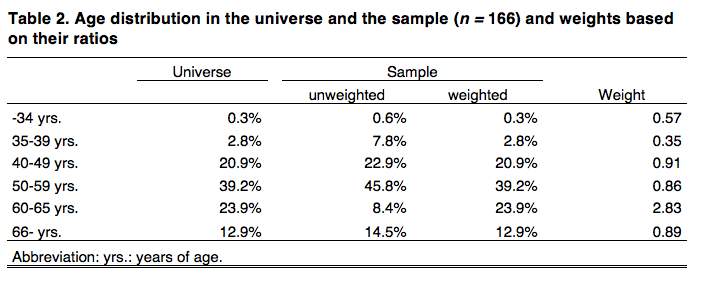
The only sociodemographic variable for which data for the universe are available is grouped age as of 31 December, 2015 (Bundesärztekammer, n.d., Table 8). While there is other information on the characteristics of doctors working in Germany available (Bundesärztekammer, n. d.; Statistisches Bundesamt, 2017), none of it contains sociodemographic data for our universe. Table 2 shows some noteworthy differences between the sample and the universe. Accordingly, weights were calculated by dividing the proportion of the universe in an age group by the proportion of the unweighted sample. The resulting weights are also displayed.
Descriptives
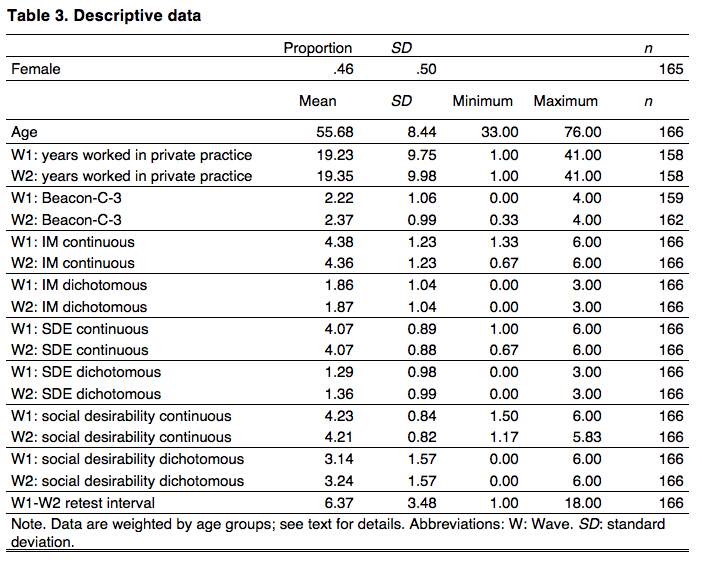
Table 3 and Appendix Table A-1 show descriptives for data with and without weighting, respectively. As should be expected, weighted and unweighted results are similar, as are results across waves. While no data is available to compare the characteristics of our weighted sample to those of the universe, one source (Statistisches Bundesamt, 2017) provides the gender (but not age) distribution of family doctors registered with the statutory health insurances in 2015. According to this source, 45% of these doctors were female, a value closer to the weighted than the unweighted result. This supports the view that weighted results are to be preferred.
The retest interval varies more than it would have under more controlled circumstances but less than one might expect in a postal survey.
Internal Consistency
Table 4 shows Cronbach’s alphas for both Waves 1 and 2. Internal consistencies for the IM scale are very similar to those reported by Winkler et al. (α = .55), whereas those for the SDE scale are lower than in the original study (α = .60). Particularly surprising is the decrease in alpha for the continuously scored SDE scale between Waves 1 and 2. This result was double-checked and confirmed. It is driven mainly by a decrease in the correlations of the items “I often doubt my own judgement” and “I always know why I like things”. All alphas are below .60.
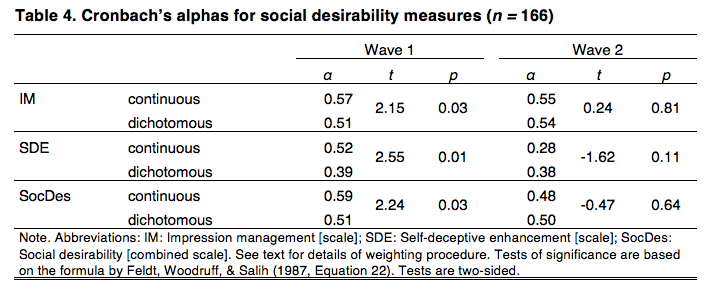
The formula by Feldt, Woodruff and Salih (1987, Equation 22) is employed to test for the significance of differences between alpha values. Continuously scored values yield significantly higher alphas for Wave 1 but not for Wave 2. The main difference between the weighted and unweighted samples is that in the latter, the results for dichotomously and continuously scored IM scales are not significantly different (Table A-2).
Retest reliabilities
Table 5 shows the central results. It compares retest reliabilities for the two scoring procedures. The relevant comparisons are between scoring methods (continuous vs. dichotomous) within a wave and scale. These are comparisons between non-overlapping correlations from dependent samples. For this situation, there is a number of significance tests, none of which is clearly preferable to all the others (Diedenhofen & Musch, 2015). The table displays results for Steiger’s (1980, Equation 15) statistic, calculated using the cocor program (Diedenhofen & Musch, 2015). Alternative tests also implemented in cocor yield very similar results; in no case does the choice of test make a difference in terms of significance.

All weighted retest reliabilities are at least .70 and some exceed .80. Continuous scoring results in a significantly higher retest reliability for the IM subscale. The difference between the two versions of the SDE subscale is very small and not significant. The combined social desirability scale exhibits a somewhat higher retest reliability for continuous scoring, but the result is only marginally significant.
The most noteworthy difference between the weighted and the unweighted dataset is that in the latter, the difference between the two scoring methods applied to the IM scale is not quite significant at the conventional level using a two-sided test; z(164) = -1.93, p = .054 (Table A-3). However, more trust should be put in the result from the weighted dataset, given that it is probably the better estimate of the result that would have been obtained had the whole population been tested. A more serious threat to the results arises from the fact that the estimates are based on a fairly small sample. Generally speaking, the smaller a sample, the more likely it is that a coefficient’s statistical significance is the consequence of an overestimation of the coefficient’s magnitude due to chance factors such as sampling and measurement error (Button et al., 2013; Loken & Gelman, 2017). Accordingly, some researchers issue recommendations such as, “a minimum sample of 200-300 respondents […] is needed for any good correlational or reliability analysis” (Clark & Watson, 1995, p. 317). However, the danger of the significant result for the IM subscale being due to such an overestimation need not be decided on the basis of rules of thumb. Instead, it can be assessed using the retrospective design calculation proposed by Gelman and Carlin (2014). This method allows researchers to estimate the “exaggeration ratio” (p. 641). The exaggeration ratio is the expectation of the factor by which an empirically obtained, statistically significant coefficient overestimates the true value in the population the sample was drawn from. Calculating the exaggeration ratio requires as inputs the standard error of the empirically obtained coefficient and a plausible estimate of the true size of the coefficient in the population. This latter estimate needs to be taken from sources other than the data at hand. The standard source is the extant empirical literature (Gelman & Carlin, 2014).
As noted, the extant literature contains no studies measuring the difference in retest reliabilities of dichotomously vs. continuously scored IM scales. However, Cronbach’s alpha is often a reasonable proxy for short-term retest reliability (Gnambs, 2014; McCrae et al., 2011). Given this, differences between alphas seem likely to be reasonable proxies for differences in retest reliabilities. Stöber et al. (2002) give values for the differences between alphas obtained on the basis of continuous and dichotomous scoring of IM scales from three studies. We take the mean of the three differences weighted by their sample sizes. This mean is approximately 0.10 and the exact value (to eight digits) is used as our preferred estimate of the true effect size.
Using this estimate, we find that the exaggeration ratio is 1.00. Varying the assumed true effect size, as recommended by Gelman and Carlin (2014), we find that an assumed effect size of .05 leads to an exaggeration ratio of 1.23 and an assumed effect size of .15 yields an exaggeration ratio of 1.00. Hence, the significance of our finding for the IM subscale is unlikely to be the result of overestimating the effect size to a substantial degree.
Associations with external measures
In this section we describe the association of dichotomously and continuously scored measures with two external variables, gender and the BEACON-C-3 measure of subjective confidence in dealing with possible cases of abuse and neglect. Previous research suggests that women typically score substantially higher than men on IM measures, but no such clear pattern has been found for SDE measures (Dalton & Ortegren, 2011; Paulhus, 1991; Winkler et al., 2006). We hence expected women to exhibit higher values for IM but made no prediction regarding differences in SDE values.
We expected a positive correlation of the BEACON-C-3 scale with the SDE measure, as “a self-deceptive tendency to exaggerate one’s social and intellectual status” (Paulhus, 2002, p. 63), which the SDE scale aims to measure, seems likely to extend to professional competence. In contrast, we made no specific prediction with respect to the IM measure, as “a self-deceptive tendency to deny socially-deviant impulses and claim sanctimonious, ‘saint-like’ attributes” (Paulhus, 2002, p.64), which it aims to measure, is not obviously relevant in this context.
A higher mean for female respondents on the IM measure and a positive correlation of the BEACON-C-3 with the SDE measure would hence serve to validate the BIDR short scale. In contrast, this section makes no contribution to the question whether scales should be scored in a continuous or dichotomous fashion. As discussed in the introduction, the prediction that there is an association between two measures does not imply that measures yielding particularly strong associations are to be preferred (Stanton et al., 2002, p. 178). Hence, results for both scoring methods are reported in this section, but there is no focus on the differences between them.
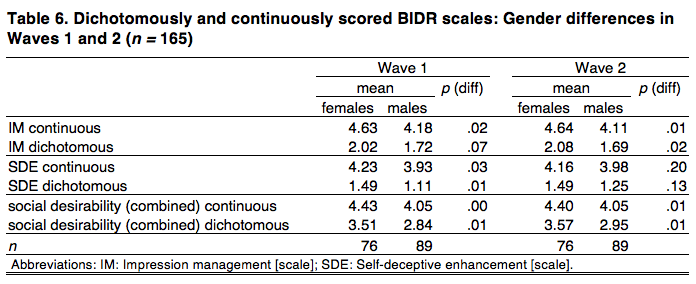
Table 6 displays the results for gender differences, with one case excluded due to missing data on gender and p values based on a two-sided t test. As expected, women score consistently higher than men on the IM scale, a difference that is significant in 3 out of 4 tests. Women also score higher on the SDE scale, a difference that is significant in 2 out of 4 tests. As a consequence, women score significantly higher than men on the combined scale in all four cases.
Unweighting the dataset results in a surprising number of results crossing the threshold from significant to not significant. However, the most important result is the difference for the IM scale using continuous scoring (as both our and extant results show that continuous scoring is preferable to the dichotomous method). This result is largely unaffected (Table A-4).

Table 7 displays partial correlations between the BEACON-C-3 and BIDR scales. As described above, our data are based on questionnaires that are very similar but deal with four different types of abuse and neglect. Hence, when estimating the correlation of interest, we partial out the influences of three dummy variables indicating that the BEACON scale made reference to restraint, physical violence or sexual abuse, respectively (with neglect as the reference category). The sample sizes are reduced due to missing data on the BEACON-C-3.
The correlation with the IM scale is close to zero in all cases. The overall scale yields one significant result, a positive association with the dichotomous scale in the second wave. Most importantly, the expected positive correlation between the SDE measure and the measure of confidence is observed, with 3 out of 4 tests yielding significant results.
When unweighted data are used, more associations reach statistical significance. The prediction concerning the correlation of the SDE and BEACON-C-3 scales is also borne out in this version of the data (Table A-5).
In sum, all predictions about the directions of associations are borne out by the data, although these results are statistically insignificant in a minority of cases.
Discussion and Conclusions
This paper’s aim is to contribute to both the study of dichotomous vs. continuous scoring of BIDR scales and the validation of the BIDR short scale. We discuss results with eyes on both aims and start with some limitations of the study. All interpretations are based on the results for the weighted dataset only.
This study employed a post-stratified national probability sample of family doctors. This may be seen as an improvement over the convenience samples often used for the development and validation of scales. However, it is unclear whether results reported herein generalise to other groups. In particular, compared to the general population, our sample may suffer from restriction of range issues and the high socioeconomic status of respondents may be thought to influence retest reliabilities. However, Hemingway, Nicholson and Marmot (1997) found “no effect” of occupational status on the retest reliability of the SF-36, a general health questionnaire (p. 1486). Nonetheless, it may be that retest results would have been different with a more diverse sample. We consider it unlikely, however, that our use of a highly educated sample has had much of an effect on the differences between the two scoring methods, as the exact same data are used for both methods.
We studied the question of dichotomous vs. continuous scoring with a specific version of the BIDR scale, the short German instrument developed by Winkler et al. (2006). We believe this increases the value of our results for survey researchers compared to results from a study of the full-length BIDR, the use of which in surveys is not feasible. Nonetheless, it should be noted that the results would likely have been different had the full-length version of the scale been used. In particluar, it seems likely that retest reliability would have been higher had the full scale been used, given that longer versions of an instrument typically yield higher retest correlations than shorter versions of the same instrument (see, e. g., Gnambs, 2014). With respect to other measures, and differences between the scoring methods, the direction of the differences (if any) is unclear.
All Cronbach’s alphas are below .60 and hence lower than usually desired. Results also show that the continuous method yields significantly higher consistencies in one of two waves. The findings on internal consistency hence appear to bolster the case for continuous scoring while casting doubt on the utility of the BIDR short scale. However, we advise against putting too much weight on our or extant results concerning this question, given the large literature on the limitations of the Cronbach’s alpha measure discussed in the introduction (Cortina, 1993; McCrae et al., 2011; Rammstedt, 2010; Schmitt, 1996; Sijtsma, 2009; Streiner, 2003). While other measures of internal consistency exist, they all share with alpha the weakness of rewarding narrowness of the construct actually measured (irrespective of the theoretical construct the researcher has in mind; Boyle, 1991). It is worth remembering in this context that consistency measures were developed as, and should still be seen as, substitutes for measures of retest reliability when the latter are not available (Guttman, 1945; Sijtsma, 2009).
In the present study, retest reliabilities are available. They are .70 or above for all subscales using either scoring method. This is an attractive feature of the BIDR short scale. The scoring method makes no noteworthy difference for the SDE scale, while dichotomous scoring is superior when used with the IM scale. When interpreting these results, one should keep in mind that the average interval between test and retest was fairly short. While short intervals reduce the threat of measurement error due to change in the unobserved true values, they increase the threat of measurement error due to memory effects (Rammstedt, 2010). If memory effects are a more serious threat than changes in the true values, then the results presented here should be seen as upper-bound estimates of the retest reliability of the BIDR short scale. Again, assessments of the relative merits of dichotomous and continuous scoring seem likely to be unaffected, as both scoring methods are based on the exact same data.
Tests of criterion validity do not contribute to the resolution of the question regarding scoring methods but help assess the validity of the short scale. All associations with external variables were in the expected direction and 6 out of 8 were statistically significant.
The results presented herein make a fairly strong case for using the BIDR short scale devised by Winkler et al. (2006). Given the combination of results concerning reliability and validity, future survey researchers may want to consider this instrument as a measure of socially desirable responding.
As mentioned in the introduction, Stöber et al. (2002) gave three reasons why continuous scoring may be superior: (i) the underlying processes are best conceived of as continuously distributed; (ii) possible confounding with extremity bias is reduced; (iii) all of the information in the scores is preserved. While we cannot distinguish between these explanations, our results suggest that continuous scoring is indeed superior. Taken by itself, the present paper makes only a weak case for this conclusion: The most important tests concern retest reliability; these show a significant difference for only one of the subscales (IM) and this difference is small. However, our evidence points into the same direction as previous findings. As a result, researchers faced with the decision of how to score the BIDR will find that all three publications on the topic converge on the same conclusion despite using different types of samples, different versions of the BIDR and a variety of tests. The results presented herein hence strengthen the case for using continuous rather than dichotomous scoring of BIDR scales.
Appendix
References
- AAPOR [American Association for Public Opinion Research] (2016). Standard definitions: Final dispositions of case codes and outcome rates for surveys. N. p.: Author.
- ArztData (n.d.). Verzeichnis medizinischer Behandler in Deutschland, Österreich und der Schweiz. Retrieved from http://www.arztdata.de/pdf/Kurzpraesentation_ArztData_AG.pdf
- Becker, J. C., & Swim, J. K. (2012). Reducing endorsement of benevolent and modern sexist beliefs: Differential effects of addressing harm versus pervasiveness of benevolent sexism. Social Psychology, 43(3), 127-137.
- Boyle, G. J. (1991). Does item homogeneity indicate internal consistency or item redundancy in psychometric scales? Personality and Individual Differences, 12(3), 291-294.
- Bundesärztekammer (n.d.). Ärztestatistik 2015. Berlin, Germany: Bundesärztekammer. Retrieved from http://www.bundesaerztekammer.de/ueber-uns/aerztestatistik/aerztestatistik-2015/
- Button, K. S., Ioannidis, J. P. A., Makrysz, C., Nosek, B. A., Flint, J., Robinson, E. S. J., & Munafo, M. R. (2013). Power failure: Why small sample size undermines the reliability of neuroscience. Nature Reviews Neuroscience, 14(5), 365-376.
- Clark, L. A., & Watson, D. (1995). Constructing validity: Basic issues in objective scale development. Psychological Assessment, 7(3), 309-319.
- Cortina, J. M. (1993). What is coefficient Alpha? An examination of theory and applications. Journal of Applied Psychology, 78(1), 98-104.
- Crowne, D. P., & Marlowe, D. (1960). A new scale of social desirability independent of psychopathology. Journal of Consulting Psychology, 24(4), 349-354.
- Dalton, D., & Ortegren, M. (2011). Gender differences in ethics research: The importance of controlling for social desirability response bias. Journal of Business Ethics, 103(1), 73-93.
- Diedenhofen, B. & Musch, J. (2015). Cocor: A comprehensive solution for the statistical comparison of correlations. PLoS ONE, 10, e0121945.
- Diehl, K., Gansefort, D., Herr, R. M., Görig, T., Bock, C. Mayer, M., & Schneider, S. (2015). Physician gender and lifestyle counselling to prevent cardiovascular disease: A nationwide representative study. Journal of Public Health Research, 4(2), 534-540.
- Feldt, L. S., Woodruff, D. J., & Salih, F. A. (1987). Statistical inference for coefficient alpha. Applied Psychological Measurement, 11(1), 93-103.
- Gelman, A., & Carlin, J. (2014). Beyond power calculations: Assessing Type S (sign) and type M (magnitude) errors. Perspectives on Psychological Science, 9(6), 641-651.
- Gnambs, T. (2014). A meta-analysis of dependability coefficients (test–retest reliabilities) for measures of the Big Five. Journal of Research in Personality, 52(1), 20-28.
- Goetzke, B., Nitzko, S., & Spiller, A. (2014). Consumption of organic and functional food: A matter of well-being and health? Appetite, 77(1), 96-105.
- Görig, T., Mayer, M., Bock, C., Diehl, K., Hilger, J., Herr, R. M., & Schneider, S. (2014). Dietary counselling for cardiovascular disease prevention in primary care settings: Results from a German physician survey. Family Practice, 31(3), 325-332.
- Guttman, L. (1945) A basis for analyzing test-retest reliability. Psychometrika, 10(4), 255-282.
- Hemingway, H., Nicholson, A., & Marmot, M. (1997). The impact of socioeconomic status on health functioning as assessed by the SF-36 questionnaire: The Whitehall II study. American Journal of Public Health, 87(9), 1484-1490.
- Hertzsch, H. (2012). Zur Kommunikationskompetenz von schulischen Führungskräften: Konzeptuelle Fundierung, Entwicklung und Validierung eines Messinstruments (Doctoral dissertation). Retrieved from https://www.researchgate.net/profile/Helen_Hertzsch/publication/256374744_Zur_Kommunikationskompetenz_von_schulischen_Fuhrungskraften/links/0c960522632c9ca886000000.pdf
- Heß, P. (2015). Scrum and self-control: How a team-based software development methodology can support team members’ self-control (Doctoral dissertation). Retrieved from http://archiv.ub.uni-heidelberg.de/volltextserver/20067/1/Scrum_and_Self-Control__Dissertation_Hess_2015.pdf
- Kam, C. (2013). Probing item social desirability by correlating personality items with Balanced Inventory of Desirable Responding (BIDR): A validity examination. Personality and Individual Differences, 54(4), 513–518.
- Liebig, S., May, M., Sauer, C., Schneider, S., & Valet, P. (2015). How much inequality of earnings do people perceive as just? The effect of interviewer presence and monetary incentives on inequality preferences. Methods, Data, Analyses, 9(1), 57-86.
- Linnhoff, D. (2015). Messung von Wettbewerbsorientierung als Persönlichkeitsmerkmal im Sport: Evaluation der deutschen Übersetzung des Competitiveness Index Revised (CIR) (Bachelor thesis). Retrieved from http://dx.doi.org/10.13140/RG.2.1.1010.5767
- Loken, E., & Gelman, A. (2017). Measurement error and the replication crisis: The assumption that measurement error always reduces effect size is false. Science, 355(6325), 584-585.
- Mallinckrodt, B., Miles, J. R., Bhaskar, T., Chery, N., Choi, G., & Sung, M.-R. (2014). Developing a comprehensive scale to assess college multicultural programming. Journal of Counseling Psychology, 61(1), 133-145.
- McCrae, R. R., Kurtz, J. E., Yamagata, S., & Terracciano, A. (2011). Internal consistency, retest reliability, and their implications for personality scale validity. Personality and Social Psychology Bulletin, 15(1), 28-50.
- Naef, M., & Schupp, J. (2009a). Can we trust the trust game? A comprehensive examination (Discussion paper no. 2009-5). London, UK: Royal Holloway College. Retrieved from https://www.royalholloway.ac.uk/Economics/Research/WorkingPapers/PDF/dpe0905.pdf
- Naef, M., & Schupp, J. (2009b). Measuring Trust: Experiments and Surveys in Contrast and Combination (IZA discussion papers no. 4087). Bonn, Germany: Institute of Labor Economics. Retrieved from https://www.econstor.eu/bitstream/10419/35525/1/598977201.pdf
- Paulhus, D. L. (1984). Two-component models of socially desirable responding. Journal of Personality and Social Psychology, 46(3), 598-609.
- Paulhus, D. L. (1991). Measurement and control of response bias. In J. P. Robinson, P. R. Shaver, & L. S. Wrightsman (Eds.), Measures of Personality and Social Psychological Attitudes (pp. 17-59). San Diego, CA: Academic Press, Inc.
- Paulhus, D. L. (2002). Socially desirable responding: The evolution of a construct. In H. I. Braun, D. N. Jackson, & D. E. Wiley. (Eds.), The Role of Constructs in Psychological and Educational Measurement (pp. 49-69). Mahwah, NJ: Erlbaum.
- Paulhus, D. L., & John, O. P. (1998). Egoistic and moralistic biases in self-perception: The interplay of self-deceptive styles with basic traits and motives. Journal of Personality, 66(6), 1025-1060.
- Paulhus, D. L., & Trapnell, P. D. (2008). Self-presentation of personality: An agency-communion framework. In O. P. John, R. W. Richard, & L. A. Pervin (Eds.), Handbook of Personality: Theory and Research, 3rd ed. (pp. 492-517). New York, NY: Guilford Press.
- Polit, D. F., Beck, C. T., & Owen, S. V. (2007). Is the CVI an acceptable indicator of content validity? Appraisal and recommendations. Research in Nursing & Health, 30(4), 459-467.
- Rammstedt, B. (2010). Reliabilität, Validität, Objektivität. In C. Wolf & H. Best (Eds.), Handbuch der sozialwissenschaftlichen Datenanalyse (pp. 239-258). Wiesbaden, Germany: VS.
- Schmitt, N. (1996). Uses and abuses of coefficient alpha. Psychological Assessment, 8(4), 350-353.
- Schnapp, P., & Suhr, R. (2017). The Berlin Scales for Measuring Doctors’ Attitudes and Confidence with Respect to Abuse and Neglect of their Patients in Need of Long-term Care (BEACON). Unpublished manuscript.
- Schneider, F., Maier, M., Lovrekovic, S., & Retzbach, A. (2015). The Perceived Leadership Communication Questionnaire (PLCQ): Development and validation. The Journal of Psychology, 149(2), 175–192.
- Schneider, S., & Schupp, J. (2014). Individual differences in social comparison and its consequences for life satisfaction: Introducing a short scale of the Iowa–Netherlands comparison orientation measure. Social Indicators Research, 115(2), 767-789.
- Seifried, S. (2015). Einstellungen von Lehrkräften zu Inklusion und deren Bedeutung für den schulischen Implementierungsprozess – Entwicklung, Validierung und strukturgleichungsanalytische Modellierung der Skala EFI-L (Doctoral dissertation). Retrieved from https://opus.ph-heidelberg.de/frontdoor/index/index/docId/140
- Shajek, A. (2007). Entwicklung zweier Kurzskalen zur Messung von Machiavellismus und Egoismus: Dokumentation eines Instrumententests auf Basis des SOEP-Pretests 2006 (Research Notes 22). Berlin, Germany: DIW. Retrieved from http://www.diw.de/documents/dokumentenarchiv/17/61967/rn22.pdf
- Sijtsma, K. (2009). On the use, the misuse, and the very limited usefulness of Cronbach’s Alpha. Psychometrika, 74(1), 107-120.
- Stanton, J. M., Sinar, E. F., Balzer, W. K., & Smith, P. C. (2002). Issues and strategies for reducing the length of self-report scales. Personnel Psychology, 55(1), 167-194.
- Statistisches Bundesamt (2017). Ärztinnen/Ärzte sowie Psychotherapeutinnen/-therapeuten der vertragsärztlichen Versorgung, u. a. nach Arztgruppen. Retrieved from http://www.gbe-bund.de/gbe10/express.prc_expr?p_aid=28405638&p_uid=gasts&p_sprachkz=D&p_var=0&nummer=305&p_indsp=&p_ityp=H&p_hlpnr=4&p_lfd_nr=2&p_sprache=D&p_news=N&p_janein=J
- Steiger, J. H. (1980). Tests for comparing elements of a correlation matrix. Psychological Bulletin, 87(2), 245-251.
- Streiner, D. L. (2003). Starting at the beginning: An introduction to coefficient alpha and internal consistency. Journal of Personality Assessment, 80(1), 99-103.
- Stöber, J., Dette, D. E., & Musch, J. (2002). Comparing continuous and dichotomous scoring of the Balanced Inventory of Desirable Responding. Journal of Personality Assessment, 78(2), 370-389.
- Tondello, G. F., Wehbe, R. R., Diamond, L., Busch, M., Marczewski, A., & Nacke, L. E. (2016). The gamification user types Hexad scale. In Proceedings of the 2016 Annual Symposium on Computer-Human Interaction in Play (pp. 229-243). New York City, NY: ACM.
- Tourangeau, R, & Yan, T. (2007). Sensitive questions in surveys. Psychological Bulletin, 133(5), 859-883.
- Trapnell, P. D., & Paulhus, D. L. (2012). Agentic and communal values: Their scope and measurement. Journal of Personality Assessment, 94(1), 39-52.
- van de Mortel, T. F. (2008). Faking it: Social desirability response bias in self-report research. Australian Journal of Advanced Nursing, 25(4), 40-48.
- Winkler, N., Kroh, M., & Spiess, M. (2006). Entwicklung einer deutschen Kurzskala zur zweidimensionalen Messung von sozialer Erwünschtheit (Discussion Paper No. 579). Berlin, Germany: DIW. Retrieved from https://www.diw.de/documents/publikationen/73/44281/dp579.pdf
-
Keywords
calibration CATI coverage coverage bias cross-national surveys data linkage data quality European Social Survey experiment face-to-face face-to-face survey Facebook hard to reach populations incentives item nonresponse measurement measurement error mixed-mode surveys multitasking non-probability samples Nonresponse nonresponse bias nonresponse rates paradata PIAAC Probability sample probability samples QR codes rare populations response rate Satisficing social desirability Social media survey survey-taking climate survey data survey management survey methods Telephone survey telephone surveys total survey error unit nonresponse validity web survey Web surveys weighting
