

‘Don’t Know’ Responses to Survey Items on Trust in Police and Criminal Courts: A Word of Caution
Callens M. & Loosveldt, G. (2018): ‘Don’t Know’ Responses to Survey Items on Trust in Police and Criminal Courts: A Word of Caution. Survey Methods: Insights from the Field. Retrieved from https://surveyinsights.org/?p=9237
© the authors 2018. This work is licensed under a Creative Commons Attribution 4.0 International License (CC BY 4.0) 
Abstract
In 2010 the European Social Survey included a module on public trust in national police and criminal courts. The included questions were especially susceptible to item nonresponse. This study examines the interviewer and country variability in responding “I don’t know” to these questions using a beta-binomial logistic mixed model, controlling for demographic background variables. The results show that there are large differences between interviewers and countries which are not due to underlying demographic differences between the respondents. The difference in data quality between interviewers and countries make (inter)national comparisons more difficult. More importantly, we could assume that these missing values could be avoided with sound data collection methods and interviewer trainings.
Keywords
interviewer variance, item nonresponse, trust in justice, trust in police
Copyright
© the authors 2018. This work is licensed under a Creative Commons Attribution 4.0 International License (CC BY 4.0)
Introduction
The notion of public trust in public institutions has gained the attention of policymakers and academics over the past decades. The trust of the public in its governing institutions is being recognized as an important requirement for a well governed society, since a lack of trust may for instance reduce support for government action (Chanley et al., 2000). For the particular institutions of the criminal justice system such as the police and the criminal courts this translates into the belief that public trust could improve the success of criminal policies, by increasing law abidance, cooperation with law enforcement, and efficacy of law enforcement efforts (Bridenball & Jesilow, 2008). Moreover, it has been suggested that such a normative approach to citizens’ trust and legitimacy is more durable and less costly to society than a coercive approach by means of deterrence and punishment (Jackson et al., 2009).
To empirically back up these insights on governing for a safer society it becomes important to measure whether citizens trust institutions of criminal justice and confer it with the legitimacy it needs to exist and operate effectively (Jackson et al., 2009). This can be combined with possible correlates of these indicators such as perceived effectiveness, perceived fairness, cooperation with the authorities, and compliance with the law. A major effort in quantifying trust in justice and its possible correlates in a European context was made by the European Social Survey (ESS) by including in its 5th round (2010) a one-time module on trust in the police and the criminal courts. The resulting cross-national data can be used to address different research questions about attitudes and behaviour towards the criminal justice chain, and their variation across countries.
However, meaningful cross-national comparisons can be hampered when data of different countries are not of comparable quality (Couper & De Leeuw, 2003). Country data can differ in quality due to varying influences of survey error such as sampling error, interviewing error, translation error, or cultural differences (Fitzgerald et al., 2011). This can, among other things, cause an increase in less substantive answers to certain items in different forms, such as an increase in choosing the middle category or in refusals to answer particular questions. This article focusses on the occurrence of don’t know responses as a data quality indicator. The aim is to examine the differences between interviewers and countries regarding this type of non-substantive answers on the questions about trust in the police and criminal courts. It is clear that significant difference between interviewers and countries can be considered as an indication of poor data quality which does not contribute to the comparability of countries.
Item Nonresponse
Item nonresponse occurs when you fail to obtain a substantive answer to a question. Item nonresponse can present itself in different forms, the ESS for instance employs four different codes for item nonresponse: ‘don’t know’, ‘refusal’, ‘not applicable’ and ‘no answer’ (Norwegian Social Science Data Services, 2010a). We don’t take all of them into account together because different forms of item nonresponse are generally caused by different sources, and can differ in randomness and their potency to cause bias (Shoemaker et al., 2002). Therefore the different types of item nonresponse are best studied separately.
In what follows, the focus goes to the ‘don’t know’ response category (hereafter: DK or DK’s) which was by far the most prevalent form of item nonresponse in the module about trust in the police and criminal courts. An ‘I don’t know’ response can cover a variety of meanings: from utter lack of interest, over a carefully considered but inconclusive debate between different response categories, to a refusal to reveal sensitive or controversial opinions (Carnaghan, 1996). Notice that a DK response is not necessarily a ‘bad’ answer, it can also be an expression of a ‘true’ answer. It is therefore not always advisable and necessary to reduce DK responses. However, the DK’s originating from an unwillingness to reveal an answer or a lack of effort to formulate a true opinion should be reduced to a minimum.
The prevention of a DK answer is advisable since these values cannot be used in substantial analysis. A DK value does not follow the logic of an ordinal or continuous response scale and should be coded as a missing value. This poses an important threat to the quality of survey data and the conclusions drawn from their analysis for several reasons (Shoemaker et al., 2002). First, the missing values cause a decrease of available information for analysis, which consequently results in less precise estimations of the population parameters and a reduction of statistical power. Second, the missing values can take on a non-random pattern in the sense that certain categories of respondents are missing more often than others which defies the purpose of a random sampling technique. Inferences about the population then become less valid due to the bias created by the misrepresentation of the population because of selective item nonresponse (Bethlehem, 2009). When the amount and randomness of missingness also differ across countries, cross-national comparisons could be flawed. Item nonresponse can be especially problematic in small samples, but also in large samples when different segments need to be analysed separately (Pauwels & Svensson, 2008). It is generally accepted that when item nonresponse on a variable is higher than five percent, and when item nonresponse is not completely random, correction for item nonresponse should be considered for univariate or multivariate analysis (Little & Rubin, 2002). For an overview of the possible ways of dealing with item nonresponse, we refer the reader to Hox (1999) and De Leeuw et al. (2003). However, correction methods all carry with them their own flaws, and prevention should always be the first strategy to dealing with nonresponse (De Leeuw et al., 2003).
Because the module on trust in police and justice includes sensitive, complex, and unfamiliar topics compared to the other modules on everyday topics such as work, family, and wellbeing it can be expected that it was particularly susceptible to receiving item nonresponse (Tourangeau & Yan, 2007). Moreover, since the organisation of the ESS fieldwork is left to the responsibility of each individual country, some differences in DK’s per country could also be expected. Each country has a different capacity to execute surveys and applies different survey practices. For example, there was a division between the countries in terms of using CAPI (computer assisted personal interviewing) or PAPI (paper and pencil interviewing) modes of surveying, which has been found to have an effect on item nonresponse (Koch & Blohm, 2009). Countries might also differ in the training of the interviewers and in the specific instructions about how to deal with DK answers, and the selection process of interviewers based on their experience and motivation. Interviewers can either interfere or support the standard survey response process (Tourangeau et al., 2000), influencing the formulation of a respondent’s true opinion. Previous research (Pickery & Loosveldt, 2001) shows significant interviewer effects on item nonresponse for different types of questions (e.g. income question, party preference, statements about government’s policy).
In this article the variance in DK responses between interviewers and countries is examined for the ESS module on trust in the police and courts, to examine whether there is indeed an item nonresponse problem at hand. In general significant differences between countries or interviewers can be considered as a non-random pattern of item nonresponse that must be taken into account during the analysis of the substantive variables. The examination will inform researchers working with this ESS module about the quality of these data and the need to deal with the missingness in comparative research. Furthermore, it offers added knowledge to the causes of item nonresponse, aiding development of further prevention strategies for item nonresponse for sensitive questions.
Methodology
Dataset
This study focuses on the European Social Survey (ESS) round 5, administered in 2010 (Norwegian Social Science Data Services, 2010b). The data is freely available on the ESS website and comes with extensive methodological documentation. The ESS is a biennial cross-sectional, cross-national survey, which covered 27 countries in the fifth round. A one-hour long face-to-face interview included around 120 questions on a variety of core topics repeated each round and two rotating modules. The module on trust in police and the criminal courts was one of these rotating modules and was developed by academics involved in a European Commission project, JUSTIS, which intended the design and piloting of indicators of trust in justice (Jackson et al., 2009).
The target population in each country consisted of all persons aged 15 and over, resident within private households. The national sample sizes ranged between about 1000 interviews to about 3000 interviews. In total, the dataset of round 5 contains information on 52458 respondents. The module on trust in the police and criminal courts consisted of 45 questions covering topics such as overall confidence in the police and the criminal court or perceived effectiveness of the police and the criminal court[1].
The interviewers were instructed to assign a ‘don’t know’ when a respondent is unable to respond due to a lack of opinion or knowledge. This option was not openly offered to the respondents, which is already an important strategy in decreasing the prevalence of DK. The average % of ‘don’t knows’ answers to the individual items of the module on trust in justice equals 5.2%. This is the highest level of DK answers compared to the other modules in the questionnaire (see Figure 1), which points out this module was indeed particularly sensitive to the problem of item nonresponse. It exceeds the suggested threshold of 5% missing values. When this missingness also turns out to be non-randomly distributed between respondents, interviewers, and countries there is a clear indication that researchers using these data should opt for adjustment techniques before performing substantial analysis (Little & Rubin, 2002; Schafer, 1999).
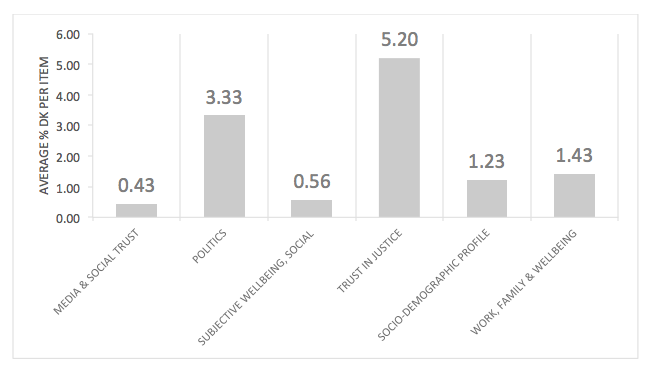
FIGURE 1 Average % of ‘don’t knows’ answers to the individual items from six modules of ESS5 showing the especially high % for the module on trust in justice
Dependent Variable
The outcome variable is represented by the proportion of questions a respondent gave a DK response to throughout the 45 questions of the module on trust in justice. This is a question-level aggregated score, and lies at the respondent level. The outcome has a value range between 0 and 1, and should be appreciated as a proportion stemming from a limited number of trials, namely the 45 module questions. The distribution of the outcome variable reveals that it is extremely skewed (see Figure 2), with almost half of the respondents never using the DK category throughout the module. This zero-inflation will be accounted for in the analysis.
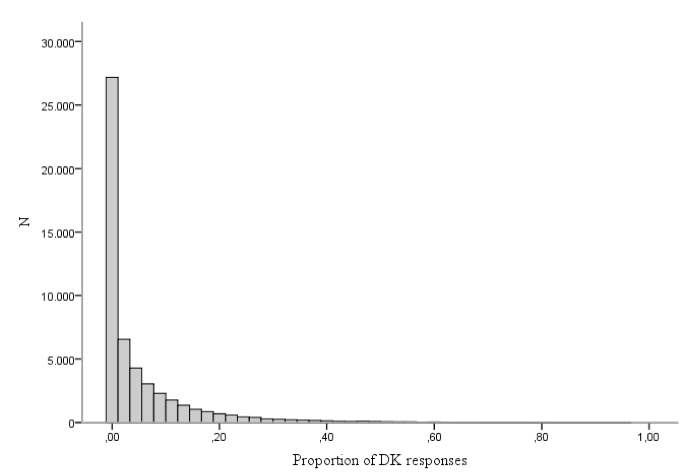
FIGURE 2 Distribution of the outcome variable on individual level showing the zero-inflation of the dependent variable
Independent Variables
Four individual level variables are included as control variables: age, education, gender, and political interest. Age, in years, is included as a continuous variable and education, comprising 7 categories, is also treated as a continuous variable. The other two variables are categorical: gender (1 = male, 0 = female) and political interest (1 = very interested, 2 = quite interested, 0 = hardly interested, 3 = not at all interested). Note that for categorical variables the most common category is coded as the base category, and continuous variables are centred around the mean, making the intercept the most common profile in the dataset (as suggested by Hox, 2010). To check whether part of the country variation in DKs can be explained by a West/East duality, a newly created binary variable for geopolitical position was included as a country level variable based on the United Nations Regional Groups: Western Europe versus Eastern Europe & Cyprus (Cyprus actually belonging to the Asia-Pacific Group) (United Nations, 2014).
Analytical Technique
A beta-binomial logistic mixed model with three analytical levels (i.e. respondent, interviewer, and country) is modelled (Hilbe, 2011). Analogical to the standard linear regression model being based on the Gaussian probability distribution function a binomial response model is derived from a binomial distribution, with the binomial denominator taking the value of the number of trials. In the current application the number of trials equals the number of questions we used to evaluate the item nonresponse. Random intercepts are considered at interviewer and country level to estimate the variation at each level. Beta-binomial variation was taken into account to correct for possible overdispersion in the distribution of the response variable, given the zero-inflation (see Hilbe (2011) for a detailed description of the beta-binomial model). MLwiN 2.26, using an IGLS (iterative generalised least squares) estimation method, of the PQL2 (penalized quasi likelihood with second order linearization) (Rodriguez and Goldman, 2001).
The predictors are added block-wise at the respondent and country level to also examine the amount of DK variability explained by the added variables. The model is a purely hierarchical one, where a respondent belongs to one (and only one) interviewer, and an interviewer belongs to one (and only one) country. The dataset contains data on 52458 respondents, nested within 3884 interviewers, nested within 27 countries. The design weights were used in the analysis[2].
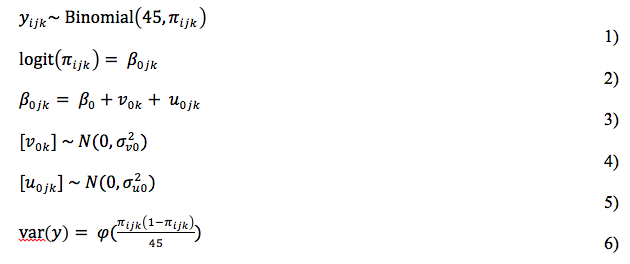
Below the mathematical representation of the base-model is specified. The dependent variable yijk (= the proportion DK of respondent i, interviewed by interviewer j, and living in country k) is specified to come from a binomial distribution of 45 trials (=questions), with an underlying probability of a DK in one trial of πijk. The logit (log-odds) of the underlying probability is related to an overall fixed effect β0; an effect u0jkthat can vary over interviewers and effect v0kthat can vary over countries The interviewer effect (u0jk) and country effect (v0k) are assumed to come from a normal distribution and a scale parameter ϕ is estimated to account for the overdispersion:
Results
The Base-model
The base-model or null model, which does not include any explanatory variables, contains a random intercept on interviewer and country level to check whether there is significant higher-level variation. The estimated log-odds are displayed in Table 1, model 1.
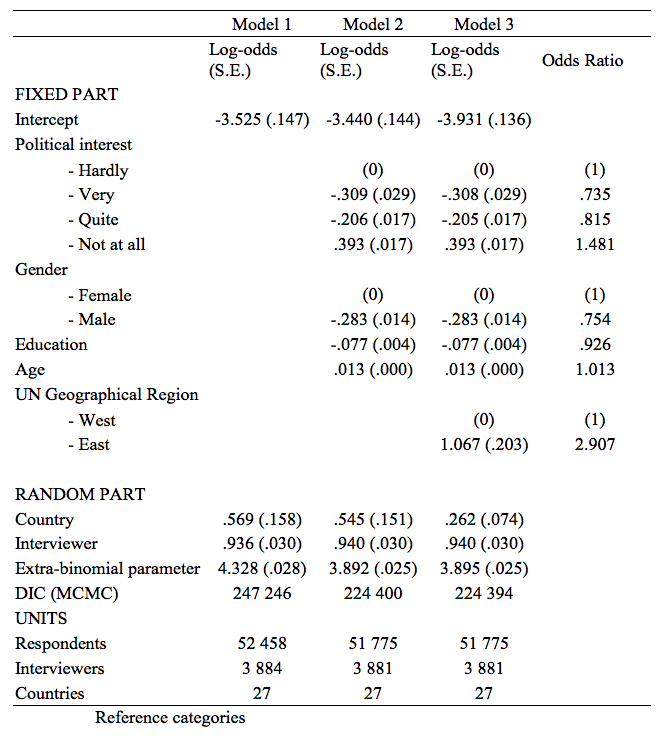
TABLE 1: Results from the null model, the individual-level model and the combined individual-level & country-level model predicting the probability of answering ‘I don’t know’ (all effects are significant on p<.001)
These log-odds are as such less informative and are therefore transformed to probabilities. Note that due to the very large sample size even extremely small effects turn out to be significant. Therefore the attention should go to the substantial significance relative to the scale of the outcome variable, namely probability. To get a grasp on the size of the effects, the parameters are transformed from log-odds to percentage differences (Alba, 1987). Such a transformation makes a substantive interpretation easier.
The results of the random part of the model clearly indicate that the probability of DK varies between interviewers and between countries. The variance between interviewers is larger than the variance between countries. To get a feel of the size of the differences between interviewers and countries we assume that these interviewer and country effects come from a normal distribution (an assumption that cannot be tested as such (Verbeke & Lesaffre, 1997)). This makes it possible to derive 95% coverage bounds[3]. The ‘best’ interviewer in this interval has on average only a .005 probability of receiving a DK response to an item in the module, while the ‘worst’ interviewer in this interval has an average probability of .177. Given there are 45 questions in the module this means that 95% of the interviewers will receive between 0.2 and 8 DK’s throughout the module. Concerning the variance between countries this 95% coverage interval ranges from a proportion of .007 to .115 of DK responses. As such 95% of the countries receive an average amount of DK’s between 0.3 and 5. These large variations leave us with the conclusion that a three level model is useful to analyse this data. Also, the extra-binomial term is far greater than 1, which means there is significant over-dispersion for the respondent variation, making it relevant to retain the term in the model instead of turning to a conventional negative binomial model (Hilbe, 2011).
Receiving higher or lower amounts of DK’s does not necessarily reflect on the quality of the data-collection methods applied by the individual interviewer or within a country, since differences could be attributable to a difference in the types of respondents that interviewers encounter or that reside in a country. Therefore demographic control variables will be added to the model to see whether the variance still remains present.
The Random Intercepts Model With Respondent and Country Variables
In a second step the base model is complemented with gender, age, education, and political interest at the respondent level and in step three the UN regional group variable is added at the country level. Since these models do not deliver an adequate measure for goodness of fit (Jones and Subramanian, 2011), we evaluate the model fit by running an additional Markov Chain Monte Carlo (MCMC) estimation of the model which produces a goodness of fit parameter: the Bayesian DIC (deviance information criterion) (Browne, 2009). The model with the lowest DIC is considered the `best’ model.
The model in step three is a better fitting model when we look at the Bayesian DIC. The linear logit effects are presented in Table 1, model 2 & 3. The logit effects of this model are transformed to odds ratio’s by taking the exponent of the effect, which are also listed in Table 1. The overall intercept is the log-odds of responding with a DK for the most prevalent profile in the sample of respondents: a 48 year old female, with an average educational level (≈ upper secondary), with hardly any political interest, from a Western country. A higher probability to give a DK answer is associated with a lower political interest, a lower education, a higher age, and being female. The difference related to the region is large, where the odds of a DK increased by a factor of 2.8 for the Eastern European region compared to the Western European region. This will result in a serious increase in missing values for the Eastern European respondents and could endanger inferences about the entire European population or comparisons between Western and Eastern countries.
By adding the demographic control variables to the base model the variance between the interviewers has not decreased. Therefore, differences between interviewers cannot be explained by the differences in types of respondents they interview with respect to age, gender, education, or political interest. The variance between the countries is only slightly reduced by adding the demographic control variables, but is reduced by more than half in model 3, which means that a considerable part of the differences between countries can be explained by a distinction between Eastern and Western countries.
Conclusion
In this article the interviewer and country variation in the probability of receiving a don’t know response was evaluated for the module on trust in the police and the criminal courts of the fifth round of the European Social Survey. The results show that the questions in this module are especially affected by the problem of unsubstantive answers, with an average proportion of Don’t Knows of 5.2%. This considerable amount of missingness not only reduces the sample size when these items are used in an analysis but it can also introduce biased estimations.
The analysis also made clear that the probability to respond with “I don’t know” differs depending on by which interviewer or in which country the respondent is surveyed. Excluding possible outliers it is observed that certain interviewers receive near zero DK responses while others receive up to 8 DK’s out of 45 questions on average, while a well performing country will receive only 0.3 DK’s from its respondents and a bad performing one will receive 5 on average. Although background characteristics of the respondents affect this probability, the variance in DK percentages between interviewers cannot be explained by these demographic differences and neither could country variance. This means that for example a difference in level of education between certain countries cannot explain whether more or less DK’s will be received in that country. Therefore, the differences are likely due to differences between interviewers in the way they react on DK responses, possibly related to the level of experience or training of individual interviewers. It is possible that the differences between interviewers are confounded with area or special effects. After all, interviewers are working within particular area and the respondents are not only nested within interviewers but also clustered within area. This could result in an overestimation of the interviewer effects in certain countries. However research to disentangle interviewer effects and area effects shows that interviewer effects are more powerful and stronger than area effects (e.g. Schnell and Kreuter 2005).
The between country variance in propensity to receive a DK response could be partially explained by UN classification of European regions to the model, which explained more than half of the variance on country level. Coincidentally, there is a very high correlation between this geo-political identifier and the mode of administration, where Western European countries use the CAPI method and Eastern European countries use predominantly the PAPI method. Therefore, it becomes again likely that differences in best practices for ESS survey administration play their part. This suggests that with introducing CAPI in all countries a large amount of DK responses could probably be avoided.
If our deductions hold true it would be advisable that the different countries exchange best practices for reducing item nonresponse, and that steps are taken to converge the data gathering practices, interviewer training and instructions in the different countries, to achieve comparable data quality. Even though much attention now goes to the development of better ways to deal with missing data through, for example, complex imputation methods, while the prevention of missing data receives less attention. With this note of caution we hope that new attention is brought to this ‘preventive’ aspect of data collection, and that good quality data collection procedures are not neglected, since data correction methods can never give better quality to the data than when the data is collected first hand from the respondent. Furthermore, those who study the topic of trust in police and justice should be cautious when employing the round 5 data of the ESS. When the aim of the study is cross-national comparison of trust in police and justice, one should be aware that selective and substantial loss of information in certain countries could hinder meaningful comparisons.
Endnotes:
[1] In detail the questions cover: personal morality, perceived risk of sanction, overall confidence in the police, contact with the police, trust in police distributive fairness, trust in police effectiveness, trust in police procedural fairness, police legitimacy: obligation to obey the police, police legitimacy: moral alignment with the police, perceived legality of police action, overall confidence in the courts, trust in court effectiveness, trust in court procedural fairness, trust in court distributive fairness, perceived legality of court action, legitimacy of the courts and law: obligation to obey the law and court decisions, attitudes towards punishment, public cooperation with the police and courts, and compliance with the law.
[2] The design weight corrects for the different probabilities of selection, thereby making the sample more representative of a true sample of the population in each country. They are computed as normed inverse of the inclusion probabilities. All our results are based on data weighted with these ESS design weights delivered with the data file. The raw weights are standardised since including them as “raw” weights results in biased parameters and standard errors (Carle, 2009).
[3] This is done by running a simulation where 2 million cases are drawn from the estimated probability distribution given the various estimated variances. The 95% tails will be found by ranking all the draws and finding the value that is placed in the position 2.5% from the bottom and the top.
References
- Alba RD (1987) Interpreting the Parameters of Log-Linear Models. Sociological Methods Research 16(1): 45–77.
- Bethlehem, J. (2009). Applied survey methods: A statistical perspective. Hoboken, NJ, USA: John Wiley & Sons, Inc. http://doi.org/10.1002/9780470494998.ch9
- Bridenball, B., & Jesilow, P. (2008). What matters: The formation of attitudes toward the police. Police Quarterly, 11(2), 151–181. http://doi.org/10.1177/1098611107313942
- Carle, A. C. (2009). Fitting multilevel models in complex survey data with design weights: Recommendations. BMC Medical Research Methodology, 9(49).
- Carnaghan, E. (1996). Alienation, apathy, or ambivalence? “Don’t knows” and democracy in Russia. Slavic Review, 55(2), 325–363.
- Chanley, V. A., Rudolph, T. J., & Rahn, W. M. (2000). The origins and consequences of public trust in government: A time series analysis. Public Opinion Quarterly, 64(3), 239–256. http://doi.org/10.1086/317987
- Couper, M. P., & De Leeuw, E. D. (2003). Nonresponse in cross-cultural and cross-national surveys. In J. A. Harkness, F. J. R. van de Vijver, & P. Mohler (Eds.), Cross-cultural survey methods (pp. 157–177). Hoboken, NJ: John Wiley.
- De Leeuw, E. D., Hox, J. J., & Huisman, M. (2003). Prevention and treatment of item nonresponse. Journal of Official Statistics, 19(2), 153–176.
- Fitzgerald, R., Widdop, S., Gray, M., & Collins, D. (2011). Identifying sources of error in cross-national questionnaires: Application of an error source typology to cognitive interview data. Journal of Official Statistics, 27(4), 569–599.
- Hilbe, J. M. (2011). Negative binomial regression (2nd ed.). Cambridge: Cambridge University Press.
- Hox, J. J. (1999). A review of current software for handling missing data. Kwantitatieve Methoden, 62, 123–138.
- Hox, J. J. (2010). Multilevel analysis: Techniques and applications (2nd ed.). Routledge.
- Jackson, J., Hough, M., Farrall, S., de Keijser, J., & Kauko, A. (2009). Round 5 Trust in the police & courts – Final module in template.
- Koch, A., & Blohm, M. (2009). Item nonresponse in the European Social Survey. Ask. Research & Methods, 18(1), 45–65.
- Little, R. J. A., & Rubin, D. B. (2002). Statistical analysis with missing data (2nd ed.). Hoboken, New Jersey: Wiley.
- Norwegian Social Science Data Services. (2010a). ESS 2010 Data protocol edition 2.4. Norwegian Social Science Data Services.
- Norwegian Social Science Data Services. (2010b). ESS Round 5: European Social Survey Round 5 Data. In Data file edition 3.0. Norway: Data Archive and distributor of ESS data.
- Pauwels, L., & Svensson, R. (2008). How serious is the problem of item nonresponse in delinquency scales and aetiological variables? A cross-national inquiry into two classroom PAPI self-report studies in Antwerp and Halmstad. European Journal of Criminology, 5(3), 289–308. http://doi.org/10.1177/1477370808090833
- Pickery J., Loosveldt G. (2001). An exploration of question characteristics that mediate interviewer effects on item nonresponse. Journal of Official Statistics, 17 (3), 337-350.
- Rodriguez G and Goldman N (2001) Improved Estimation Procedures for Multilevel Models with Binary Response: A Case-Study. Journal of the Royal Statistical Society Series A Statistics in Society, Wiley Online Library 164(2): 339–355.
- Schafer, J. L. (1999). Multiple imputation: A primer. Statistical Methods in Medical Research, 8(1), 3–15. http://journals.sagepub.com/doi/abs/10.1177/096228029900800102
- Schnell, R., Kreuter, F. (2005). Separating Interviewer and Sampling-Point Effects. Journal of Official Statistics, 21(3), 389–410.
- Shoemaker, P. J., Eichholz, M., & Skewes, E. A. (2002). Item nonresponse: Distinguishing between don’t know and refuse. International Journal of Public Opinion Research, 14(2), 193–201. http://doi.org/10.1093/ijpor/14.2.193
- Tourangeau, R., Rips, L. J., & Rasinski, K. (2000). The Psychology of Survey Response. Cambridge University Press.
- Tourangeau, R., & Yan, T. (2007). Sensitive questions in surveys. Psychological Bulletin, 133(5), 859–883.
- United Nations. (2014). United Nations Regional Groups of Member States. Retrieved from http://www.un.org/depts/DGACM/RegionalGroups.shtml
- Verbeke, G., & Lesaffre, E. (1997). The effect of misspecifying the random-effects distribution in linear mixed models for longitudinal data. Computational Statistics & Data Analysis, 23(4), 541–556. http://dx.doi.org/10.1016/S0167-9473(96)00047-3
-
Keywords
calibration CATI coverage coverage bias cross-national surveys data linkage data quality European Social Survey experiment face-to-face face-to-face survey Facebook hard to reach populations incentives item nonresponse measurement measurement error mixed-mode surveys multitasking non-probability samples Nonresponse nonresponse bias nonresponse rates paradata PIAAC Probability sample probability samples QR codes rare populations response rate Satisficing social desirability Social media survey survey-taking climate survey data survey management survey methods Telephone survey telephone surveys total survey error unit nonresponse validity web survey Web surveys weighting
