

Integration of Migrant Populations into Health Monitoring in Germany: Results from a Feasibility Study
Zeisler, M.L. & Lemcke J. et al. (2019): Integration of migrant populations into health monitoring in Germany. Results from a feasibility study. Survey Methods: Insights from the Field. Retrieved from https://surveyinsights.org/?p=10780
© the authors 2019. This work is licensed under a Creative Commons Attribution 4.0 International License (CC BY 4.0) 
Abstract
Background: Persons with migrant backgrounds (PMB) are considered ‘hard to reach’. To sustainably integrate migrant populations into health monitoring in Germany, the Robert Koch Institute (RKI) has launched the project Improving Health Monitoring in Migrant Populations (IMIRA), providing results on response rates, sample composition and the effectiveness of sequential interventions. Method: A multilingual feasibility study had been conducted in two German federal states, utilizing data from the residents’ registry. The target populations were persons with Turkish, Polish, Romanian, Syrian and Croatian citizenship living in Germany (n=9,068). Different modes of administration and interventions (study hotline, home visits) were used sequentially. To evaluate their usability, an experimental design was applied for Turkish and Syrian migrants. Results: Besides the overall response rate of 15.9%, there were different response rates by citizenship, ranging from 8.6% in the Turkish group to 24.3% in the Syrian group. Whereas the online mode, telephone mode and the study hotline showed little differences between the groups, the home visits led to an remarkable increase (+5.4% in the Turkish group; +7.3% in the Syrian group). Conclusion: The offer of multilingual survey modes and materials is strongly advised. Furthermore, the response rates of some PMB can be increased by tailored interventions, such as home visits and multilingual face-to-face interviews.
Keywords
feasibility study, health monitoring, recruitment strategies, sequential mixed-mode-survey, surveying migrants
Acknowledgement
The authors wish to send out a special thanks to the participants for taking time to participate in the IMIRA survey; the interviewers and project management team at USUMA GmbH for implementing the field work; and all of our colleagues at Robert Koch Institute, for supporting the IMIRA survey. The IMIRA project is funded by the German Ministry of Health (Grant Number: ZMVI1-2516FSB408).The feasibility survey was approved by the ethics committee at Charité Berlin (EA1/210/17) and was conducted in compliance with data protection and privacy regulations, as requested by the Federal Commissioner for Data Protection and Freedom of Information (13-401/008#0085). Every participant in the survey had to consent to their participation orally or online before each interview. The contents of this publication are solely the responsibility of the authors.
Copyright
© the authors 2019. This work is licensed under a Creative Commons Attribution 4.0 International License (CC BY 4.0)
Introduction
In 2017, 19.3 million (23.6%) people with a migration background (PMB), meaning that they or their parents were born in another country, were living in Germany. This value has increased in recent years (Statistisches Bundesamt, 2017). Within population-wide surveys, PMB generally show lower response rates than persons without migration backgrounds in almost all Western countries (Feskens, 2009). This can lead to a nonresponse bias (Groves & Couper, 1998; Bonevski et al., 2014). Despite the high proportion of the total population in Germany, people with a migration background, especially those who have immigrated themselves, are still under-represented in the nationwide health studies of the Robert Koch Institute (RKI) (Saß, 2015).
In this context, the project ‘Improving Health Monitoring in Migrant Populations’ (IMIRA) was initiated, in which the presented feasibility study was realized. The aims of the IMIRA project were, inter alia:
- To improve the inclusion of migrant populations into health monitoring
- Identification of relevant concepts and indicators regarding migrant health
- To evaluate the usability of additional data sources for health reporting
- To integrate migrant health into regular health reporting
- To extend networking and collaborations with important national and international stakeholders
The objective of the feasibility study was to develop and test an adapted sample and survey design to find out which interventions could improve access and recruitment of specific migrant groups that were previously less well reached. Furthermore, the use of the multilingual questionnaire was tested as well. In this study we will provide results on response rates, sample composition, the effectiveness of sequential interventions and the questionnaire language used in the IMIRA feasibility study. Following this we will answer these main research questions: Are the implemented study interventions effective to increase the overall response rate? How do these specific interventions and different survey modes affect the sample composition? How many respondents use the multilingual questionnaire and which (sociodemographic) characteristics influence the usage?
Theoretical Background
Research in the area of ‘hard-to-reach’ populations (Tourangeau, 2014) provides a theoretical basis for identifying possible reasons for PMB low participation rates in health studies and for developing specific measures to increase them. Thus, PMB are not necessarily hard to reach, but partly ‘hard to sample’ (Tourangeau, 2014) due to the lack of a suitable representative sample frame. If, e.g., a telephone sampling frame is selected, a screening of the migrant groups of interest is absolutely necessary. Register-based sampling frames (such as the residents’ registries) offer the possibility of drawing persons by citizenship, but this excludes 51% of PMB who have a German citizenship (Statistisches Bundesamt, 2017; Salentin, 2014). Alternatively, onomastic methods can be used to identify PMB within a sample (Wittlif & Beigang, 2016; Brause et al., 2010; Schnell, Trappmann & Gramlich, 2014)). However, these procedures are not equally effective for all migrant groups (Schnell, Trappmann & Gramlich, 2014; Stadler, 2009). In this respect, PMB are partly to be classified as ‘hard to identify’ (Tourangeau, 2014).
PMB can also be ‘hard-to-reach’ in the sense of ‘hard to locate’ or ‘hard to contact’ (Tourangeau, 2014). This applies above all to highly mobile persons, or persons who have recently come to Germany (e.g. refugees) (Tourangeau, 2014).
PMB might be ‘hard to persuade’ (Tourangeau, 2014) because their participation threshold might be higher than that of persons without a migrant background (Schenk & Neuhauser, 2005).This can be related to cultural barriers that prohibit participation in health-related studies, or declare them as an invasion of their privacy.
In addition to the willingness to participate, there is another barrier that PMB might face in health surveys: PMB are ‘hard to interview’ due to language barriers (Tourangeau, 2014). Language barriers can be overcome by translating survey materials and questionnaires (Reiss et al., 2014; Frank et al., 2018; Brücker et al., 2016; Blohm & Diehl, 2001) or by utilizing multilingual interviewers (Brücker et al., 2016). In comparison to self-administered questionnaires, the use of personal or phone interviewers can improve the comprehensiveness of survey instruments, build trust and thus, lead to higher participation rates. Although it is known that the use of translated questionnaires can reduce non-response, it remains unanswered whether this also reduces non-response bias (Blohm & Diehl, 2001).
In the past, the health monitoring of the RKI had already taken measures to improve the integration of migrants into surveys. For example, in the study of the German Health Interview and Examination Survey for Adults (DEGS), people with non-German citizenship were oversampled by a factor of 1.5. However, this approach does not exclude a possible sampling bias (Reiss et al., 2013). Additionally, translated questionnaires were provided (Kamtsiuris et al., 2013). But these measures did not have the desired effect. In particular, people migrating by themselves (1st generation), people with Turkish citizenship and people with low education were still underrepresented (Saß, 2015). In the Examination Survey for Children and Adolescents (KiGGS) (Hoffman et al., 2018; Kamtsiuris, Lange & Rosario, 2007; Lange et al., 2014), a number of measures had been taken to increase the willingness of PMB to participate (in the baseline survey and Wave 2) (Frank et al., 2018). These included onomastic procedures to identify PMB with German citizenship, the provision of multilingual materials and questionnaires, public relations sensitive to migrants, as well as the use of specifically trained staff who conducted home visits to motivate PMB to participate. These measures made it possible to increase the proportion of PMB in the studies so that the proportion was comparable to the results in Microzensus (Saß, 2015). The use of specifically trained staff who conducted home visits to motivate PMB to participate was an especially successful measure that more than doubled the response rate, from 7.9% to 19.0% (Frank et al., 2018). Based on these experiences, the IMIRA project was planned.
Methods
Sampling frame, study design and modes of participation
The feasibility study was carried out in two German federal states, Berlin and Brandenburg, from January to May 2018. We sampled persons with Turkish, Syrian, Romanian, Croatian and Polish citizenship living in Germany. We applied a two-stage sampling approach:
(1) A criteria-based selection of primary sample units (PSU) in Berlin and Brandenburg took place. We chose 5 PSU in Berlin (districts: Mitte, Neukölln, Charlottenburg-Wilmersdorf, Friedrichshain-Kreuzberg and Tempelhof-Schöneberg) and 2 PSU in Brandenburg (Cottbus and Fürstenwalde/Spree) according to their foreigners’ share (in 2016, Berlin had a foreigners’ share of 16.7%, whereas Brandenburg had a foreigners’ share of 4.0%) (Statistik Berlin Brandenburg, 2018). The sample points in Berlin were chosen with regard to the share of foreigners of the respective citizenships in the districts. Districts with the highest foreigner share were selected for the survey. In Brandenburg, a similar procedure was applied on the basis of foreigners’ share in the cities of the different municipalities and with the exclusion of Potsdam, because of its proximity to Berlin.
(2) Persons in the target population were randomly selected using the residents’ registry (Einwohnermeldeamt, EMA). We applied disproportional sex and age strata for sampling. Our gross sample consisted of 9,068 persons (see Table 1 in the appendix for a more detailed description of the gross sample). The implementation of the feasibility study was oriented on the previous procedure of RKI health monitoring studies. Thus the sampling and study design had been adapted to a great extent.
In order to estimate the effect of different interventions, the sample was randomly differentiated into group A and group B. Due to budget limitations, the experimental design was limited to the Turkish and Syrian groups. Whereas the first group, A, received the whole set of new elements in the study design (bilingual study hotline with telephone interviews, bilingual home visits with face-to-face interviews), the second group, B, was exposed to standard interventions only (bilingual cover letter and study information material, multilingual online questionnaire, and a EUR 10.00 shopping voucher as conditional incentive).
The participants were able to take part in the survey online, by telephone or face-to-face if they were assigned to group A (in a sequential Mixed Mode Design). For group B participants, only online participation was offered. In a sequential mixed mode design, we sent out bilingual cover letters. Furthermore, study information material was available in Turkish, Arabic, Romanian, Croatian, Polish and German for the participants in groups A and B. Additionally, a service hotline was set up, which was multilingual in group A and German-only in group B, and was introduced to participants with the initial invitation letter. The purpose of the hotline was to address questions and concerns, as well as refusals. In cases of refusal, the interviewers were trained to attempt to persuade the participants to take part in the survey or at least fill out a short non-response questionnaire. Two reminder letters followed the first invitation, offering a telephone interview (first reminder) and home visits (second reminder; including face-to-face interviews) in group A. For phone and personal interviews, trained interviewers who were native speakers of the respective languages were used. Group B received two reminder letters as well. In the last field phase we extended the possible participation modes with face-to-face interviews or telephone interviews in group A. Due to cost and efficiency reasons this was only offered to the Turkish, Syrian and Romanian group. The subsample for this last phase was randomly drawn from the remaining non-respondents of Turkish, Syrian and Romanian citizenship and divided into two parts: (1) home visits with the possibility of face-to-face interviews; and (2) home visits with the possibility of telephone interviews after handing over the telephone number. Participants received a EUR 10.00 shopping voucher after completing the survey. The questionnaire used in this survey was the European Health Interview Survey (EHIS) (Eurostat, 2013) with additional instruments regarding migration background, religious affiliation, experience of discrimination and subjective social status. This survey design, as just described in detail, is illustrated in Figure 1.
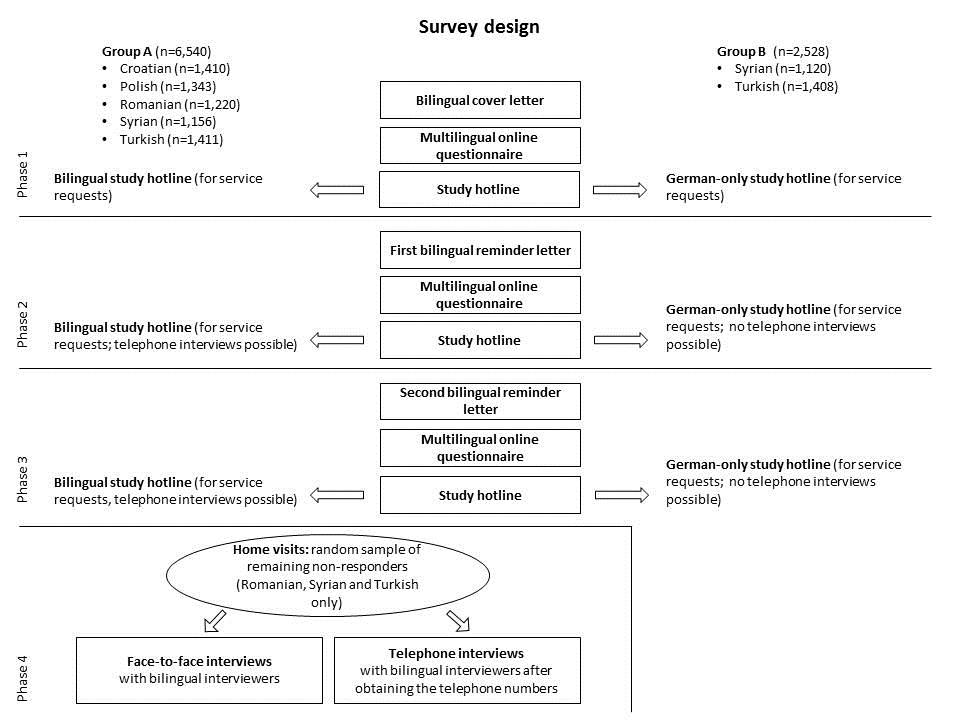
Figure 1: Survey design with field phases; own depiction
Qualitative elements in the study design
In the IMIRA survey, qualitative elements, e.g. focus groups and contact protocols for study hotline and home visits, were implemented in the survey design. The cover letter and information materials of the survey were designed with representatives of the target population in order to make survey participation more attractive and ensure the cultural sensitivity of the survey’s materials. For this reason, this information was provided by a specially recruited focus group convened by a commercial social research company. The results from the focus group will be described elsewhere, but the cover letter and study information materials can be found in the appendix.
Particular importance was attached to the contact reasons, as well. Interviewers should document every contact with the participants within a standardized protocol, focusing on contact frequency, contact person, result of contact, reasons for non-response and information about the language used during contact. Furthermore, the interviewers had the opportunity to add further notes about the contact. At the end of each period, the interviewers participated in a focus group to receive further information and learn about the interviewers’ experiences. The results of the qualitative measures within the IMIRA survey will not be presented in this paper, but will be published elsewhere.
Analytical Technique
To classify the IMIRA survey sample and calculate response rates, we had to define final disposition codes first, which were oriented on the Standard Definitions of the American Association of Opinion Research (AAPOR) (AAPOR 2016). In this survey we calculated the AAPOR Response Rate 1. We calculated descriptive statistics, as well as logistic regression models to describe potential group differences between study design groups A and B. Statistical analyses were conducted using Stata/SE 15.1. P-values at the 5% level and lower were considered to be significant.
The intervention effects were tested parametrically per study phase, applying a logistic regression model for the adjusted gross sample using the data available through the selection frame. We thus estimated the probability of participation in the survey (our dependent variable; 1 = participation in the survey and 0 = no participation), dependent on the determinants in the sample frame. In this analysis we included the Turkish and Syrian respondents only.
To analyse the potential relationship between the used questionnaire language and potential determinants, we estimated a logistic regression model as well.
Results
In this section we will provide the results of the described feasibility study.
Comparison of interventions and the use of multilingual questionnaires
Overall, 1,190 persons participated in the IMIRA survey. Nine hundred fifty-one participants (79.9%) chose to fill out the online questionnaire, 93 participants (7.8%) called for a telephone interview, 100 participants (8.4%) took part in a face-to-face interview and 46 telephone interviews (3.9%) could be realized after collecting the telephone numbers via home visits. Comparing the interventions in group A and reference group B for the Turkish and Syrian participants, there were effectively no differences in the amount of online participations between those two groups (see Appendix/ Table III). The telephone interviews, which were possible in group A only, were hardly used by Turkish (n=8) or Syrian (n=17) participants. The differences in the response rates within the groups A and B were mainly caused by the home visits, which took place in group A only.
A minority of the respondents (42.9%) used the German questionnaire. Overall, 57.1% of the respondents used a different questionnaire language. The use of the translated questionnaire was dependent on the citizenship, as can be seen in Figure 2. The majority of the respondents in the Syrian and Romanian groups used the offer of translated questionnaires. In contrast, a majority of the Croatian and Turkish respondents used the German questionnaire.
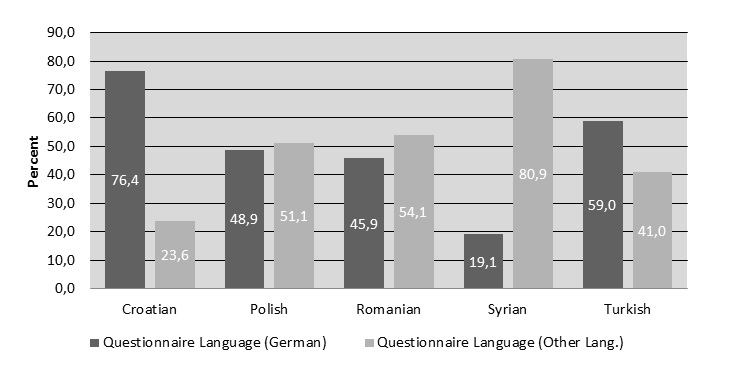
Figure 2: Use of multilingual questionnaires

Figure 3: Logistic regression model; dependent variable: translated questionnaire language preference; dependent variable: 1 = other language; 0 = German language
First of all, the categorized age variable showed a statistically significant effect for the age categories 25–34 and 34–44 (Figure 3). That means that the respondents in these categories were more likely to complete the questionnaire in a language other than German. A higher level of education increased the likelihood of filling out the survey in German. Furthermore, respondents with very good or good subjective general health status were more likely to complete the questionnaire in German compared with the reference category moderate/poor/very poor subjective health status. The same pattern can be observed for reference group B when compared with the intervention group A. With regard to citizenship, the pattern that was already evident in the descriptive evaluation also became apparent. In conclusion, there was no significant influence created by the choice of device on the preferred questionnaire language.
Sample composition
Sex
The majority of the study population (51.4%) was female. This gender trend was confirmed in all citizenships except the Syrian, where the trend was reversed (see Table 1). By comparison, of the two intervention groups A and B, there were no response differences at all due to sex among groups A and B in the Syrian group. In the Turkish groups, significantly more women took part in group A than in group B due to the home visits in group A (χ²= 4.9137; p=0.027).
Age
Over all, 50.4% of the survey participants were aged 18 to 44 years. There were significant differences regarding citizenship (χ²= 50.3197; p=0.000). Older aged persons (over 65 years) represented the smallest proportion of survey participants with a share of 18.6%. For the three citizenships that received further interventions in the last study phase it could be stated that the home visits changed the sample composition for the benefit of older participants. Foremost, in the Turkish group, participants of middle and highest age categories could be convinced to take part in the survey through home visits. In contrast, in the Syrian group, there was no difference between group A and B. In the Turkish group A, slightly more participants of the middle-age category took part in the survey. Nevertheless, this difference was not statistically significant (χ²= 2.8393; p=0.242).
Education
In total, 75.1% of the study participants had a middle or high education level. There were significant differences between the citizenships (χ²= 72.9001; p=0.000). Home visits increased the proportion of participants with a lower educational level.This effect could be especially shown in the Turkish group (see Table 1).The Turkish sample group A participants were statistically significantly less educated than the Turkish reference sample group B (χ²= 7.9441; p=0.019). In contrast, the differences in the Syrian groups were not statistically significant (χ²= 0.5839; p=0.747).
Subjective state of health
A total of 70% of our participants rated their subjective health status as good or very good, measured with the subjective health scale. Overall 62.3% of the Turkish respondents reported a good or very good health status. The subjective health status of Syrian persons who reported a good or very good health status confirmed the overall average of 70%. Comparing groups A and B, there were no statistically significant differences in health status for Turkish or Syrian participants identified (χ²= 6.6935; p=0.153).
Table 1: Sample composition regarding sociodemographic and health-related variables by group allocation and citizenship – % (frequency)
| Sociodemographic and Health-related Variables | Group A | Group B | Overall | ||||||
| Turkish | Syrian | Romanian | Croatian | Polish | Turkish | Syrian | Total | ||
| Sex | |||||||||
| Male | 38.3 (54) | 55.4 (148) | 37.6 (41) | 45.5 (81) | 46.6 (103) | 54 (41) | 55.6 (110) | 48.6 (578) | |
| Female | 61.7 (87) | 44.6 (119) | 62.4 (68) | 54.5 (97) | 53.4 (118) | 46 (35) | 44.4 (88) | 51.4 (612) | |
| Total Age | 100 (141) | 100 (267) | 100 (109) | 100 (178) | 100 (221) | 100 (76) | 100 (198) | 100 (1.190) | |
| Age | |||||||||
| 18–44 years | 41.9 (59) | 55.4 (148) | 56 (61) | 49.5 (88) | 38.4 (85) | 52.3 (42) | 59.1 ( 117) | 49.5 (585) | |
| 45–64 years | 33.3 (47) | 32.6 (87) | 28.4 (31) | 23 (41) | 40.3 (89) | 21 (16) | 28.8 (57) | 31.5 (372) | |
| over 65 years | 24.8 (35) | 12 (32) | 15.6 (17) | 27.5 (49) | 21.3 (47) | 23.7 (18) | 12.1 (24) | 19.0 (224) | |
| Total Age | 100 (141) | 100 (267) | 100 (109) | 100 (178) | 100 (221) | 100 (76) | 100 (198) | 100 (1.181) | |
| Education | |||||||||
| Low | 48.6 (67) | 28.1 (75) | 17.4 (19) | 19.7 (35) | 11 (24) | 29 (22) | 27 (53) | 24.9 (295) | |
| Middle | 33.3 (46) | 41.9 (112) | 40.4 (44) | 44.9 (80) | 43.8 (96) | 43.4 (33) | 45.4 (89) | 42.3 (500) | |
| High | 18.1 (25) | 30 (80) | 42.2 (46) | 35.4 (63) | 45.2 (99) | 27.6 (21) | 27.6 (54) | 32.8 (388) | |
| Total Education | 100 (138) | 100 (267) | 100 (109) | 100 (178) | 100 (109) | 100 (76) | 100 (196) | 100 (1.183) | |
| Health Status | |||||||||
| Poor or very poor | 12 (17) | 8.2 (22) | 4.6 (5) | 7.9 (14) | 5 (11) | 9.2 (7) | 6.1 (12) | 7.1 (84) | |
| Moderate | 30.5 (43) | 24.3 (65) | 16.5 (18) | 16.8 (30) | 17.2 (38) | 23.7 (18) | 20.7 (41) | 21.3 (253) | |
| Good or very good | 57.5 (81) | 67.4 (180) | 78.9 (86) | 75.3 (134) | 77.8 (172) | 67.1 (51) | 73.2 (145) | 71.6 (849) | |
| Total Health Status | 100 (141) | 100 (267) | 100 (109) | 100 (178) | 100 (221) | 100 (76) | 100 (198) | 100 (1.186) | |
Notes: A comparison between group A and group B is possible for Turkish and Syrian participants only.
Final Disposition Codes and Response Rates
Table II in the appendix shows the AAPOR disposition code results differentiated by citizenship and groups A and B. Regarding citizenship, the highest rates of refusal or no-interview could be identified in the Syrian and Turkish groups. More than half of our sample still had an unknown eligibility statuses by the end of the survey. The highest number of cases of unknown eligibility belonged to the Turkish and Croatian groups. Also recorded was a high amount of non-eligible persons in the Romanian group, with 42.13%. We recorded cases as ‘not eligible’ if the target person could not be reached because of an invalid address, death, relocation or ineligibility during field time. These cases were excluded from the gross sample.

Figure 4: AAPOR response rates (RR1) by group allocation and citizenship in %
The total response rate in the IMIRA survey was 15.9% (n=1,190). However, there were different response rates among the five citizenships (χ²= 218.5849; p=0.000), as well as between the two intervention groups A and B (χ²= 33.6567; p=0.000) (Figure 4; see Appendix/ Table II). The Syrian and Polish groups showed the highest response rate. In contrast, the Turkish, Romanian and Croatian groups had response rates below the overall response rate.
Following the descriptive results, we will provide a parametric evaluation of the different study interventions per study phase. Figure 5 shows the results for the different models in a coefficient plot. The corresponding regression table can be looked up in the appendix (Table V).
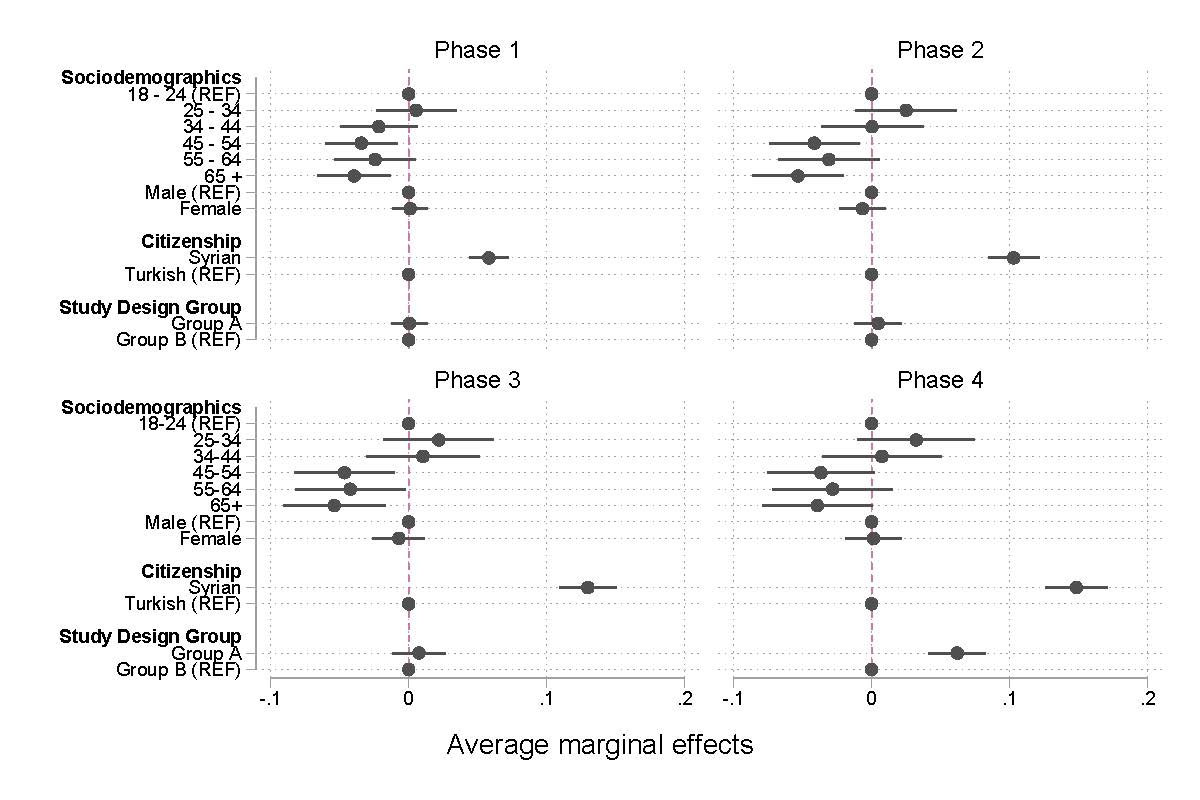
Figure 5: Logistic regression model by study phases
In all phases the age of the sampled persons had a statistically significant effect on the probability of participation. The older the sampled persons were, the lower the probability of participation (looking at the age categories 45–54 and 65+ with the reference category of 18–24). In contrast, the sex of the sampled persons had no statistically significant effect on the probability of participation. Comparing the probability of participation by citizenship, the Syrian group had a higher probability of participation in all four phases compared to the Turkish group. Overall and not differentiated by the study design groups A and B, the Syrian group had a 14.5% higher response rate compared to the Turkish reference group. If we look at the quasi-experimental differentiation of Groups A and B for the Syrian and Turkish groups, there was no effect for phases 1–3. Only in phase 4 does this difference become significant. The recruitment measures in phase 4, especially, lead to a higher response rate. In this final model, group A had a 6.2% higher response rate, compared to group B.
Discussion
Final Disposition Codes and Response Rates
The aim of the IMIRA feasibility study was to develop and test an adapted sample and survey design to find out how PMB can be better integrated in the national health monitoring studies at the RKI in Germany. In that context, the theoretical framework of Roger Tourangeau (2014) regarding ‘hard to reach’ populations could be applied. We assumed that the first two classifications of ‘hard to reach’ populations, ‘hard to locate’ and ‘hard to identify’, would not play a big role in the sample design. PMB with only a German citizenship had not been the focus of this feasibility study and thus no further efforts for identifying them (e.g. onomastic approaches) were carried out. We applied disproportional strata regarding age and sex for each type of citizenship in order to be able to fill each cell equally. Nonetheless, we had difficulties sampling the requested quantity of PMB, especially in the Syrian and Romanian groups. This applied not only to our sample points in Brandenburg, but in Berlin for older persons (over 65 years), as well. For the Syrian group, this is far from surprising. Considering the age distribution of the different citizenships, the Syrian group was by far the youngest. Statistics from the Central Register of Foreigners (AZR, Ausländerzentralregister) show that the mean age of the Syrian migrant group is 24.2 years. Only 1.2% of the Syrian migrant group in Germany is over the age of 65 years. Nearly the same pattern can be observed for the Romanian group. Here the average age is 32 years and only 1.5% of the people in this group are over the age of 65 years. In contrast, the average age of the largest migrant group, the Turkish group, is 44.8 years and the share of people over 65 years in this group is 16.3% (Statistisches Bundesamt, 2017). Later on in field time, Romanian and Syrian participants proved to be especially ‘hard to locate’ (Tourangeau, 2014), since the delivered addresses of targeted persons were no longer valid and were returned as undeliverable by mail. Both citizenships might be defined as highly mobile, which could be a reason for their address invalidity (Salentin, 2014). The high mobility in both groups might be motivated differently. Whereas Syrian persons in our sample were most likely refugees yet to secure permanent residences (Schmidt, 2018; Bundesamt für Migration und Flüchtlinge, 2015), the dropout rate of Romanian persons could not be explained as easily and needs further investigation.
When defining the gross sample with AAPOR final disposition codes, not only were the non-eligible cases striking, but also striking were the cases we knew nothing about. Most cases of unknown eligibility can be assigned to the Turkish and Syrian groups. This result appears surprising, considering the different characteristics of each group, such as the fundamental different migration histories (Butterwegge, 2005). Most of the Syrian persons were primarily asylum seekers, who had arrived recently due to conflicts and war in Syria, from 2015 until today (Groves & Couper, 1998; Schmidt, 2018; Bundesamt für Migration und Flüchtlinge, 2015). Their unknown eligibility could be a result of the high mobility rate related to the asylum process. In contrast, Turkish migrants primarily immigrated in the 1950s to 1970s as ‘guest workers’ (Butterwegge, 2005), i.e. they have been settled in Germany for some time now. The Turkish group is also the group with most refusals and least participations. In the words of Tourangeau (2014), they can be considered ‘hard to persuade’, meaning that their unknown eligibility could have nothing to do with their being ‘hard to locate’, presumably like the Syrian group.
This assumption had been strengthened by the comparison of the response rates of the citizenships. The Turkish group had a significantly lower response rate than all the other groups. Although the last field phase (home visits) could have increased the amount of participations in the Turkish sample of group A, the response rate was still clearly below the average. The reasons for the lowered willingness of Turkish migrants to participate in health studies are still not clear. But research has shown that some migrant groups might exhibit a tendency to be more tired of surveys, i.e. showing survey fatigue due to the fact that they have been surveyed very often lately (Méndez, Ferreras & Cuesta, 2013; Méndez & Font, 2013). This might apply to the Turkish group, being the biggest migrant group in Germany (Bundesamt für Migration und Flüchtlinge, 2015), and therefore being the focus of surveys very often. The other side this ‘fatigue argument’ is not entirely convincing. Considering the size of the Turkish migrant population, even in areas with plenty of research activities like Berlin, the probability of being sampled twice is still very low. Even if the inclusion probability was 10 percent (which is far too high), there would be only a 1% probability of being sampled twice. Nonetheless, research has shown that, when surveying Turkish migrants, response rates are often lower than in comparison to other PMB (Saß, 2015; Reiss et al., 2014; Frank et al., 2018; Brand et al., 2018). This observation can have many different reasons. For example, feelings of exclusion from the host society and its institutions could have a huge impact on the participation pattern in wide ranges of social life, including taking part in research surveys. For example, Brand et al. (2018) come to the conclusion that the immigration of Turkish migrants had been viewed primarily as temporary, which led to no further political efforts to integrate Turkish ‘guest workers’ since the 1950s (Brand et al., 2018; Yildiz, 2016). In political discourse, Germany was first referred to as a country for immigration in the late 1990s (Meier-Braun & Weber, 2017). This might have led to a feeling of social exclusion and discrimination in subsequent generations as well. Furthermore, Turkish migrants still have poorer chances in the labour market compared to persons with no migrant background, which is oftentimes associated with a lower educational level, as well (Höhne & Buschoff, 2015). Another possible impact factor on response rates could be literacy and language skills (Bonevski et al., 2014). In this context, research has shown that the offer of a translated questionnaire can increase the response rates in migrant populations (Moradi, Sidorchuk & Hallqvist, 2010). Nevertheless, there is still no consensus on the complex reasons why some PMB tend to have lower response rates when compared with people without a migration background.
The highest response rates in the IMIRA survey were assigned to the Syrian and Polish participants. Speaking of Syrians, results were in line with other studies, where it is stated that newly arrived persons, like refugees, are easier to persuade to participate in scientific studies than other migrant groups, since they might have a higher motivation to be a part of the new host society (Méndez, Ferreras & Cuesta, 2013; Brücker, Rother & Schupp, 2018). Furthermore, it is reported that some newly arrived PMB are more curious about being surveyed, since they lack experience with surveys or research in general (Méndez, Ferreras & Cuesta, 2013). This argument indirectly finds support in the fact that recent surveys report remarkably high response rates with refugees (Brücker, Rother & Schupp, 2018). A European-wide review of surveys with a focus on asylum-related migrants found that the reported average response rate was 64% and thus significantly higher than in general population surveys (Isernia et al., 2018). A German survey amongst Syrian refugees, which was conducted in refugee housing or registration points in five German cities, reported a surprising 95% response rate (Blog Syrian Spring, 2015).
The relatively high response rate of the Polish group might be motivated differently. For Polish persons, it is easier to live and work in Germany due to the eastward expansion of the European Union (EU), as Poland became a EU member state in 2004 (Salentin & Schmeets, 2017). Maybe the high response rate was caused by the bilingual presentation of all study materials and questionnaires, which facilitated participation and offered a solution for this group with respect to the ‘hard to survey’ issue that Tourangeau (2014) described. This assumption might be supported by the use of the Polish questionnaire, which was utilized by over the half of the Polish participants. For the Polish group, there was no reference group with German materials only; therefore, this assumption could not be evaluated within this survey and shall be researched further.
Comparison of Interventions
The main goal of this survey was to test multilingual interventions, such as the multilingual questionnaires and the opportunity to participate in the survey by telephone, face-to-face interview or online mode. Moreover, a study hotline had been set up. Whereas the multilingual questionnaire was presented to all of our participants, the multilingual hotline and the telephone and face-to-face interviews were available in sample group A only. The participants used the online questionnaire mode the most, which is partly due to the sequential mixed-mode design of the survey. In general, the multilingual questionnaire had been used by more than half of the participants. The Syrian participants used the translated questionnaire far more often than the other groups. The possibility of telephone interviews, starting in the second phase of the survey, did not receive the desired reactions. The reasons for this might be that the participants needed to actively call us, which might have been an additional threshold. Given the result that almost 40% of all participants filled out the questionnaire in German, the opportunity to participate in the study with a multilingual telephone interview might not have been as attractive as we thought when designing the survey. Regardless of this, we considered the last study phase, where multilingual interviewers performed home visits, as the most effective mode, which has been demonstrated by various surveys before (Blohm & Diehl, 2001; Méndez, Ferreras & Cuesta, 2013; Brücker, Rother & Schupp, 2018; Duque, Ballano & Pérez, 2013). Nonetheless, as this intervention was considered to be very costly, we split the home visits in their target outcome: face-to-face interviews on the one hand and a collection of telephone numbers for a follow-up telephone interview on the other. Whereas the face-to-face interviews were highly effective, the telephone number retrievals in this phase were not. This might be explained by a time gap between survey promotion and survey participation, which decreased the response rate again. Furthermore, handing out a telephone number might be evaluated by the participants as an intrusion into privacy related to a lack of trust of the stranger (interviewer) asking for it. Also, in other surveys, e.g. where it was necessary to reveal one’s contact network by defining names and contact information, researchers met with constraints of this kind (Salentin, 2014; Erens, 2013). Comparing group A with reference group B, the offered interventions in group A, all-in–all, led to a higher response. Although it cannot be clearly tested due to the survey design, the home visit phase and the offering of face-to-face interviews was the most striking intervention for increasing the rate. The response rates in the Turkish and Syrian groups could be increased remarkably. We assume that this was similar in the Romanian group but could not evaluate it, due to the lack of a Romanian reference group.
Sample Composition
Participants in the IMIRA survey were predominantly aged between 18 and 44 years. This was consistent with the showing of previous research on online surveys (Tourangeau, Conrad & Couper, 2013). If we differentiate the age of the participants according to the study phases, it can be shown that one was more likely to reach older persons in the home visit phase. The education level of our participants was also shown to be relatively high. This is also a typical result in health studies or online surveys in general; see, for example, the German Health Update (Lange et al., 2017). Nevertheless, in the Turkish and Syrian groups, fewer highly educated persons participated, which was particularly confirmed in the home visit phase. The results were similar regarding the subjective health status of the participants. Many more participants stated their health status as good rather than as poor or very poor. In the last field phase, we reached some persons with self-reported poor health conditions, which might have been the result of having an interaction while visiting them at home.
Limitations
Some limitations of the IMIRA survey should be mentioned. First, the sampling of this survey is not fully satisfying. In the process of decision making, we had to ignore non-probability approaches since we require representativeness in national health monitoring surveys for which the IMIRA survey tested feasibility. The reason behind this decision is that non-probability surveys still might not be suitable for representative estimations of the general population (Cornesse & Bosnjak, 2018; Baker et al., 2013; Yeager et al., 2011).Therefore, frequently used sampling methods for hard-to-reach populations, like snowballing or respondent-driven sampling, were not considered for the IMIRA survey (Erens, 2013). For orientation on RKI’s health monitoring surveys, we decided to sample ‘top down’, using the population register. Thus, we were limited by sampling persons with foreign citizenship only, who did not represent all PMB. Persons who had a migration background but no foreign citizenship were excluded from this study throughout the sample design (Salentin, 2014). Moreover, the sampling using the residents’ registry did not seem to be effective for all relevant citizenships in the same way. This was revealed through the high number of invalid postal addresses in the groups with presumably the highest mobility (Syrian and Romanian) (Salentin, 2014). Romanians, especially, were affected by this, which led to a decreased gross sample. This fact should be considered for further research. Furthermore, it is not clear whether the sample dropout of this group is structural and therefore highly biased. Secondly, in the survey design, we did not offer a paper questionnaire to our participants. Since all persons had to be contacted through a physical cover letter, which is due to the sampling of addresses only, and the questionnaire was only available online at the first phase, a medium switch had to be performed by our participants. We cannot estimate the influence that the lack of a paper questionnaire had on the response rate, but we had to waive this mode due to budget and process management considerations. Third, the multilingual materials were offered to all participants in the same way. Because of this, we could not evaluate their effectiveness. Furthermore, we had to be fixed on the languages we did offer, i.e. some persons could not participate in the survey because they did not speak one of the languages offered (e.g. in the Turkish or Syrian groups). Fourth, the study design is not an experimental design. By comparing groups A and B, it was necessary to focus all interventions, including telephone interviews and home visits. Since the interventions in each study phase were not presented under experimental conditions and thus could not be differentiated clearly, all reported effect estimations should be considered cautiously. Moreover, only Turkish and Syrian persons could be compared overall, because no reference group for the other citizenships was formed. The home visit interventions were implemented for Turkish, Syrian and Romanian persons only, but not for Croatian and Polish persons. Fifth and last, the results are not representative of the migrant populations in the survey’s target population. The presented results cannot be generalized, but rather, gives an idea of how interventions might work for recruiting ‘hard to reach’ populations in health surveys.
Conclusion
All-in–all, the results have shown that it is possible to motivate PMB to participate in health surveys, i.e. to persuade the ‘hard to persuade’ and to reduce barriers that lead them to be ‘hard to survey’ as well. Nonetheless, there are still problems in locating and identifying them as a target population. For the Romanian population, a sample design via residents’ registries did not seem effective. The diverse options of participation in the IMIRA survey, online or by telephone, did not affect the response rates in a great way. We assume that the setting up of a multilingual study hotline made sense after all – at least for creating a way to refuse participation and thus decrease the amount of cases with unknown eligibility; however, offering a telephone interview did not. Only the last field phase with home visits showed some effects on the persons’ responses at all. Thus, for upcoming surveys at RKI, this will be an essential part of the study design for reaching ‘hard to reach’ populations, such as migrants. Furthermore, the aspect of participation should not be underestimated. Current research, which examines subgroups of populations, is increasingly focusing on the possibility of involving the researched groups. The goal is to establish a research culture that does not conduct research on specific groups, but rather, works together with these groups. According to the stage model of participation, the measures in the IMIRA survey can be considered rather preliminary (Wright, Block & von Unger, 2007). In future health monitoring surveys, a greater emphasis will be put on participatory factors when designing PMB specific interventions.
Appendix
Table I.: Gross sample (Frequency distribution by sample point, citizenship, group, sex and age)
| Sample Point | Berlin (n=8,255) | Brandenburg (n=813) | Total | ||||||||
| Citizenship | Turkish | Syrian | Romanian | Croatian | Polish | Syrian | Polish | ||||
| Group | A | B | A | B | A | A | A | A | B | A | |
| Male | 706 | 703 | 473 | 463 | 606 | 705 | 511 | 131 | 126 | 155 | 4,579 |
| 18–44 years | 255 | 255 | 217 | 212 | 300 | 265 | 185 | 68 | 66 | 68 | 1,891 |
| 45–64 years | 242 | 240 | 151 | 148 | 213 | 217 | 183 | 52 | 50 | 68 | 1,564 |
| 65–79 years | 209 | 208 | 105 | 103 | 93 | 223 | 143 | 11 | 10 | 19 | 1,124 |
| Female | 705 | 705 | 432 | 417 | 614 | 705 | 510 | 120 | 114 | 167 | 4,489 |
| 18–44 years | 257 | 259 | 212 | 207 | 301 | 249 | 183 | 68 | 66 | 68 | 1,870 |
| 45–64 years | 237 | 236 | 159 | 152 | 207 | 227 | 181 | 46 | 44 | 66 | 1,555 |
| 65–79 years | 211 | 210 | 61 | 58 | 106 | 229 | 146 | 6 | 4 | 33 | 1,064 |
| Total | 1,411 | 1,408 | 905 | 880 | 1,220 | 1,410 | 1,021 | 251 | 240 | 322 | 9,068 |
Notes: In Berlin, it was possible to draw all five target citizenships from the residents’ register. In Brandenburg this was not practical, because of the lack of a sufficient number of cases of persons with Turkish, Romanian and Croatian citizenship. Therefore, only persons with Syrian and Polish citizenship were drawn in Brandenburg. Reference group B was drawn for Turkish and Syrian citizens only.
Table II.: AAPOR disposition codes, response rates, cooperation rates, refusal rates and contact rates regarding group allocation and citizenship
| AAPOR Disposition Code | Overall | Citizenship/Group | ||||||
| Turkish A | Turkish B | Syrian A | Syrian B | Romanian A | Croatian A | Polish A | ||
| Interview (I) | 1,190 | 141 | 76 | 267 | 198 | 109 | 178 | 221 |
| Refusal, Non-Contact, Other (R NC O) | 1,459 | 398 | 125 | 327 | 119 | 189 | 175 | 126 |
| Unknown Eligibility (UE) | 4,845 | 709 | 1,078 | 360 | 64 | 408 | 888 | 761 |
| Not Eligible (NE) | 1,574 | 163 | 129 | 202 | 162 | 514 | 169 | 235 |
| Gross Sample | 9,068 | 1,411 | 1,408 | 1,156 | 543 | 1,220 | 1,410 | 1,343 |
| Adjusted Gross Sample | 7,494 | 1,248 | 1,279 | 954 | 381 | 706 | 1,241 | 1,108 |
| Response Rate 1 I/(I+P) + (R+NC+O) + (UH+UO) |
15.9% | 11.3% | 5.9% | 28.0% | 20.7% | 15.4% | 14.3% | 19.9% |
| Cooperation Rate 1 I/(I+P)+R+O) |
44.9% | 26.2% | 37.8% | 44.9% | 62.5% | 36.6% | 50.4% | 63.7% |
| Refusal Rate 1 R/((I+P)+(R+NC+O) + UH + UO)) |
19.5% | 31.9% | 9.8% | 34.3% | 12.4% | 26.8% | 14.1% | 11.4% |
| Contact Rate 1 (I+P)+R+O / (I+P)+R+O+NC+ (UH + UO) |
35.3% | 43.2% | 15.7% | 62.3% | 33.1% | 42.2% | 28.4% | 31.3% |
Notes: Results were calculated by the AAPOR Survey Outcome Rate Calculator 4. All reported rates are the minimal rates (AAPOR Type 1).
Table III.: Mode of participation by citizenship and group allocation – % (frequency)
| Mode | Citizenship and Group | ||||||
| Turkish A | Turkish B | Syrian A | Syrian B | Romanian A | Croatian A | Polish A | |
| Online | 56 (79) | 100 (76) | 68.2 (182) | 100 (198) | 69.7 (76) | 83.7 (149) | 88.7 (196) |
| Telephone | 5.7 (8) | – | 6.3 (17) | – | 8.3 (9) | 16.3 (29) | 11.3 (25) |
| Face-to-Face | 27.7 (39) | – | 15.4 (41) | – | 18.3 (20) | – | – |
| Telephone interview (after obtaining telephone numbers) | 10.6 (15) | – | 10.1 (27) | – | 3.7 (4) | – | – |
| Total | 100 (141) | 100 (76) | 100 (267) | 100 (198) | 100 (109) | 100 (178) | 100 (221) |
Notes: There were no possible telephone interviews, face-to-face interviews or telephone interviews after obtaining a telephone number in group B.
Table IV.: Sample composition regarding sociodemographic and health-related variables by mode (dichotom) and citizenship – % (frequency)
| Sociodemographic and Health-related Variables | Online and Telephone Modes | Home Visit Modes (face-to-face, obtaining telephone numbers) | |||||||
| Turkish | Syrian | Romanian | Croatian | Polish | Turkish | Syrian | Romanian | ||
| Sex | |||||||||
| Male | 47.9 (78) | 55.7 (221) | 36.5 (31) | 45.5 (81) | 46.6 (103) | 31.5 (17) | 54.4 (37) | 41.7 (10) | |
| Female | 52.1 (85) | 44.3 (176) | 63.5 (54) | 54.5 (97) | 53.4 (118) | 68.5 (37) | 45.6 (31) | 58.3 (14) | |
| Total Age | 100 (163) | 100 (397) | 100 (85) | 100 (178) | 100 (221) | 100 (54) | 100 (68) | 100 (24) | |
| Age | |||||||||
| 18–44 years | 54 (88) | 58.9 (234) | 55.3 (47) | 49.5 (88) | 38.4 (85) | 24.1 (13) | 45.6 (31) | 58.3 (14) | |
| 4564 years | 24.5 (40) | 30 (119) | 27.1 (23) | 23 (41) | 40.3 (89) | 42.6 (23) | 36.8 (25) | 33.3 (8) | |
| over 65 years | 21.5 (35) | 11.1 (44) | 17.6 (15) | 27.5 (49) | 21.3 (47) | 33.3 (18) | 17.7 (12) | 8.4 (2) | |
| Total Age | 100 (163) | 100 (397) | 100 (85) | 100 (178) | 100 (221) | 100 (54) | 100 (68) | 100 (24) | |
| Education | |||||||||
| Low | 31.9 (52) | 27.3 (108) | 10.6 (9) | 19.7 (35) | 11 (24) | 72.5 (37) | 29.4 (20) | 41.7 (10) | |
| Middle | 41.7 (68) | 43.3 (171) | 38.8 (33) | 44.9 (80) | 43.8 (96) | 21.6 (11) | 44.1 (30) | 45.8 (11) | |
| High | 26.4 (43) | 29.4 (116) | 50.6 (43) | 35.4 (63) | 45.2 (99) | 5.9 (3) | 26.5 (18) | 12.5 (3) | |
| Total Education | 100 (163) | 100 (395) | 100 (85) | 100 (178) | 100 (219) | 100 (51) | 100 (68) | 100 (24) | |
| Health Status | |||||||||
| Bad or very bad | 5.5 (9) | 5.3 (21) | 2.3 (2) | 7.9 (14) | 5 (11) | 27.8 (15) | 19.1 (13) | 12.5 (3) | |
| Moderate | 27 (44) | 18.9 (75) | 16.5 (14) | 16.8 (30) | 17.2 (38) | 31.5 (17) | 45.6 (31) | 16.7 (4) | |
| Good or very good | 67.5 (110) | 75.8 (301) | 81.2 (69) | 75.3 (134) | 77.8 (172) | 40.7 (22) | 35.3 (24) | 70.8 (17) | |
| Total Health Status | 100 (163) | 100 (397) | 100 (85) | 100 (178) | 100 (221) | 100 (54) | 100 (68) | 100 (24) | |
Notes: Comparison is possible for Turkish, Syrian and Romanian participants only.
Table V.: Logistic regression of sociodemographic variables regarding participation in the study phases; average marginal effects
| Participation | 1st Phase | 2nd Phase | 3rdPhase | 4th Phase |
| Age (metric) | -0.000934*** | -0.00156*** | -0.00167*** | -0.00140*** |
| (0.000224) | (0.000278) | (0.000301) | (0.000324) | |
| Female | 0.000576 | -0.00591 | -0.00628 | 0.00146 |
| (0.00658) | (0.00865) | (0.00963) | (0.0105) | |
| Syrian citizenship | 0.0585*** | 0.102*** | 0.127*** | 0.147*** |
| (0.00725) | (0.00946) | (0.0105) | (0.0114) | |
| Group A | 0.000126 | 0.00402 | 0.00700 | 0.0615*** |
| (0.00661) | (0.00869) | (0.00967) | (0.0105) | |
| Observations | 4,439 | 4,439 | 4,439 | 4,439 |
Standard errors in parentheses
*** p<0.01, ** p<0.05, * p<0.1
Table VI.: Logistic regression of sociodemographic and other variables regarding the use of a multilingual questionnaire; average marginal effects
| Selected variables | Use of a multilingual questionnaire |
| Age (metric) | -0.00185** |
| (0.000843) | |
| Female | 0.0178 |
| (0.0256) | |
| Single household | 0.0173 |
| (0.0319) | |
| Middle education | -0.0584* |
| (0.0321) | |
| High education | -0.181*** |
| (0.0368) | |
| Good and very good subjective health status | -0.0909*** |
| (0.0298) | |
| Group B | -0.190*** |
| (0.0318) | |
| Croatian citizenship | -0.288*** |
| (0.0455) | |
| Romanian citizenship | 0.003*** |
| (0.959) | |
| Syrian citizenship | 0.319*** |
| (0.041) | |
| Turkish citizenship | -0.116*** |
| (0.050) | |
| Smartphone | 0.0421 |
| (0.0287) | |
| Tablet | -0.0845 |
| (0.0608) | |
| Observations | 1,183 |
Standard errors in parentheses
*** p<0.01, ** p<0.05, * p<0.1
References
- American Association for Public Opinion Research (AAPOR), Standard Definitions, Final Dispositions of Case Codes and Outcome Rates for Surveys, 9th ed. (2016).
- Baker, R., Brick, J. M., Bates, N. A., Battaglia, M., Couper, M. P., Dever, J. A., Gile, K. J., Tourangeau, R. (2013). Summary Report of the AAPOR Task Force on Non-probability Sampling. Journal of Survey Statistics and Methodology, 1(2), 90–143.
- Blog Syrian Spring. Survey amongst Syrian refugees in Germany – Backgrounds. (2015) [11.01.2019]; Available from: https://www.adoptrevolution.org/en/survey-amongst-syrian-refugees-in-germany-backgrounds/.
- Blohm, M. & Diehl C. (2001). Wenn Migranten Migranten befragen. Zum Teilnahmeverhalten von Einwanderern bei Bevölkerungsbefragungen. Zeitschrift für Soziologie, 30(3), 223–242.
- Bonevski, B., Randell, M., Paul, C., Chapman, K., Twyman, L., Bryant, J., Brozek, I., Hughes, C. (2014). Reaching the Hard-to-reach: A Systematic Review of Strategies for Improving Health and Medical Research with Socially Disadvantaged Groups. BMC Medical Research Methodology, 14(1), 42.
- Brand, T., Samkange-Zeeb, F., Dragano, N., Keil, T., Krist, L., Yesil-Jürgens, R., Schlaud, M., Jöckel, K.-H., Razum, O., Reiss, K. (2018) Participation of Turkish Migrants in an Epidemiological Study: Does the Recruitment Strategy Affect the Sample Characteristics? Journal of Immigrant and Minority Health, 1–9.
- Brause, M., Reutin, B., Schott, T., Yilmaz-Aslan, Y. (2010). Migration und gesundheitliche Ungleichheit in der Rehabilitation, Versorgungsbedarf und subjektive Bedürfnisse türkischer und türkischstämmi-ger Migrant(inn)en im System der medizinischen Rehabilitation, Abschlussbericht.
- Brücker, H., Kroh, M., Kühne, S., Liebau, E., Schupp, J., Siegert, M., Trübswetter, P. (2016). Das Studiendesign der IAB-BAMFSOEP-Befragung von Geflüchteten. In SOEP Survey Papers 365: Series C. 2016, DIW/ SOEP: Berlin.
- Brücker, H., Rother, N., & Schupp, J. (2018). IAB-BAMF-SOEP-Befragung von Geflüchteten 2016: Studiendesign, Feldergebnisse sowie Analysen zu schulischer wie beruflicher Qualifikation, Sprachkenntnissen sowie kognitiven Potenzialen. DIW Berlin: Politikberatung kompakt.
- Bundesamt für Migration und Flüchtlinge, Migrationsbericht 2015. (2015). Bundesamt für Migration und Flüchtlinge: Nürnberg.
- Butterwegge, C. (2005). Von der “Gastarbeiter”-Anwerbung zum Zuwanderungsgesetz. Migrationsgeschehen und Zuwanderungspolitik in der Bundesrepublik. Grundlagendossier Migration 2005 [08.06.2018]; Available from: http://www.bpb.de/gesellschaft/migration/dossier-migration-ALT/56377/migrationspolitik-in-der-brd?p=all.
- Cornesse, C., & Bosnjak, M. (2018). Is There an Association Between Survey Characteristics and Representativeness? A Meta-analysis. Survey Research Methods, 12(1), 1–13.
- Duque, I., Ballano, C., & Pérez, C. (2013). The 2007 Spanish National Immigrant Survey (ENI1): Sampling from the Padro´n. In J. Font & M. Méndez (Eds) Surveying Ethnic Minorities and Immigrant Populations, 69–83, Amsterdam: Amsterdam University Press: Amsterdam.
- Erens, B. (2013). Designing High-quality Surveys of Ethnic Minority Groups in the United Kingdom. In J. Font & M. Méndez (Eds) Surveying Ethnic Minorities and Immigrant Populations, 45, Amsterdam: Amsterdam University Press.
- Eurostat, European Health Interview Survey (EHIS wave 2)(2013). Methodological Manual. Luxembourg: Publications Office of the European Union.
- Feskens, R.C. (2009). Difficult Groups in Survey Research and the Development of Tailor-made Approach Strategies. Utrecht: Centraal Bureau voor de Statistiek; Utrecht University.
- Frank, L., Yesil-Jürgens, R., Born, S., Hoffmann, R., Santos-Hövener, C., Lampert, T. (2018). Maßnahmen zur verbesserten Einbindung und Beteiligung von Kindern und Jugendlichen mit Migrationshintergrund in KiGGS Welle 2. Journal of Health Monitoring, 3(1).
- Groves, R.M., & Couper, M.P. (1998). Nonresponse in Household Interview Survey. New York: Wiley.
- Hoffmann, R., Lange, M., Butschalowsky, H., Houben, R., Schmich, P., Allen, J., Kuhnert, R., Schaffrath Rosario, A., Gößwald, A. (2018). Querschnitterhebung von KiGGS Welle 2–Teilnehmendengewinnung, Response und Repräsentativität.
- Höhne, J., & Buschoff, K.S. (2015). Die Arbeitsmarktintegration von Migranten und Migrantinnen in Deutschland. Ein Überblick nach Herkunftsländern und Generationen. WSI-Mitteilungen, 68(5), 345–354.
- Isernia, P., Urso, O., Gyuzalyan, H., Wilczynska, A. (2018). A Review of Empirical Surveys of Asylum-Related Migrants (provisional). European Asylum Support Office.
- Kamtsiuris, P., Lange, M., Hoffmann, R., Schaffrath Rosario, A., Dahm, S., Kuhnert, R., Kurth, B.-M. (2013). Die erste Welle der Studie zur Gesundheit Erwachsener. In Deutschland (DEGS1). Robert Koch Institut, Epidemiologie und Gesundheitsberichterstattung.
- Kamtsiuris, P., Lange, M., & Rosario, A.S. (2007). Der Kinder-und Jugendgesundheitssurvey (KiGGS): Stichprobendesign, Response und Nonresponse-Analyse. Bundesgesundheitsblatt-Gesundheitsforschung-Gesundheitsschutz, 50(5-6), 547–556.
- Lange, C., Finger, J. D., Allen, J., Born, S., Hoebel, J., Kuhnert, R., Müters, S., Thelen, J., Schmich, P., Varga, M. (2017). Implementation of the European Health Interview Survey (EHIS) into the German Health Update (GEDA). Archives of Public Health, 75(1), 40.
- Lange, M., Butschalowsky, H. G., Jentsch, F., Kuhnert, R., Schaffrath Rosario, A., Schlaud, M., Kamtsiuris, P., KiGGS Study Group (2014). Die erste KiGGS-Folgebefragung (KiGGS Welle 1). Bundesgesundheitsblatt-Gesundheitsforschung-Gesundheitsschutz, 57(7), 747–761.
- Meier-Braun, K.-H., & Weber, R. (2017). Deutschland Einwanderungsland: Begriffe-Fakten-Kontroversen. Kohlhammer Verlag.
- Méndez, M., & Font, J. (2013). Surveying Immigrant Populations: Methodological Strategies, Good Practices and Open Questions. In M. Méndez & J. Font (Eds) Surveying Ethnic Minorities and Immigrant Populations: Methodological Challenges and Research Strategies, 271–291, Amsterdam: Amsterdam University Press.
- Méndez, M., Ferreras, M., & Cuesta, M. (2013). Immigration and General Population Surveys in Spain: The CIS Surveys. In M. Méndez & J. Font (Eds) Surveying Ethnic Minorities and Immigrant Populations: Methodological Challenges and Research Strategies, 195–218, Amsterdam: Amsterdam University Press.
- Moradi, T., Sidorchuk, A., & Hallqvist, J. (2010). Translation of Questionnaire Increases the Response Rate in Immigrants: Filling the Language Gap or Feeling of Inclusion? Scandinavian Journal of Public Health, 38(8), 889–892.
- Reiss, K., Makarova, N., Spallek, J., Zeeb, H., Razum, O. (2013). Identifizierung und Rekrutierung von Menschen mit Migrationshintergrund für epidemiologische Studien in Deutschland. Das Gesundheitswesen, 75(06), e49–e58.
- Reiss, K., Dragano, N., Ellert, U., Fricke, J., Greiser, K. H., Keil, T., Krist, L., Moebus, S., Pundt, N., Schlaud, M., Yesil-Jürgens, R., Zeeb, H., Zimmermann, H., Razum, O., Jöckel, K.-H., Becher, H. (2014). Comparing sampling Strategies to Recruit Migrants for an Epidemiological Study. Results from a German Feasibility Study. The European Journal of Public Health, 24(5), 721–726.
- Salentin, K. (2014). Sampling the Ethnic Minority Population in Germany. The Background to Migration Background. Methods, Data, Analyses, 8(1), 28.
- Salentin, K., & Schmeets, H. (2017). Sampling Immigrants in the Netherlands and Germany. Comparative Migration Studies, 5(1), 21.
- Saß, A.-C., Grüne, B., Brettschneider, A.-K., Rommel, A., Razum, O., Ellert, U. (2015). Beteiligung von Menschen mit Migrationshintergrund an Gesundheitssurveys des Robert Koch-Instituts. Bundesgesundheitsblatt-Gesundheitsforschung-Gesundheitsschutz, 58(6), 533–542.
- Schenk, L., & Neuhauser, H. (2005). Methodische Standards für eine migrantensensible Forschung in der Epidemiologie. Bundesgesundheitsblatt Gesundheitsforsch. Gesundheitsschutz, 48(3), 279–286.
- Schmidt, H.-J. (2018). BAMF-Kurzanalyse. Volljährige Asylerstantragsteller in Deutschland im Jahr 2017: Sozialstruktur, Schulbesuch und Berufstätigkeit im Herkunftsland. Bundesamt für Migration und Flüchtlinge (BAMF), Ausgabe 03|2018 der Kurzanalysen des Forschungszentrums Migration, Integration und Asyl des Bundesamtes für Migration und Flüchtlinge: Nürnberg.
- Schnell, R., Trappmann, M., & Gramlich, T. (2014). A Study of Assimilation Bias in Name-based Sampling of Migrants. Journal of Official Statistics, 30(2), 231–249.
- Stadler, B. (2009). Die Befragung von MigrantInnen in Stichprobenerhebungen. In M. Weichbold, J. Bacher, & C. Wolf (Eds) Umfrageforschung, Herausforderungen und Grenzen, 275–291, Wiesbaden: Springer.
- Statistik Berlin Brandenburg. Bevölkerung, Einbürgerungen, Ausländer, Basisdaten. 2018 [cited 2018 06.05.2018]; Available from: https://www.statistik-berlin-brandenburg.de/BasisZeitreiheGrafik/Bas-Einbuergerungen_Auslaender.asp?Ptyp=300&Sageb=12025&creg=BBB&anzwer=7.
- Statistisches Bundesamt, Bevölkerung und Erwerbstätigkeit, Ausländische Bevölkerung, Ergebnisse des Ausländerzentralregisters. 2017, Statistisches Bundesamt (Destatis): Wiesbaden.
- Tourangeau, R. (2014). Defining Hard-to-survey Populations. In R. Tourangeau, et al. (Eds) Hard-to-survey Populations, 3–20, Cambridge University Press.
- Tourangeau, R., Conrad, F. G., & Couper, M.P. (2013). The Science of Web Surveys. Oxford University Press.
- Wittlif, A., & Beigang, S. (2016). Methodenbericht, SVR-Integrationsbarometer 2016. Sachverständigenrat deutscher Stiftungen für Integration und Migration (SVR). GmbH: Berlin.
- Wright, M., Block, M., & von Unger, H. (2007). Stufen der Partizipation in der Gesundheitsförderung. Infodienst für Gesundheitsförderung, 7(3), 4–5.
- Yeager, D.S., Krosnick, J. A., Chang, L., Javitz, H.S., Levendusky, M. S., Simpser, A., Wang, R. (2011). Comparing the Accuracy of RDD Telephone Surveys and Internet Surveys Conducted with Probability and Non-probability Samples. Public Opinion Quarterly, 75(4), 709–747.
- Yıldız, E. (2016). Das strategische Geflecht von Migration, Ethnizität und Geschlecht. Österreichische Zeitschrift für Soziologie, 41(3), 29–45.
-
Keywords
calibration CATI coverage coverage bias cross-national surveys data linkage data quality European Social Survey experiment face-to-face face-to-face survey Facebook hard to reach populations incentives item nonresponse measurement measurement error mixed-mode surveys multitasking non-probability samples Nonresponse nonresponse bias nonresponse rates paradata PIAAC Probability sample probability samples QR codes rare populations response rate Satisficing social desirability Social media survey survey-taking climate survey data survey management survey methods Telephone survey telephone surveys total survey error unit nonresponse validity web survey Web surveys weighting
