

Converting Nonrespondents in PIAAC Germany 2012 Using Responsive Measures
Martin, S., and Zabal, A. (2020). Converting Nonrespondents in PIAAC Germany 2012 Using Responsive Measures in Survey Methods: Insights from the Field, Special issue: ‘Fieldwork Monitoring Strategies for Interviewer-Administered Surveys’. Retrieved from https://surveyinsights.org/?p=11703
© the authors 2020. This work is licensed under a Creative Commons Attribution 4.0 International License (CC BY 4.0) 
Abstract
Using paradata to modify design features during fieldwork is the earmark of responsive designs (Groves & Heeringa, 2006). One objective of responsive approaches is to improve the composition of the final sample by gaining the participation of nonrespondents. A simple but innovative attempt at realizing such a response intervention was undertaken during the fieldwork of PIAAC Germany 2012. Different groups of nonrespondents were identified for follow-up efforts. With a view to the outcome measures of PIAAC, basic skills of the adult population, two groups were focused: Non-nationals and sample persons with low educational attainment. To identify these groups, different sources of auxiliary data were used (sampling frame, interviewer observations, and a commercial vendor database). Non-nationals were identified using information from the sampling frame. The challenge was to identify sample persons with (presumably) low levels of education. This was achieved by selecting a set of auxiliary variables, and subsequently using classification trees to model and predict sample persons with low levels of education. The sample persons were sent carefully crafted tailored letters during the re-issue phase. Overall, the cost-benefit balance of this intervention is rather disproportionate: A high level of effort with little apparent impact on the final sample composition. Nevertheless, this explorative endeavour was worthwhile and informative. In particular, the model-based prediction of different types of sample persons can be regarded as a promising approach.
Keywords
auxiliary data, classification tree analysis, Nonresponse, paradata, PIAAC, refusal conversion, responsive measures, tailored letters
Acknowledgement
The PIAAC survey in Germany was funded by the Federal Ministry of Education and Research with the participation of the Federal Ministry of Labor and Social Affairs.
Copyright
© the authors 2020. This work is licensed under a Creative Commons Attribution 4.0 International License (CC BY 4.0)
Introduction
In recent years, survey methodologists around the world have observed a declining trend in response rates realized in population surveys (e.g., Blohm & Koch, 2013; De Leeuw & De Heer, 2002; Dixon & Tucker, 2010; Kreuter, 2013). Whereas several studies showed that the response rate as a unique indicator seems to be only a weak predictor for nonresponse bias, there is still a widespread assumption that with low response rates the survey estimates will most likely be biased to some extent (Groves & Peytcheva, 2008; Peytchev, 2013; Schouten, Cobben, & Bethlehem, 2009). For some time now, survey methodologists have been exploring reasons for survey (non-)participation (Groves & Couper, 1998; Stoop, 2005). To produce high-quality data, numerous tools are available to manage and optimize data collection and to address sample persons with different strategies depending on their characteristics and motivation. At the same time, limiting costs is crucial for surveys in general. Survey researchers and practitioners are actively exploring innovative approaches to the problem of nonresponse and how to produce high-quality data while minimizing costs. Responsive designs aim to address these challenges by selectively deviating from the one-size-fits-all protocols (Groves & Heeringa, 2006; Lynn, 2017; Tourangeau, Brick, Lohr, & Li, 2017; Wagner, 2008). Instead, groups of sample persons are given different treatments, under the assumption that they will react differently to alternative design options. The continuous monitoring of key indicators is one of the central elements of responsive designs (Groves & Heeringa, 2006). Furthermore, responsive designs rely on the availability of reliable paradata, for example call record data, auxiliary information from a sampling frame or interviewer observations (Couper & Wagner, 2012; Schouten, Calinescu, & Luiten, 2013). Typical examples of survey protocol adaptations include introducing changes in incentives, interview length, administration mode, or advance letters (Lynn, 2016, 2017; Schouten et al., 2013).
This article describes a responsive design feature used for the follow-up and conversion of nonrespondents in the German 2012 main study of PIAAC, the Programme for the International Assessment of Adult Competencies. PIAAC is a programme initiated by the Organisation for Economic Co-operation and Development (OECD) and aims to collect internationally comparable data on basic cognitive skills of adult populations (OECD, 2013a). The PIAAC survey was subject to highest quality standards at all stages of the survey life cycle, including very high response rate benchmarks (target 70 %; at least 50 %) and low levels of nonresponse bias (OECD, 2010). Like in many countries around the world, surveys in Germany were (at the time of PIAAC) and still are very much affected by declining response rates (European Social Survey, 2012, 2013; Wasmer, Scholz, & Blohm, 2010; Wasmer, Scholz, Blohm, Walter, & Jutz, 2012). In order to achieve the very ambitious PIAAC response rate standards in Germany despite this trend, an extensive and varied mix of fieldwork measures was implemented, including an unusually attractive promised incentive (50 €) and a five-day interviewer training which was the first of this length and elaboration in Germany (Zabal, 2014; Zabal et al., 2014). The initial results during fieldwork were promising; after two months of fieldwork, the response rate with respect to released sample was approximately 45 %. However, sample monitoring during the main data collection phase revealed shortfalls in reaching residents with non-German citizenship (referred to as non-nationals) and sample persons with low educational attainment. Thus, the re-issue phase addressed these sample persons differently by sending them specially crafted follow-up letters. The mixture of the various measures resulted in a response rate of 55 % – calculated according to the PIAAC Technical Standards and Guidelines – and a low potential for bias, a level that was comparable to that of other participating countries (OECD, 2010, 2013b; Zabal et al., 2014).
Data and methods
For PIAAC Germany (Zabal et al., 2014), a registry-based probability sampling design was implemented. The target population was adults aged 16 to 65 years living in a private household in Germany at the time of data collection, irrespective of citizenship and residential status. The computer-based interview was conducted in German and consisted of an interviewer-administered background questionnaire and a self-administered cognitive assessment (under interviewer supervision). Data collection was carried out over an eight-month period in 2011/12, with two main working phases and five re-issue phases. A total of 5,465 interviews were obtained from a gross sample of 10,240 cases.
Data
During data collection, interviewers collected and documented information about the PIAAC cases assigned to them. A detailed list of dispositions was provided, and interviewers selected an appropriate code for each case that was a final nonresponse.
Prior to the very first contact attempt, interviewers were required to evaluate certain sample person characteristics, such as their most likely social class and educational attainment (best estimate); they also provided information about the neighbourhood, for example, type and condition of the sample person’s dwelling (Helmschrott & Martin, 2014; Zabal et al., 2014). One of the sessions of the extensive interviewer training focussed on how to collect this auxiliary data and emphasized the importance of obtaining this information before the first contact, since the objective was to have comparable data for both respondents and nonrespondents. Although such interviewer observations are subjective and error-prone (Kreuter, 2013; West, 2013; West & Sinibaldi, 2013), they are one of the few possibilities to obtain comparable auxiliary information on both respondents and nonrespondents.
Additional auxiliary data for all sample persons were available from the sampling frame (age, sex, citizenship, geographic information) as well as from a commercial vendor database containing aggregated data on, for example, economic or psychographic information about the house, street or quarter in which the sample person lived, i.e. relatively small geographic clusters (Microm MARKET & GEO, 2011). Data from the vendor database was available for approximately 95 % of the sample persons (Zabal et al., 2014). These data sources as well as interview information available for respondents (educational attainment) were used for the analyses in the present study. The data used for the analyses reported in this article are not publicly accessible; these were interim data sets generated during fieldwork.
Methods
All reported disposition codes of the main working phase data collection were assessed to identify cases eligible for a re-issue, for example sample person moved, sample person temporarily absent, non-contact, or soft refusal (in Germany, hard refusals cannot be re-approached by law). Nonrespondents eligible to be re-contacted in the re-issue phase were sent a follow-up letter by postal mail prior to the interviewer’s next visit. Typically, in this phase one generic follow-up letter is prepared and sent to all sample persons. Instead of pursuing such a one-size-fits-all solution, we crafted five tailored follow-up letters. Tailored letters are one element of responsive design (Lynn, 2016), and implementing this strategy lent itself well in the context of our fieldwork. The sample persons selected for a re-issue were allocated to one of the following five groups and received the corresponding follow-up letter:
- Sample persons with address-related issues: If it was determined that a sample person no longer lived at a given address or the address was invalid, an address search was launched at the local registries. Sample persons for whom a new address was obtained received the standard advance letter that was used for the main working phase.
- Non-contacts: Sample persons for which no contact whatsoever had been achieved were sent a letter noting that previous attempts to reach them had been unsuccessful and emphasizing the importance of the PIAAC survey. The toll-free phone number was placed prominently to prompt the sample persons to contact the survey organisation to schedule an appointment.
- Non-nationals: Sample persons with a non-German citizenship (based on information from the sampling frame) received a letter that was linguistically simple and easy to understand. It emphasized three aspects: the importance of the sample person’s participation, the fact that no special knowledge was required for the interview, and the possibility of using an interpreter for the administration of the background questionnaire. In addition, an endorsement letter by the Federal Ministry of Education and Research (main funder of PIAAC in Germany) was attached.
- Sample persons with (presumably) low education: The letter for this group was kept short and easy to understand. It pointed out the importance of the sample person’s participation, indicated that no special knowledge was necessary, and emphasized that many participants had given positive feedback and very much enjoyed the interview.
- Others: Sample persons who were not allocated to one of the previous groups and were heterogeneous with respect to characteristics or reasons for non-participation received a more generic one-size-fits-all letter. The objective was to capture their interest in the PIAAC interview. The letter highlighted that by participating in the interview, sample persons could make a difference.
If sample persons could be allocated to more than one group, a hierarchical approach was applied, following the order specified above (from 1 to 5). For example, sample persons that belonged to both group 2 and group 3 were allocated to group 2.
Identifying sample persons belonging to group 4 required a more complex approach, since the information on educational attainment was not available for nonrespondents. In a first step, the association of educational attainment with various variables from the set of auxiliary data described above was investigated. Data from completed interviews that had been collected up until the end of the second month of data collection were used (n = 2,859). The information on the highest general school leaving qualification was coded into a binary variable (low: lower secondary or no degree; not low: intermediate or upper secondary degree). Chi-square tests for independence were run (for categorical variables) and correlations were computed (for continuous variables) to explore the association between this binary education variable and the paradata. Auxiliary variables that showed a significant association with educational attainment were inputted into the next step.
In step two, ten classification trees (CRT) were modelled using SPSS. A classification tree is a recursive partitioning method that splits a sample into subgroups that are homogeneous to the greatest possible extent with regard to the dependent variable and share the same characteristics with regard to predictor variables. We used the binary variable for educational attainment as the dependent variable and the final set of auxiliary data from step 1 as predictor variables. At the end of the main fieldwork phase, tree models were run with all respondents that had German citizenship (n = 2,606). Splits were dependent on the selected predictor variables and their level of aggregation as well as the specified tree-growing criteria (e.g., variation with regard to minimum number of cases for parent and child nodes). The tree-growing criteria were varied across the ten models. To control the growth of a tree, the splitting criterion had to be set to a reasonable level (here: either to 0.0001 or 0.004), which means that the overall coefficient of determination (R2) had to increase at least by this increment. Each CRT algorithm estimated a predicted value for educational attainment. At the same time, the algorithm generated prediction rules which were used in the next processing step.
Step 3 applied the prediction rules obtained in step 2 to nonrespondents who qualified for the re-issue phase but did not belong to the above specified groups 1, 2, or 3. For each of these nonrespondents, the ten models predicted whether or not the nonrespondent was likely to have a low level of education.
In the last step 4, a selection rule was applied to decide which nonrespondents from step 3 were to be allocated to the group of sample persons with (presumably) low education. To account for the uncertainty in the model predictions, the following pragmatic convention was adopted: If at least four of the ten models yielded the prediction that a specific sample person was presumably low-educated, these nonrespondents were sent a type 4 letter.
In total, there were five re-issue phases at different times throughout data collection. Prior to each re-issue phase, a different group of nonrespondents was identified for a follow-up. They subsequently received one of the five tailored letters.
Results
Selected results will now be presented for each of the steps involved in the identification of nonrespondents with (presumably) low education, given that this is a core feature of the innovative responsive strategy undertaken for the German PIAAC fieldwork. The final outcomes for each of the five nonrespondent groups that were re-approached during the re-issue phases will be shown. Finally, the accuracy of the predictions for the fourth group of nonrespondents (persons with presumably low education) will be examined.
The first step in identifying sample persons with low education consisted in examining the associations between the available auxiliary variables and educational attainment obtained from chi-square tests and correlation analyses. A total of 47 variables were analysed: five from interviewer observations, five from the sampling frame, and the rest from the commercial vendor database. The majority of the variables (89 %) were categorical. Results of the chi-square tests and correlation analyses are given in Table 1.
Table 1 Results From Chi-Square Tests and Correlation Analyses
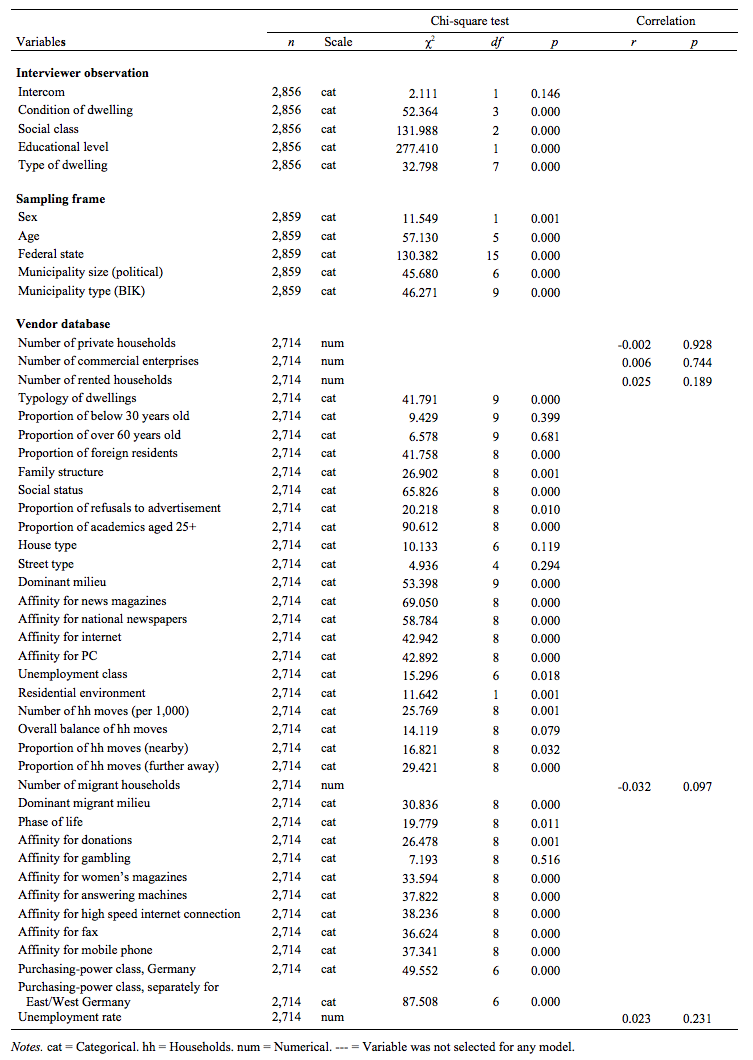
Thirty-five variables showed a significant association with educational attainment (p < .05). These were entered into the next analysis step. In addition, the variable unemployment rate from the vendor database (based on small geographical clusters) was kept to be used in an explorative model, even though the correlation with educational attainment was not significant, because this variable was regarded as a potentially sound indicator for our purposes.
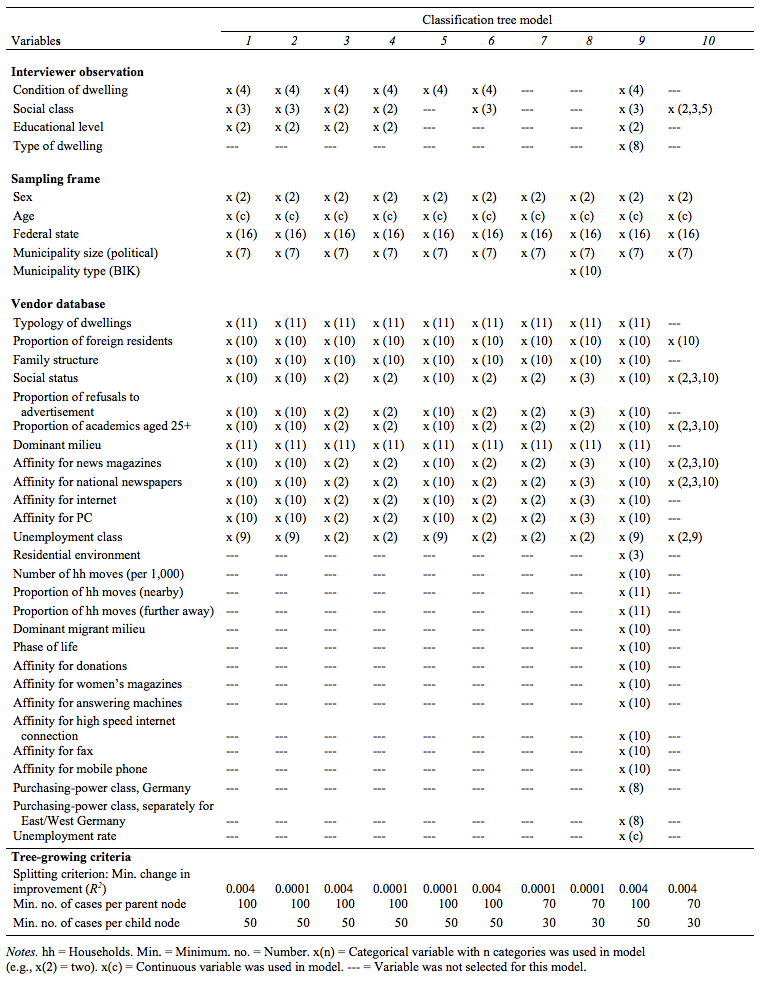
The second step consisted of running 10 separate CRT models with different tree-growing criteria (see Table 2). Each model was based on different combinations and aggregation levels of the 35 previously identified variables.
Table 2 Predictor Variables and Tree-Growing Criteria in Ten Classification Tree Models
Each CRT model resulted in a different set and number of nodes with differential outcomes for low educational attainment. Table 3 summarizes the most relevant results from the CRT analyses. For each model, the upper part of the table indicates the total number of nodes, the number of terminal nodes, as well as the depth and the number of nodes that predicted a low level of education. The table also shows the percentage of cases for which the educational level was correctly predicted compared to the observed educational level from the interview. This is shown separately for each observed educational level (low versus not-low). This measure reflects how well the model settings and the selected auxiliary data predicted the educational level.
Not all variables inputted in the CRT models had an important impact on growing a tree, and their importance varied across the different models. Thus, in the lower part of Table 3 only the variables which contributed most to the models (improvement of the prediction by R2 ≥ .005) are displayed. The highly aggregated variables from the vendor database were the least useful.
Table 3 Results From Ten Classification Tree Models
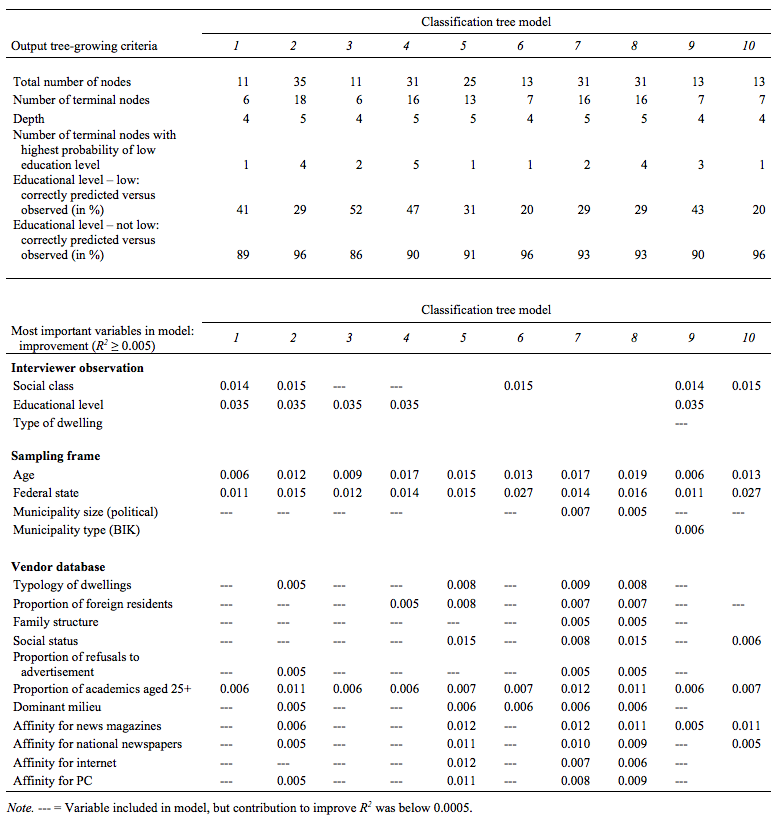
Of all the models tested, Model 3 yielded the highest percentage of correctly predicted respondents with an observed low educational level (52 %). The tree algorithm of this model clustered respondents into six subgroups (see number of terminal nodes). Respondents in each of these clusters are homogeneous with regard to certain characteristics (dependent on the predictor variables included in the model). In two of these six terminal nodes the probability of having a low educational level was highest. For example, respondents clustered in one of these two nodes had (a) a lower educational level as assessed by the interviewer and (b) did not live in any of the federal states Berlin, Brandenburg, Hesse, Saxony, and Saxony-Anhalt. The most influential predictor variables in this model (expressed as R2 improvements) are educational level as assessed by the interviewer (0.035), federal state (0.012), age (0.009), and the vendor database variable indicating the percentage of academics among the population over 25 years of age in the respective geographical cluster (0.006).
Model 4, which accurately classified 47 % of respondents with low education, produced five terminal nodes where the probability of having a low educational level was highest. It basically includes the same key predictor variables as Model 3, and also includes an additional predictor (proportion of foreign residents). Age contributed more to improving R2 than in Model 3 (0.017).
In models that include educational level as assessed by the interviewer (Models 1–4, 9), this variable contributed most to improving R2 (0.035). Four of these five models (Models 1, 3, 4, and 9) yielded correct prediction rates of low education of 41 % or more. In models that did not include educational level as assessed by the interviewer (Models 5–8, 10), the variables that improved R2 most were age and/or federal state; these two variables were available in the sampling frame. There is no clear pattern with respect to the variables from the vendor database: In some models they contributed to the prediction of low educational level (e.g., Models 7 and 8), whereas in others only few of these variables were of predictive value (e.g., Model 6).
In step 3, the generated prediction rules obtained from the CRT models were applied to 1,513 German nonrespondents. In the fourth and final step, 398 cases (26 %) were subsequently defined as sample persons with presumably low educational attainment following the convention described above. However, not all of these 398 cases were soft refusals, so that a total of 303 cases were finally re-approached in the re-issue phase.
Table 4 Final Disposition Codes for Re-Issue Cases With Different Tailored Letters
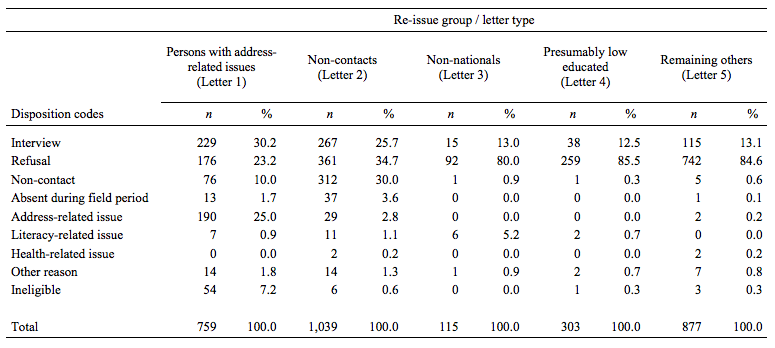
Table 4 depicts the distribution of the 3,093 re-approachable cases across the various re-issue groups. For each of these five groups, the final disposition codes are displayed and the number of tailored letters sent is indicated (see row Total). The group of sample persons with address-related issues yielded the highest number of completed interviews: 30 % participated in the PIAAC interview (compared to about 23 % refusals). Although address-related issues remained a substantial reason for nonresponse in this group, the effort undertaken to locate these sample persons appears worthwhile. For the group of non-contacts, contact was achieved with about 70 % of the cases worked in the re-issue phase. Across the five respondent groups, this group yielded the second highest number of completed interviews, with an interview completion rate of 26 %. Interview completion rates in the remaining three groups are lower than in the first two groups, with a yield of approximately 13 % completed interviews in each group. In the group of sample persons with presumably low education, for 24 of 38 cases with completed interviews (63 %), the prediction that they had a low educational attainment was confirmed by the interview data.
Discussion and Conclusion
Careful and continuous monitoring of key indicators throughout the eight-month fieldwork of PIAAC Germany 2012 was crucial to achieving a (for Germany) high response rate of 55 % with a low level of nonresponse bias (for more details on the nonresponse bias analyses see: OECD, 2013b; Zabal et al., 2014). One of the innovative efforts introduced during the PIAAC fieldwork was a responsive intervention with a view to improving the sample quality. While the re-issue phases aimed at obtaining as many interviews as possible, they also focussed on sample characteristics most likely related to basic skills as the central outcome of PIAAC. Both educational level and migration background, specifically the language skills in the assessment language (in this case German), are related to literacy and numeracy as measured in PIAAC. Sample monitoring had shown that both sample persons with low education and non-nationals had comparably lower response rates. Thus, a responsive design feature was introduced to optimize how non-nationals and sample persons with low education were to be addressed in the re-issue phase.
To identify these groups among the pool of cases to be re-issued, auxiliary data was taken from three sources: sampling frame, interviewer observations, and a commercial vendor database. An important point of discussion is the quality of the auxiliary data. Of the three data sources, the sampling frame data have the highest quality. However, only very limited information was available. In addition, even this data may not always have been fully accurate. The vendor database contains a wide range of interesting information, but it is not clear whether and how these data, which are aggregated at the level of small geographical clusters, are relevant at an individual level. Thus, they may not be as useful in explaining associations with variables of interest. The interviewer observations are the most up-to-date data since they are collected upon the first contact attempt. However, their quality may be questionable for several reasons. Although the survey protocol emphasized that this subjective evaluation was to take place before any contact had been established with the sample person, because at the time paper instead of electronic case protocols were still in place, there was no way of checking that interviewers had actually adhered to this in the field. This is less relevant for the information on the dwelling itself, which is more objective in nature. However, it is essential for the assessment of level of education in order to have comparable information quality for respondents versus nonrespondents. Furthermore, interviewers widely regarded this as a guessing exercise, and selected the middle category (intermediate education level) most often. Despite these shortfalls, our analyses indicate that the interviewers’ assessment of the education level was altogether a fairly good predictor of the actual educational level.
Our responsive approach sorted nonrespondents into five different groups. The sample persons with address-related issues and the non-contacts could be identified objectively and accurately following standard fieldwork procedures. Another objective was to identify sample persons with language-related problems. This was operationalized by selecting non-nationals using the citizenship information provided by the sampling frame. The main challenge, however, was to identify the group of nonrespondents with low education. We used classification trees to generate ten different prediction models. Our model-based approach was overall successful at predicting sample persons with low education. As mentioned above, the interview data confirmed the predicted low level of education in 63 % of the cases. Using citizenship as a proxy for potential language-related problems was even more successful: 87 % of the sample persons who received a tailored letter for non-nationals indeed had a non-German mother tongue.
Having identified the different groups of nonrespondents, the challenging question was how to tailor measures to their different needs in order to obtain as many interviews as possible. In PIAAC, possibilities for responsive approaches were extremely restricted. The survey design did not allow for changes in interview length or mode. The highest possible incentive (50 €) had been used from the outset. In Germany, as in many other countries, the data collection itself was carried out by a sub-contracted survey organisation, so that the PIAAC national centre had no direct access to the interviewers. Given the very restricted degrees of freedom, we decided to produce different tailored letters for the re-issue phase. It was clear, however, that such a measure could at best only have a rather weak effect on survey participation. For one, advance letters are not always opened or, even if they are, read carefully. Secondly, because of the lack of empirical findings on how best to address these nonrespondents, the different tailored letters were crafted based on our experience as survey practitioners and common sense. Finally, it is only one among numerous factors that contribute to the decision to participate in a survey.
The PIAAC national centre was committed to adhering to the best practices in survey methodology and undertook all possible efforts towards achieving the challenging PIAAC response rate goals, while limiting nonresponse bias. Nevertheless, it is necessary to evaluate whether the time and effort that went into modelling and creating the different re-issue tailored letters was well spent. It is sobering to acknowledge that only a very restricted number of sample persons with presumably low education (approximately 300) and non-nationals (115) were identified, yielding only 38 interviews for the former and 15 interviews for the latter group. The rate of successful refusal conversion was approximately 13 % for both groups, which is about the same as that for the fifth group of “other nonrespondents” who received a tailored letter of the type “one-size-fits-all.” We therefore have to question the actual impact of our intervention. It may be that we would have recruited even less non-nationals and sample persons with low education without this responsive design, but there was no control group to test this. An experimental design was not compatible with the fundamental PIAAC Germany fieldwork principle to invest every possible effort in gaining participation.
To sum, this explorative endeavour was worthwhile and informative in many ways. In our view, the model-based prediction of different types of nonrespondents is a promising approach. However, in hindsight, we need to question the cost-benefit balance of our modest responsive design, especially since the impact on the quality of the final net sample was negligible. This experience emphasizes the importance of filling in one of the big gaps in the area of survey methodology: the identification of effective and feasible responsive measures. In addition, we suggest that survey researchers and practitioners should continue their quest for additional and varied sources of paradata and auxiliary information, even rather unconventional ones.
References
- Blohm, M., & Koch, A. (2013). Respondent incentives in a national face-to-face survey: Effects on outcome rates, sample composition and fieldwork efforts. Methoden, Daten, Analysen. Zeitschrift für empirische Sozialforschung, 7(1), 89–122.
- Couper, M. P., & Wagner, J. (2012). Using paradata and responsive design to manage survey nonresponse. Unpublished manuscript. Retrieved from http://2011.isiproceedings.org/papers/450080.pdf
- De Leeuw, E. D., & De Heer, W. (2002). Trends in household survey nonresponse. A longitudinal and international comparison. In R. M. Groves, D. A. Dillman, J. L. Eltinge & R. J. A. Little (Eds.), Survey nonresponse (pp. 41–54). New York: John Wiley & Sons.
- Dixon, J., & Tucker, C. (2010). Survey nonresponse. In P. V. Marsden & J. D. Wright (Eds.), Handbook of survey research (2nd ed., pp. 593–630). Bingley: Emerald.
- European Social Survey. (2012). ESS5-2010 documentation report. The ESS Data Archive. (4.2 ed.): Norwegian Social Science Data Services. Retrieved from http://www.europeansocialsurvey.org/docs/round5/survey/ESS5_data_documentation_report_e04_2.pdf
- European Social Survey. (2013). ESS6-2012 documentation report. The ESS Data Archive (2.4 ed.): Norwegian Social Science Data Services. Retrieved from http://www.europeansocialsurvey.org/docs/round6/survey/ESS6_data_documentation_report_e02_4.pdf
- Groves, R. M., & Couper, M. P. (1998). Nonresponse in household interview surveys. New York: John Wiley & Sons.
- Groves, R. M., & Heeringa, S. G. (2006). Responsive design for household surveys: Tools for actively controlling survey errors and costs. Journal of the Royal Statistical Society: Series A, 169(3), 439–457.
- Groves, R. M., & Peytcheva, E. (2008). The impact of nonresponse rates on nonresponse bias: A meta-analysis. Public Opinion Quarterly, 72(2), 167–189.
- Helmschrott, S., & Martin, S. (2014). Nonresponse in PIAAC Germany. mda: methods, data, analyses, 8(2), 243–266.
- Kreuter, F. (2013). Facing the nonresponse challenge. The ANNALS of the American Academy of Political and Social Science, 645(1), 23–35.
- Kreuter, F. (2013). Improving surveys with paradata: Introduction. In F. Kreuter (Ed.), Improving surveys with paradata: Analytic uses of process information (pp. 1–9). Hoboken: John Wiley & Sons.
- Lynn, P. (2016). Targeted appeals for participation in letters to panel survey members. Public Opinion Quarterly, 80(3), 771–782.
- Lynn, P. (2017). From standardised to targeted survey procedures for tackling non-response and attrition. Survey Research Methods, 11(1), 93–103.
- Microm MARKET & GEO. (2011). Datenhandbuch. Unpublished document.
- OECD. (2010). PIAAC Technical Standards and Guidelines. Retrieved from http://www.oecd.org/site/piaac/publications.htm
- OECD. (2013a). OECD skills outlook 2013: First results from the Survey of Adult Skills. Paris: OECD Publishing.
- OECD. (2013b). Technical report of the survey of adult skills (PIAAC). Paris: OECD. Retrieved from http://www.oecd.org/skills/piaac/publications.htm
- Peytchev, A. (2013). Consequences of survey nonresponse. The ANNALS of the American Academy of Political and Social Science, 645(1), 88–111.
- Schouten, B., Calinescu, M., & Luiten, A. (2013). Optimizing quality of response through adaptive survey designs. Survey Methodology, 39(1), 29–58.
- Schouten, B., Cobben, F., & Bethlehem, J. (2009). Indicators for the representativeness of survey response. Survey Methodology, 35(1), 101–113.
- Stoop, I. A. L. (2005). The hunt for the last respondent: Nonresponse in sample survey. The Hague: Social and Cultural Planning Office of the Netherlands.
- Tourangeau, R., Brick, M. J., Lohr, S., & Li, J. (2017). Adaptive and responsive survey designs: A review and assessment. Journal of the Royal Statistical Society: Series A (Statistics in Society), 180(1), 203–223.
- Wagner, J. R. (2008). Adaptive survey design to reduce nonresponse bias. (doctoral dissertation), Institute for Social Research, University of Michigan, Ann Arbor. Retrieved from https://deepblue.lib.umich.edu/handle/2027.42/60831
- Wasmer, M., Scholz, E., & Blohm, M. (2010). Konzeption und Durchführung der „Allgemeinen Bevölkerungsumfrage der Sozialwissenschaften“ (ALLBUS) 2008. Bonn: GESIS – Leibniz Institute for the Social Sciences.
- Wasmer, M., Scholz, E., Blohm, M., Walter, J., & Jutz, R. (2012). Konzeption und Durchführung der “Allgemeinen Bevölkerungsumfrage der Sozialwissenschaften” (ALLBUS) 2010. GESIS–Technical Reports. Cologne: GESIS – Leibniz Institute for the Social Sciences.
- West, B. T. (2013). An examination of the quality and utility of interviewer observation in the National Survey of Family Growth. Journal of the Royal Statistical Society: Series A (Statistics in Society), 176(1), 211–225.
- West, B. T., & Sinibaldi, J. (2013). The quality of paradata: A literature review. In F. Kreuter (Ed.), Improving surveys with paradata: Analytic uses of process information (pp. 339–359). Hoboken: John Wiley & Sons.
- Zabal, A. (2014). The challenge of meeting international data collection standards within national constraints: Some examples from the fieldwork for PIAAC in Germany. mda: methods, data, analyses, 8(2), 175–198.
- Zabal, A., Martin, S., Massing, N., Ackermann, D., Helmschrott, S., Barkow, I., & Rammstedt, B. (2014). PIAAC Germany 2012: Technical report. Muenster: Waxmann.
-
Keywords
calibration CATI coverage coverage bias cross-national surveys data linkage data quality European Social Survey experiment face-to-face face-to-face survey Facebook hard to reach populations incentives item nonresponse measurement measurement error mixed-mode surveys multitasking non-probability samples Nonresponse nonresponse bias nonresponse rates paradata PIAAC Probability sample probability samples QR codes rare populations response rate Satisficing social desirability Social media survey survey-taking climate survey data survey management survey methods Telephone survey telephone surveys total survey error unit nonresponse validity web survey Web surveys weighting
