

Fieldwork Monitoring in Practice: Insights from 17 Large-scale Social Science Surveys in Germany
Meitinger K., Stadtmüller S., Silber H. et al. (2020). Fieldwork Monitoring in Practice: Insights from 17 Large-scale Social Science Surveys in Germany. Survey Methods: Insights from the Field. Retrieved from https://surveyinsights.org/?p=12237
© the authors 2020. This work is licensed under a Creative Commons Attribution 4.0 International License (CC BY 4.0) 
Abstract
This study provides a synopsis of the current fieldwork monitoring practices of large-scale surveys in Germany. Based on the results of a standardized questionnaire, the study summarizes fieldwork monitoring indicators used and fieldwork measures carried out by 17 large-scale social sciences surveys in Germany. Our descriptive results reveal that a common set of fieldwork indicators and measures exist on which the studied surveys rely. However, it also uncovers the need for additional design-specific indicators. Finally, it underlines the importance of a close cooperation between survey representatives and fieldwork agencies to optimize processes in fieldwork monitoring in the German survey context. The article concludes with implications for fieldwork practice.
Keywords
fieldwork measures, fieldwork monitoring, key performance indicators
Acknowledgement
We would like to thank James Wagner, Roberto Briceno-Rosas, and the participants of the fieldwork monitoring symposium in January 2019 in Mannheim, Germany, for their advice on a previous version of the manuscript. Disclaimer This paper represents the authors‘ personal opinions and does not necessarily reflect the views of the Deutsche Bundesbank or the Eurosystem.
Copyright
© the authors 2020. This work is licensed under a Creative Commons Attribution 4.0 International License (CC BY 4.0)
Fieldwork Monitoring: Indicators & Measures
Large-scale surveys collect valuable data for the social sciences. In recent decades, however, these surveys face the challenge of declining response rates (de Leeuw, Hox, & Luiten, 2018; Kreuter, 2013). This is particularly problematic if the final data are affected by nonresponse bias (Groves, 2006; Groves & Peytcheva, 2008). At the same time, survey researchers are confronted with restricted budgets while survey costs have increased (Groves & Heeringa, 2006). Fieldwork monitoring strategies may help to deal with both issues by increasing the efficiency of the data collection process, especially in costly face-to-face surveys (Peytchev, Baxter, & Carley-Baxter, 2009). Fieldwork indicators can inform about various aspects of fieldwork, such as the status of the active sample, interviewer productivity, or dataset balance and representativeness of the collected data. A close observation of the field allows for an early detection of suboptimal performances, risks of nonresponse bias, and inefficient processes. Therefore, fieldwork monitoring can optimize the process of data collection and give insights whether and which fieldwork measures should be implemented. Fieldwork measures are targeted activities to improve the data collection in the field period. Surveys can conduct fieldwork measures in the preparatory stage (e.g., interviewer training), during fieldwork (e.g., re-training of underperforming interviewers), and after the fieldwork stage (e.g., back-checks). In this context, computer-assisted data collection and fieldwork visualization tools provide the possibility to monitor the field in real-time (Bieber et al. 2020, Edwards, Maitland, & Connor, 2017; Groves & Heeringa, 2006; Vandenplas & Loosveldt, 2017).
Although a variety of articles describe the fieldwork monitoring strategy of specific surveys (e.g., Beullens, Loosveldt, Vandenplas, & Stoop, 2018; Malter, 2013), to the best of our knowledge, no article exists that summarizes and compares fieldwork indicators and measures of multiple large-scale surveys. The goal of this article is to provide an overview of the current situation of fieldwork monitoring in Germany and to identify indicators and measures that are frequently used and considered as relevant by survey representatives. This information is an important step toward best practices for fieldwork monitoring in Germany and beyond.
If we compare fieldwork indicators used and fieldwork measures carried out by various surveys, two different scenarios are possible: in Scenario 1, surveys may use a diverse set of indicators and measures, thus reflecting heterogeneity. This scenario is plausible since surveys vary considerably with regard to their design (e.g., cross-sectional vs. longitudinal), key variables of interest, target population, field time, and budgets. Financial and time constraints for monitoring the field as well as different quality standards may yield surveys focusing on indicators addressing different dimensions, such as the data collection effort, staff productivity, sample balance, survey output, and measurement process quality (Jans, Sirkis, & Morgan, 2013). Moreover, surveys may not only differ with regard to the indicators used for monitoring the field but also in their “operational rules” (i.e., in the thresholds for indicators) and in their reactions (i.e., fieldwork measures) when indicators flag issues in the field.
In contrast, in Scenario 2, most of the surveys may focus on almost the same set of indicators and measures, thus reflecting homogeneity. This scenario is plausible because the survey representatives share the same scientific environment, (presumably) read the same journals and visit the same conferences to receive input for their daily work. At the same time, they share the same contextual restrictions. For instance, they all have to adhere to the same national legislation with regard to data protection. Furthermore, many surveys receive their funding from the same agencies since the number of institutions funding large-scale surveys is limited. Most importantly, German surveys generally outsource data collection to commercial vendors (fieldwork agencies, such as Kantar or infas). Here again, the number of fieldwork agencies carrying out large-scale face-to-face surveys in Germany is very limited. They have their own routines in monitoring the field and in reporting indicators to their customers and only have a limited ability to adapt their protocols to the wishes of research institutes, in particular if this requires changes in software or deviations of interviewer routines. Since the fieldwork agency coordinates its interviewer staff, it is also the fieldwork agency – and not the scientific survey management teams– that implements fieldwork measures. As a consequence, a time lag may ensue between the detection of an issue in the fieldwork process and an intervention because the survey programs and the fieldwork agency must agree on appropriate measures. For survey representatives, this might further limit the number of feasible field measures and create a more homogeneous set of indicators frequently considered by the majority of survey programs.
In the following sections, we will first introduce our research question and describe our data and methods. In the results section, we will present the findings regarding the frequency and relevance of fieldwork indicators and measures of 17 large-scale social science surveys in Germany. We will conclude the present article with a discussion of our findings and practical implications.
Research Questions
The goal of this article is to provide an overview regarding the current situation of fieldwork monitoring in Germany and to give insights which indicators and measures are frequently used and considered as most relevant by the survey representatives of 17 large-scale social science surveys. We specifically aim at addressing the following research questions:
- Which fieldwork performance indicators are being monitored?
- Which fieldwork performance indicators are considered the most relevant and why?
- Which fieldwork measures are being carried out?
- Which fieldwork measures are considered the most relevant and why?
Methods & Data
The data for this article come from a questionnaire about study characteristics, monitored fieldwork indicators, and implemented fieldwork measures. The questionnaire was sent to the representatives of large-scale social sciences survey programs in Germany attending the GESIS Roundtable on fieldwork monitoring in Mannheim in April 2018 or the GESIS fieldwork monitoring symposium in Mannheim in January 2019. In addition, further large-scale social science surveys that were not represented at these events but collect data in Germany were contacted as well. Only additional face-to-face surveys were consulted, whereas surveys implementing other modes (CATI etc) were not contacted.
In sum, representatives of 17 surveys were invited to participate in the survey. Data collection was from August 2018 until February 2019.
Development & Content of Questionnaire
We developed the questionnaire in two stages. In the first stage, a list of relevant fieldwork indicators and measures was created based on existing literature on this topic (e.g., Blohm, 2016; Jans et al., 2013). In the second stage, two survey representatives provided feedback on this draft questionnaire and the research team improved the questionnaire based on that feedback.
The final version of the questionnaire asked the survey representatives to provide some general study characteristics and to report the monitored fieldwork indicators as well as measures of the last wave/study that has been implemented (see Online Appendix for full questionnaire). Regarding fieldwork, the questionnaire asked which indicators the survey program received from the fieldwork agency and which indicators were additionally calculated by the survey representatives. The indicators addressed the dimensions of “Interviewer or Data Collection Effort & Status of Active Sample,” “Interviewer or Staff Productivity,” “Dataset Balance and Representativeness,” “Survey Output,” and “Measurement Process Quality.” For a complete list of indicators by dimension see Table 2 (for an extensive list of indicators with their definitions see Online Appendix). Additionally, the questionnaire asked the survey representatives about the three most relevant indicators for fieldwork monitoring and to explain the reasons for their selection.
Regarding fieldwork measures, the questionnaire inquired which of the following measures the surveys carried out to improve their fieldwork: interviewer trainings (form, content, and responsibilities for training), introductory materials, incentives (type and conditions, assessing incentive effects), fieldwork procedures (e.g., minimum number of required contacts), and validation (e.g., back-checks and recordings of interviews). Once again, the representatives were asked to name the three most relevant measures and the reasons for their selection.
Participating Surveys
All contacted surveys participated (n=17; response rate: 100%). Table 1 contains an overview of the participating surveys and their survey characteristics. The participating German surveys are the German General Social Survey (ALLBUS), European Social Survey (ESS), European Values Study (EVS), GESIS Panel, German Internet Panel (GIP), German Longitudinal Election Study (GLES), National Educational Panel Study (NEPS), German Family Panel (pairfam), Panel on Household Finances (PHF), Panel Study Labour Market and Social Security (PASS), Programme for the International Assessment of Adult Competencies (PIAAC), Survey of Health, Ageing and Retirement in Europe (SHARE), German Socio-Economic Panel (SOEP) core, IAB-BAMF-SOEP study of refugees, SOEP migration samples, TwinLife, and World Values Survey (WVS). In total, our dataset contains eight cross-sectional surveys and nine panel surveys. Eleven surveys have a national scope, whereas six of the participating surveys are part of international comparative surveys. In this article, we will focus on the distinction between cross-sectional and panel surveys since no distinct pattern emerged between surveys with a national focus and surveys that are part of an international comparative survey.
Table 1. Survey characteristics of participating surveys
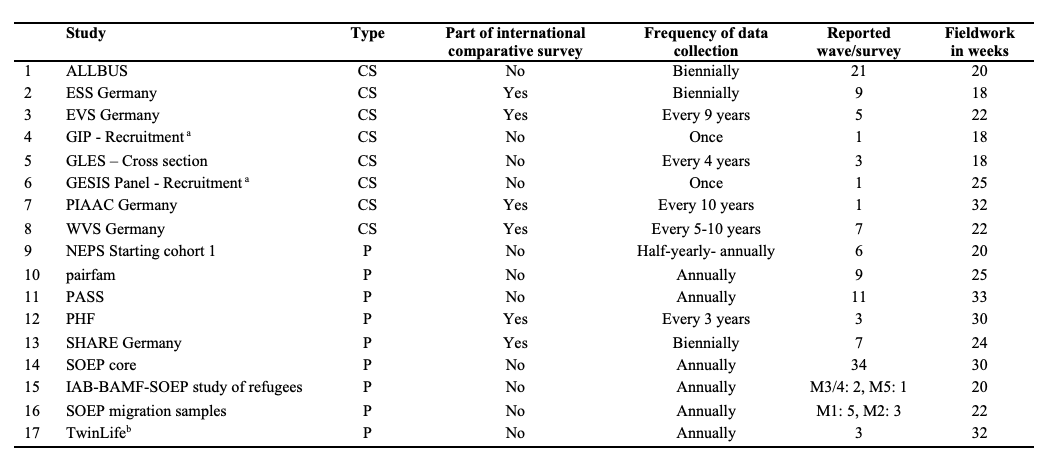
*Note: CS: Cross-sectional, P: Panel; M1-M5: Migration sample; a Although GIP and GESIS Panel are two panel surveys, the face-to-face recruitment interviews had a cross-sectional character. Since we report the fieldwork monitoring of the face-to-face recruitment interviews, GIP and GESIS Panel are counted as cross-sectional surveys in this article. b The TwinLife sample consists of two subsamples which surveyed the same survey program in two consecutive years, respectively. The fieldwork duration specified here is the mean of the durations of the two subsamples.
Results
In the following, we discuss the descriptive results. In a first step, we present the findings regarding the frequency and relevance of fieldwork indicators. In a second step, we present the findings regarding the frequency and relevance of fieldwork measures.
Fieldwork Indicators
We present the results for fieldwork monitoring indicators by the five main dimensions: 1) interviewer or data collection effort and status of active sample, 2) interviewer or staff productivity, 3) dataset balance and representativeness, 4) survey output, and 5) measurement process quality. We report whether the fieldwork agencies deliver these indicators or whether the surveys calculate them on their own. Since some survey representatives additionally calculate the same or a related indicator delivered by the fieldwork agency on their own, the numbers do not necessarily add up to 17 (total of participating surveys). We additionally report whether studies both receive and calculate indicators at the same time. Moreover, we report the results for the different indicators separately for cross-sectional and panel surveys. Finally, we indicate which indicators are perceived as the most relevant.
Interviewer or data collection effort & status of active sample. According to Table 2, most surveys monitor the number of contacted and uncontacted cases (16 surveys), the number of interviewers assigned to the study (15 surveys), and the number of interviewers actively working (12 surveys). Several surveys also monitor the indicators of mean number of contact attempts per case (10 surveys), interviewers per sample point (9 surveys), or the number of completed sample points (8 surveys).
Table 2. Frequency of reported types of indicators overall (all surveys combined), indicators delivered by the fieldwork agency, indicators derived by own calculation, or both, and reported indicators by type of study (cross-sectional or panel survey)
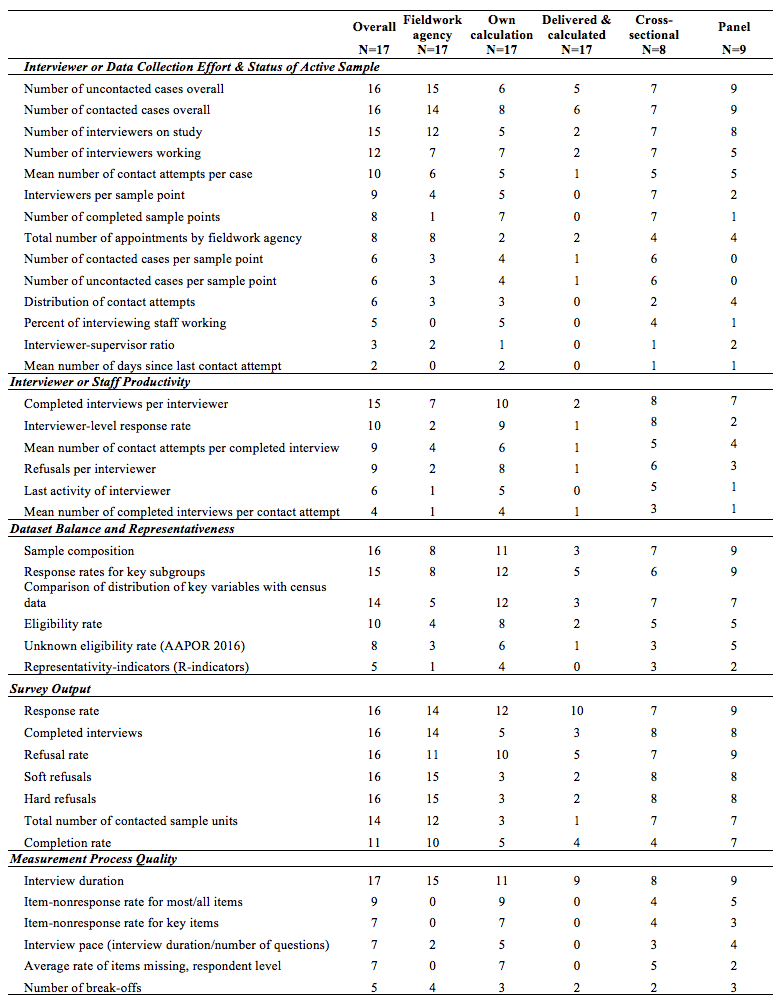
Most of the surveys directly receive these indicators from the fieldwork agency. Cross-sectional surveys tend to monitor a larger variety of indicators in this dimension. Several indicators were only or mostly used by cross-sectional surveys, such as the number of contacted and uncontacted cases per sample point (6 cross-sectional surveys respectively) and the number of completed sample points (7 cross-sectional surveys).
Regarding relevance, several survey representatives (6 surveys) rate the number of contacted cases overall as an important indicator when asked to report the three most important indicators for fieldwork monitoring (see Table 3). The survey representatives reason that this indicator is useful to assess the overall processing status of the sample as well as the activity level of the interviewers. It also gives insights whether the interviewers start working on the survey, whether they work continuously, and, therefore helps to swiftly detect fieldwork problems.
Interviewer or staff productivity. The most frequently mentioned indicator of interviewer or staff productivity is the number of completed interviews per interviewer (15 surveys; see Table 2). Most surveys additionally observe the interviewer-level response rate (10 surveys), the mean number of contact attempts per completed interview (9 surveys), or the number of refusals per interviewer (9 surveys).
Cross-sectional and panel surveys differ regarding the productivity indicators. More cross-sectional than panel surveys check the indicators of interviewer-level response rate, refusals per interviewer, and last activity of interviewer.
Dataset balance & representativeness. In our study, the survey representatives also reported that they inspect indicators of dataset balance and representativeness as part of their fieldwork monitoring effort. Widely used indicators in this dimension are sample composition (16 surveys), response rates for key subgroups (15 surveys), and comparison of the distributions of key variables with benchmark data (e.g., Microcensus data; 14 surveys). Most of the survey representatives calculate response rates for different age groups, gender, and nationalities but some also consider geographical aspects (e.g., regions, federal states), municipality size, or household type and composition. Several panel surveys also calculate the response rate by subsamples from different waves and study different groups based on their participation in previous waves (e.g., temporary drop-outs, contact frequency of last wave). The response rate for key subgroups is also rated as the most relevant indicator for dataset balance and representativeness (6 surveys, see Table 3) because it helps to assess the difficulty to interview specific target groups. Survey representatives also check this indicator for budget calculations and to adhere to study standards.
Most surveys calculate these indicators on their own instead of receiving them from the fieldwork agencies. Dataset balance and representativeness also seem to be an important dimension for panel surveys, in particular sample composition and response rates for key subgroups. This is mirrored in the fact that most panel surveys (5 out of 6 surveys) evaluate response rates for key subgroups as a relevant indicator.
Survey output. Survey output appears to be the most important dimension of fieldwork monitoring. Almost all survey representatives regularly check response rates, the number of completed interviews, the refusal rate, and the proportion of soft and hard refusals (16 surveys). Nearly all surveys also monitor the total number of contacted sample units (14 surveys) and the completion rate (11 surveys).
Most surveys directly receive these indicators from the fieldwork agency, but several surveys also calculate the response rate (12 surveys) and refusal rate (10 surveys) on their own. In particular, the response rate is frequently delivered and calculated by the survey representatives (10 surveys).
Survey output seems to be an important dimension for both cross-sectional and panel surveys since no differences were detected between the two study designs.
Overall, the response rate is frequently judged as the most important indicator (10 surveys, see Table 3). Most survey representatives evaluate this indicator as crucial because it reflects the willingness to participate in the survey, it helps to detect problems in the fieldwork early on, and it delivers important information for cost estimates of the fieldwork. For some of the surveys, the response rate is also relevant due to study standards (e.g., minimum response rates requirements). Another indicator that was frequently judged as important is the proportion of completed interviews (10 surveys) because it provides an overview over the field progress and serves as an indicator whether the survey runs smoothly.
Measurement process quality. The indicator most frequently used in the dimension of measurement process quality is the interview duration (17 surveys). This indicator is also frequently delivered by field agencies but additionally calculated by the surveys (9 surveys). Three surveys rate interview duration as one of the three most important indicators because it helps to assess whether the questionnaire has a reasonable length and whether it is affected by data quality issues (e.g., long duration: respondent burden, fatigue; short duration: deviations from standardized procedures by interviewers). The remaining indicators in this dimension (e.g., item nonresponse rate for all items and key items or the average rate of items missing on the respondent level) are often calculated by the surveys themselves. There are no major differences between cross-sectional and panel surveys in this dimension.
Table 3. Most frequently mentioned relevant indicators of fieldwork monitoring
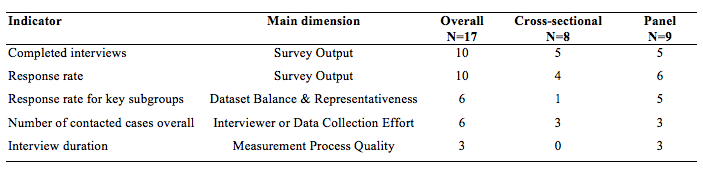
*Note: Table reports the most frequently mentioned indicators when survey representatives were asked to list the three most important indicators of fieldwork monitoring. We only list indicators that were mentioned by at least 3 survey representatives.
Fieldwork Measures
The indicators discussed in the previous section are closely related to fieldwork measures. Fieldwork measures can be implemented before (e.g., introductory materials), during (e.g., re-trainings of underperforming interviewers), or after data collection (e.g., back-checks) and mainly aim at increasing the response rate, ensuring data quality, and reducing nonresponse bias. In this section, we report the frequency of various fieldwork measures without distinguishing in detail between cross-sectional and panel surveys because no distinct pattern emerged for any of the study types (see Table 4).
Table 4. Fieldwork activities overall (all studies combined) and by study type (cross-sectional and panel study)
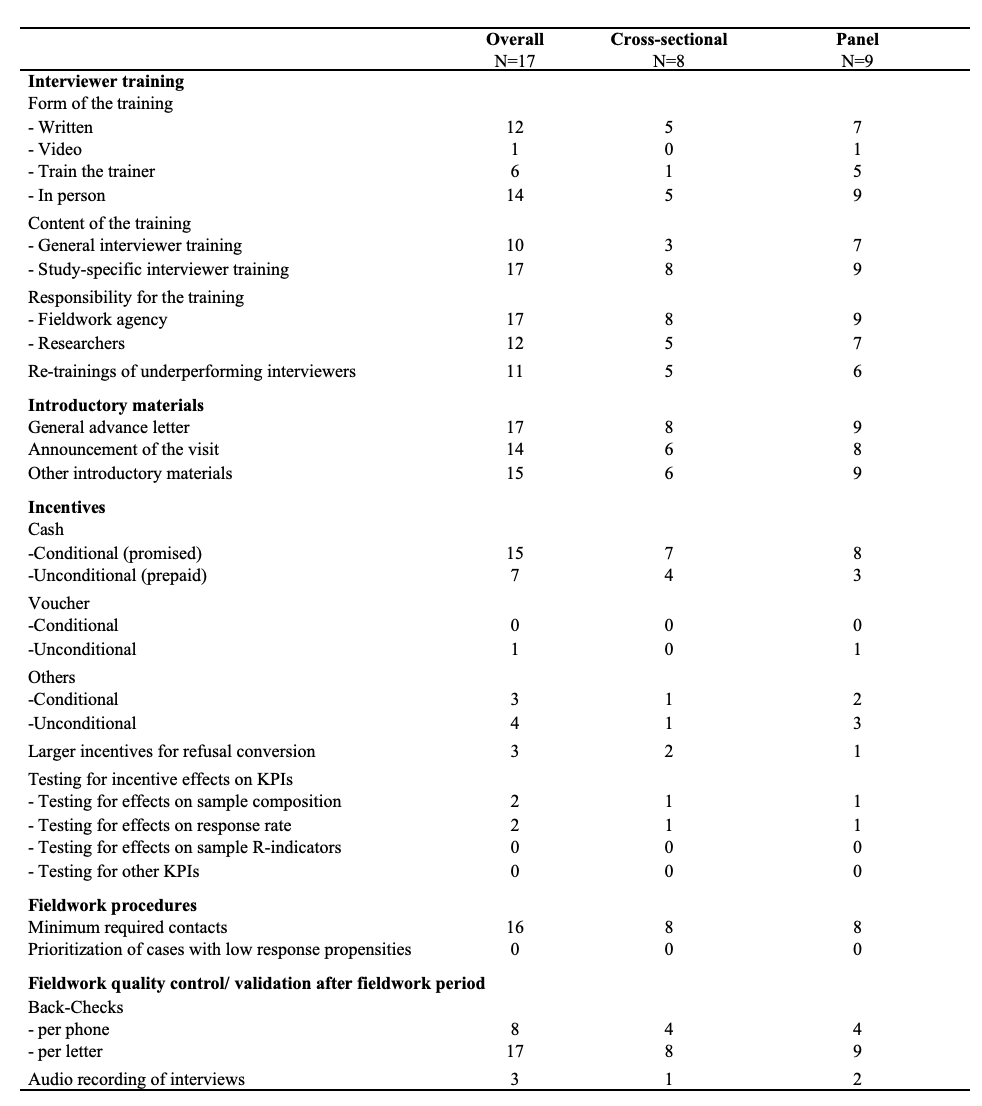
Interviewer training. Interviewer trainings can come in different forms. The majority of the surveys (14 surveys) rely on in-person interviewer trainings. Furthermore, most of the surveys provide additional interviewer training materials in written form (12 surveys) and one study provides video training materials. Interviewers of all surveys receive a study-specific interviewer training, but ten surveys provide a general interviewer training in addition. Regarding responsibility for the training, the fieldwork agency conducts the interviewer trainings for all surveys. In 12 surveys, researchers actively participate in the interviewer trainings and/or in the conceptual development of the trainings. During the fieldwork period, 11 surveys observe the performance of interviewers and, if necessary, conduct re-trainings of underperforming interviewers.
Interviewer training is also perceived as a very relevant fieldwork measure (9 surveys) because it can ensure that interviewers comply with complex survey protocols and study designs when conducting the interviews. Additionally, interviewers can receive advice regarding the interviewing of specific subgroups (e.g., older respondents, refugees). The interviewers can also learn specific doorstep strategies of successfully gaining respondent cooperation. Therefore, interviewer trainings can potentially prevent unit nonresponse. In addition, interviewer trainings can increase the motivation and commitment of interviewers. Finally, interviewers serve as representatives of a survey and interviewer training can equip interviewers with guidelines on how to represent the survey appropriately.
Introductory materials. All surveys send general advance letters to inform the respondent about the study and its purpose. Four surveys mentioned general advance letters as one of the three most important fieldwork measures because the letter can clarify what the participants can expect during the interview and can, thus, convince respondents to participate in the survey. Most of the surveys (14 surveys) integrate announcements of an upcoming interviewer visit in their advance letter and provide introductory materials (15 surveys; e.g., data privacy sheets, brochure with further information about the study). This material supports the interviewers in their work, informs the respondents, and helps to build trust between the interviewer and the prospective respondent.
Incentives. All surveys implement some form of incentives. Most surveys use cash incentives that are predominantly implemented as conditional (promised) incentives (15 surveys). Seven surveys additionally implement unconditional (prepaid) incentives. Given the different study designs (e.g., panel vs. cross-sectional surveys) and differences in the perceived response burden (length of the questionnaire), it is not surprising that the value of conditional cash incentives varies remarkably (i.e., from 5 to 50 €). However, the value of unconditional cash incentives varies less (between 5€ and 10€). Three surveys also increase the amount of their incentives during fieldwork in order to convert refusals.
Vouchers are rarely used as an incentive strategy. Only one study provides respondents with an unconditional voucher as an incentive. Slightly more surveys draw on other types of conditional (3 surveys) and unconditional incentives (4 surveys). Other incentives are for example discretionary budgets for incentives of interviewer’s choice for special cases during refusal conversion (doorstep incentives), small gifts (e.g., post-it blocks, magnifiers), or personalized feedback of results based on the individuals’ responses in prior waves (only panel surveys).
Many surveys (12 surveys) also rate incentives as one of the most important fieldwork measures. The representatives argue that it is the most cost-effective measure to increase response rates, that a compensation of the effort is important for many respondents, and that respondents seem to expect incentives for their participation. Survey representatives also think that incentives motivate respondents to provide more accurate answers during the survey interview and, thus, might help to improve data quality.
Some surveys also test for incentive effects on key performance indicators during the fieldwork period. Two surveys assess the effect on sample composition or evaluate their effects on the response rate.
Fieldwork procedures & quality checks. Regarding fieldwork procedures, all but one study require interviewers to contact respondents a minimum number of times. None of the studies indicated that it prioritizes cases with low response propensities as part of its fieldwork procedure in the reported wave. All surveys conduct some form of fieldwork quality control. Back-checks are carried out by all surveys by mail. Half of the surveys rely on additional back-checks per phone. Back-checks are considered as relevant because they can detect problematic interviewer behaviour and falsification. However, only three surveys check audio recordings of the interviews as an additional measure of control.
Close cooperation with fieldwork agency. Several surveys (5 surveys) underline that a close cooperation with fieldwork agencies is one of the most important factors for successful fieldwork at every stage of the fieldwork process. Before the actual data collection, survey representatives recommend discussing with the fieldwork agencies which indicators will be monitored and reported to facilitate the cooperation between fieldwork agencies and project teams. A common understanding of the monitored indicators also helps to set common goals and subsequently may help to increase data quality and response rates. During the fieldwork period, a regular exchange between fieldwork agencies and survey representatives facilitates a fast evaluation of different indicators (e.g., response rate), the discussion of possible fieldwork strategies, and the opportunity to intervene quickly if indicators flag problems in the fieldwork (e.g., underperforming interviewers). After the end of the fieldwork period, debriefing meetings with the fieldwork agency are considered important because they allow for a joint assessment of the fieldwork and to define strategies for the next (panel) waves.
Table 5. Most frequently mentioned fieldwork measures
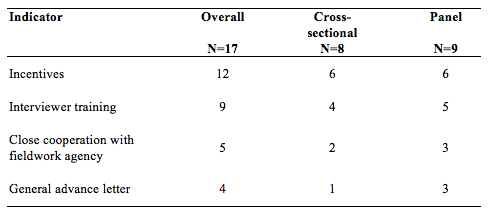
*Note: Table reports the most frequently mentioned fieldwork measures when survey representatives were asked to list the three most important fieldwork measures. We only list fieldwork measures that were mentioned by at least 3 survey representatives.
Discussion
Our overview grants unique insights in the fieldwork monitoring practices of 17 large-scale social science surveys in Germany. Overall, our results reveal that the vast majority of surveys focus on a core set of indicators that cover all dimensions of fieldwork monitoring. At the same time, some dimensions seem to play a more prominent role than others. For instance, the surveys not only unanimously rely on indicators in the dimension of survey output, but they also monitor a large variety of indicators in this domain. The same holds true for indicators in the dimension of dataset balance and representativeness. In other domains, however, only a few indicators are monitored by most surveys (e.g., the interview duration in the dimension of measurement process quality). In sum, a picture of homogeneity dominates that is even more evident when it comes to fieldwork measures: the core set of measures usually consists of an in-person study specific interviewer training, sending announcements of the upcoming visit, and providing introductory materials for respondents. Most surveys also use conditional cash incentives, require a minimum number of contacts, and conduct back-checks by mail. Other measures that have shown to increase response rates and to improve data quality are less frequently implemented, such as unconditional cash incentives (Pforr et al., 2015; Singer & Ye, 2013) or control of audio recordings of interviews (Ackermann-Piek, 2018, Biemer & Lyberg, 2003). Controlling audio-recording may often fall short due to data protection or privacy concerns as well as the fact that carrying out audio recordings is more difficult and work-intensive (and less common) in face-to-face than in telephone surveys. Moreover, it is very time-consuming to check and code the audio recordings.
Homogeneity is hardly surprising given that all surveys share the same “environment” and usually commission the process of data collection to (mostly the same) fieldwork agencies in Germany. At the same time, our results also reveal a certain degree of heterogeneity since in some dimensions there are several indicators on which roughly half of the studied surveys rely on. Besides the core set of indicators, surveys seem to use additional indicators to address particularities in their design. This heterogeneity is also due to different study designs. For example, cross-sectional and panel surveys differ regarding productivity indicators. More cross-sectional than panel surveys check the indicators of interviewer-level response rate, refusals per interviewer, and last activity of interviewer. A reason for the difference regarding those indicators could be that unit nonresponse is a more critical issue in cross-sectional surveys in which there is not an established interaction with the respondents due to a successful interview in a previous wave.
We also found an interesting difference between the type of indicators delivered by fieldwork agencies and those that are based on own calculations of the survey representatives. Fieldwork agencies seem to deliver mostly indicators of survey output and data collection effort, whereas survey representatives focus on calculating indicators of dataset balance. Some of the indicators are not delivered by or requested from the fieldwork agencies at all, in particular indicators of measurement process quality (e.g., item-nonresponse rates). One reason could be that fieldwork agencies have no easy way to access this type of data. Additionally, for some indicators many surveys report that they are both delivered by the fieldwork agency and additionally calculated by themselves (e.g., response rate, interview duration).
But are the most frequently monitored indicators and conducted measures also perceived as the most relevant indicators or measures? Overall, fieldwork indicators that are evaluated as relevant are also monitored frequently. Frequently monitored and relevant indicators are number of contacted cases overall, interviewer-level response rate, response rate for key subgroups, response rate and completed interviews as well as interview duration. However, not all frequently monitored indicators are also evaluated as relevant. In particular, none of the indicators of interviewer or staff productivity were mentioned as relevant indicators. Their perceived relevance might be lower since indicators dealing with interviewer of staff productivity reflect the progress in data collection only indirectly while other indicators (e.g., the number of completed interviews or the response rate) provide survey representatives with an immediate impression of the “success” of the survey. In a similar vein, fieldwork measures that were evaluated as relevant are also frequently conducted by the surveys. Relevant and frequently conducted measures are interviewer trainings, cash incentives, and general advance letters. In contrast, some of the frequently conducted measures were not mentioned as relevant, such as minimum required contacts or back-checks.
Overall, survey representatives emphasized the importance of being involved in the monitoring process. This may be due to different reasons. 1) Survey representatives want to actively monitor the fieldwork effort, 2) the survey representatives do not receive the indicators in the expected format or quality, 3) they do not receive the indicators that are most relevant for them, or 4) they want to circumvent a black box process and maximize transparency of the calculation of indicators. Once more, this underlines the importance of a close cooperation between the survey representatives and the fieldwork agencies. For an efficient fieldwork monitoring, a clear communication of a desired set of indicators and their calculation and the frequency of reporting is crucial. One way to ensure the delivery of a relevant set of fieldwork indicators is to already include them in the call for tender when selecting a fieldwork agency.
This summary of the current situation of fieldwork monitoring in Germany can be used as a starting point for empirical research into the effectiveness of key performance indicators and to develop best practices for fieldwork monitoring in Germany. The overview may be helpful for new survey programs to get an overview of the current state-of-the-art of fieldwork monitoring in Germany, and for experienced survey practitioners to compare their own fieldwork strategies to those used by other large-scale social science surveys and possibly reconsider their fieldwork monitoring strategy. Learning from the experience of surveys run in other contexts and countries can also be beneficial. Future research that includes other countries and regions will be necessary to provide an overview of international best practices. This research article focused on the perspective of survey representatives with regard to relevant fieldwork indicators and fieldwork measures. An interesting extension of this research would be to also investigate the perspective of fieldwork agencies regarding this topic. After all, in the German context successful fieldwork monitoring hinges on a close collaboration between survey representatives and fieldwork agencies.
Online Appendix
Questionnaire
References
- Ackermann-Piek, D. (2018). Interviewer effects in PIAAC Germany 2012. Mannheim [Doctoral dissertation].
- Beullens, K., Loosveldt, G., Vandenplas, C., & Stoop, I. (2018). Response Rates in the European Social Survey: Increasing, Decreasing, or a Matter of Fieldwork Efforts? Survey Methods: Insights from the Field. https://doi.org/10.13094/SMIF-2018-00003
- Bieber, Ina, Blumenberg, J. N., Blumenberg, M. S., & Blohm, M. (forthcoming). Using Geospatial Data to Monitor and Optimize Face-to-Face Fieldwork. Survey Insights: Methods from the Field.
- Biemer, P., & Lyberg, L. (2003). Introduction to survey quality. Hoboken, N.J.: Wiley.
- Blom, A. G. (2018). Survey Fieldwork. In: C. Wolf, D. Joye, T. W. Smith, Y. Fu (Eds.), Sage Handbook of Survey Methodology (pp. 382-396). Sage
- de Leeuw, E., Hox, J., & Luiten, A. (2018). International Nonresponse Trends across Countries and Years: An analysis of 36 years of Labour Force Survey data. Survey Insights: Methods from the Field.
- Edwards, B., Maitland, A., & Connor, S. (2017). Measurement Error in Survey Operations Management: Detection, Quantification, Visualization, and Reduction. In P. Biemer, E. de Leeuw, S. Eckman, B. Edwards, F. Kreuter, L. Lyberg, … B. West (Eds.), Total Survey Error in Practice (pp. 255–278). Wiley.
- Groves, R. M. (2006). Nonresponse rates and nonresponse bias in household surveys. Public Opinion Quarterly. https://doi.org/10.1093/poq/nfl033
- Groves, R. M., & Heeringa, S. G. (2006). Responsive design for household surveys: Tools for actively controlling survey errors and costs. Journal of the Royal Statistical Society. Series A: Statistics in Society. https://doi.org/10.1111/j.1467-985X.2006.00423.x
- Groves, R. M., & Peytcheva, E. (2008). The impact of nonresponse rates on nonresponse bias: A meta-analysis. Public Opinion Quarterly. https://doi.org/10.1093/poq/nfn011
- Jans, M., Sirkis, R., & Morgan, D. (2013). Managing Data Quality Indicators with Paradata Based Statistical Quality Control Tools: The Keys to Survey Performance. In F. Kreuter (Ed.), Improving Surveys with Paradata: Analytic Uses of Process Information (pp. 191–229). Hoboken, New Jersey: John Wiley & Sons. https://doi.org/10.1002/9781118596869.ch9
- Kreuter, F. (2013). Facing the Nonresponse Challenge. Annals of the American Academy of Political and Social Science. https://doi.org/10.1177/0002716212456815
- Malter, F. (2013). Fieldwork Monitoring in the Survey of Health, Ageing and Retirement in Europe (SHARE). Survey Methods: Insights from the Field. https://doi.org/10.13094/SMIF-2014-00006
- Montalvan, P., Lemay, M., & Thornton, N. (2016). Field Operations. In OECD (Eds.), Technical Report of the Survey of Adult Skills PIAAC. 2nd Edition. http://www.oecd.org/skills/piaac/PIAAC_Technical_Report_2nd_Edition_Full_Report.pdf
- Peytchev, A., Baxter, R. K., & Carley-Baxter, L. R. (2009). Not all survey effort is equal: Reduction of nonresponse bias and nonresponse error. Public Opinion Quarterly. https://doi.org/10.1093/poq/nfp037
- Pforr, K., Blohm, M., Blom, A. G., Erdel, B., Felderer, B., Fräßdorf, M., … Rammstedt, B. (2015). Are Incentive Effects on Response Rates and Nonresponse Bias in Large-scale, Face-to-face Surveys Generalizable to Germany? Evidence from Ten Experiments. Public Opinion Quarterly. https://doi.org/10.1093/poq/nfv014
- Singer, E., & Ye, C. (2013). The Use and Effects of Incentives in Surveys. Annals of the American Academy of Political and Social Science. https://doi.org/10.1177/0002716212458082
- Stadtmüller, S., Silber, H., Daikeler, J., Martin, S., Sand, M., Schmich, P., Schröder, J., Struminskaya, B., Weyandt, K. W., & Zabal, A. (2019). Adaptation of the AAPOR Final Disposition Codes for the German Survey Context. Mannheim, GESIS – Leibniz-Institute for the Social Sciences (GESIS – Survey Guidelines). doi: 10.15465/gesis-sg_en_026.
- Vandenplas, C., & Loosveldt, G. (2017). Modeling the weekly data collection efficiency of face-to-face surveys: Six rounds of the European Social Survey. Journal of Survey Statistics and Methodology. https://doi.org/10.1093/jssam/smw034
-
Keywords
calibration CATI coverage coverage bias cross-national surveys data linkage data quality European Social Survey experiment face-to-face face-to-face survey Facebook hard to reach populations incentives item nonresponse measurement measurement error mixed-mode surveys multitasking non-probability samples Nonresponse nonresponse bias nonresponse rates paradata PIAAC Probability sample probability samples QR codes rare populations response rate Satisficing social desirability Social media survey survey-taking climate survey data survey management survey methods Telephone survey telephone surveys total survey error unit nonresponse validity web survey Web surveys weighting
