

Effective Strategies for Recording Interviewer Observations: Evidence from the PASS Study in Germany
West B.T. & Trappmann M. (2019). Effective Strategies for Recording Interviewer Observations: Evidence from the PASS Study in Germany in Survey Methods: Insights from the Field. Retrieved from https://surveyinsights.org/?p=12538
© the authors 2019. This work is licensed under a Creative Commons Attribution 4.0 International License (CC BY 4.0) 
Abstract
This article investigates how different strategies used by interviewers when recording interviewer observations relate to observation accuracy. Before conducting interviews in a refreshment sample of the general population for the German PASS panel study, interviewers were asked to observe one key target variable of the study -- whether a household is at risk of poverty or not -- for all sampled households. In addition, interviewers recorded what strategies they had used to make their observations. For responding households, we assessed the accuracy of the observation by comparing it to an actual survey measure of poverty risk. Separate multilevel regression models attempting to explain the observed interviewer variance in observation accuracy for two types of households (those at risk and not at risk of poverty) using case-level strategies and aggregate interviewer tendencies reveal unique strategies that result in more accurate observations for each type of household. An aggregate fixed-effects model then reveals strategies that prove to be effective regardless of the type of household when accounting for unobserved interviewer heterogeneity.
Keywords
interviewer observations, paradata, PASS Study, survey nonresponse
Copyright
© the authors 2019. This work is licensed under a Creative Commons Attribution 4.0 International License (CC BY 4.0)
Introduction
Survey research organizations often ask interviewers hired for face-to-face survey data collections to record their observations about selected features of all sampled households. This practice serves two purposes: informing survey managers about ancillary features of sampled households that may not be available in other data sources (i.e., a type of paradata), and, provided that the observations correlate with response propensity and key survey measures of interest, nonresponse adjustment.
For interviewer observations to serve these purposes, they need to be free from error, and several recent studies have suggested that this is not the case (West 2013; West and Kreuter 2013; Sinibaldi et al. 2013; West, Kreuter, and Trappmann 2014; West and Kreuter 2015; West and Kreuter 2018; West and Li 2019). These studies have suggested that interviewers vary substantially in terms of the accuracy of these recorded observations, and this can be especially problematic if survey researchers design the observations to be proxy measures of key survey variables (e.g., West and Little 2013; West and Kreuter 2015). Design strategies are therefore necessary to stabilize accuracy rates among interviewers and produce the highest-quality ancillary data for the two aforementioned purposes.
Recent work in this area has suggested that the widely studied phenomenon of observer bias could be causing this variance in observation accuracy rates among interviewers (West and Kreuter 2018; West and Li 2019). Briefly, in the absence of prior training and instruction on specific observation tasks, interviewers left to their own observational strategies may tend to focus on cues that they “naturally” deem to be relevant for the feature of interest and base their observations on those cues. Accordingly, variance among interviewers in their backgrounds, home locations, social views, and other factors may ultimately lead to interviewers using different “native” strategies when recording these observations. Recent work has indicated that this is in fact the case (West, Kreuter and Trappmann 2014; West and Kreuter 2018; West and Li 2019), with different interviewers tending to look for different cues depending on the feature being observed, and certain cues having stronger associations with observation accuracy. These studies have suggested that a more holistic approach to recording these observations, drawing on a variety of relevant cues and intuitions, leads to observations that are more accurate. Efforts to standardize this process and ensure that all interviewers are tending to look for the same “relevant” cues, depending on the observation and population of interest, therefore have potential for improving the quality of this practice.
Unfortunately, much of the prior work on this problem has been limited to one survey in the United States (the National Survey of Family Growth), with specific subject matter and specific types of tailored interviewer observations. With the present study, we sought to replicate some of this recent work examining the different strategies being used by field interviewers to record tailored interviewer observations in the field in a different survey context altogether. We focus on the PASS study in Germany (Trappmann et al. 2019), which is a national panel survey of labor market and social security, where face-to-face interviewers were recently asked to observe whether a sampled household is at risk of poverty, along with the type and state of a sampled building. Importantly, PASS also measured risk of poverty in the survey, enabling validation of the recorded observations. Given our objective of replication and assessment of whether similar variance in the use of different observational cues arises in a different survey setting, we sought to examine the observational strategies used by PASS interviewers and their associations with observation accuracy.
Methods
Study Design
PASS study managers asked the interviewers conducting face-to-face interviews using CAPI in Wave 11 of the study to record observations for each household in a new refreshment sample of the residential population drawn from population registers. The observations were about being at risk of poverty, which is a target variable of the survey, and about the type and state of the building. Being at risk of poverty is defined as having an equivalized net household income of less than 60 percent of the median, where “equivalized” means that the actual income is divided by an adjustment factor for household size and composition (Förster and D’Ercole 2012). Interviewers received this definition and a benchmark statistic that about 17 percent of all households in Germany are at risk of poverty, including 15 percent in the western part and 20 percent in the eastern part.
The focus in this paper will be on the interviewer observation of risk of poverty. After recording this observation (yes / no), interviewers were asked a question about the strategies used to reach this assessment (half-open; check all that apply). These strategies included using information on:
• A: the reputation of the residential area,
• B: the immediate surroundings of the residential unit,
• C: the type of the building,
• D: the physical condition of the building,
• E: the impression of the inside of the apartment,
• F: the impression of the target person, or
• G: something else that interviewers could enter in an open-ended response format (see Table A1 in the appendix for the exact question wording).
Interviewers recorded these observations at the first visit to a sampled household, noting them on a paper form prior to the start of the interview. The survey managers explained to the interviewers in training that the observations would only be useful if entered in advance and that the managers would not use them for interviewer performance evaluation in any way. For all interviews that did not begin immediately at the first personal visit of the interviewer, the interviewers entered the observation data recorded on paper into the laptop before the interview started. Only when the interview started right away was there no time for this, and interviewers entered the observations after the interview was completed.
We linked the observations on poverty risk to survey data recorded for Wave 11 respondents, which included an indicator for being at risk of poverty at the household level. Interviewer observations are available for 1,142 of the 1,183 households in the sample (96.5 percent). For 1,049 (93.5 percent) of these observations, a survey report on being at risk of poverty could be constructed. One-hundred sixty-seven (167) different interviewers recorded the observations.
Data Analysis
Data analysis began with an inspection of descriptive statistics for the recorded interviewer strategies at the household and interviewer levels. We first used chi-square tests adjusting for clustering by interviewer (Donner and Klar 2000) and Pearson correlations to examine the associations between: 1) the interviewer observation of poverty risk and the binary indicator of poverty risk from the survey; 2) the interviewer observation and a binary indicator of responding to the face-to-face survey request; and 3) the interviewer observation and other relevant survey variables (welfare benefit receipt and equivalized household income). We then computed percentages of observations that were accurate for each interviewer based on the respondent reports only. We found that 91.7 percent of those not at risk of poverty were classified correctly by the interviewers, suggesting that this is an easier task, while only 32.9 percent of those at risk of poverty were classified correctly. These results suggested that different strategies may be necessary for these two different types of households, and we subsequently stratified our multivariable analyses depending on the type of household (according to the survey reports).
Next, we fit two multilevel logistic regression models to binary indicators of recording an accurate observation for each type of household (at risk or not at risk of poverty). These models included:
1) the fixed effects of the recorded strategies for each observation;
2) random interviewer effects, to account for any between-interviewer variance (and hence within-interviewer correlation) in accuracy; and
3) fixed effects of interviewer-level covariates representing the aggregate reported poverty status from all of their completed interviews (as a proxy of the poverty level of the area where they were working) and aggregate observational tendencies based on their recorded strategies (consistent with West and Li 2019).
We fitted these models using the melogit command in the Stata 15.1 software.
As the true status of a household is not known in advance, these models are informative for descriptive purposes, but not directly useful for informing future interviewer trainings on optimal strategies for making interviewer observations in general. We therefore also fit an aggregate fixed-effects model, including fixed effects of the interviewers, to a combined data set including both types of households to re-evaluate the relationships of the different strategies with accuracy when accounting for any unobserved between-interviewer heterogeneity captured by the fixed effects. This included heterogeneity with respect to workload composition, in terms of the number of assigned households truly at risk of poverty. This fixed-effects model also included the survey measure of risk of poverty as a covariate. These models were fitted using the xtlogit, fe command in Stata.
Results
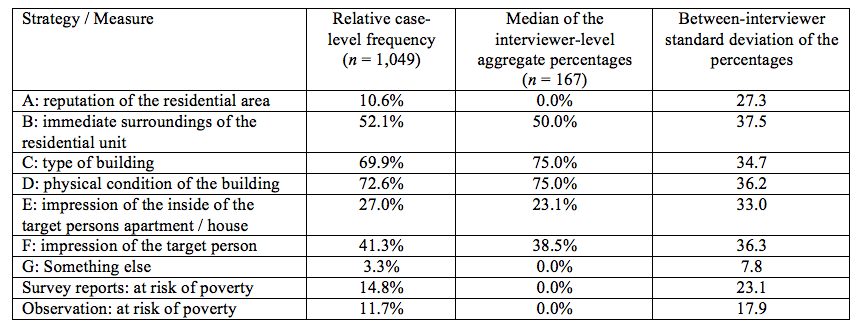
Table 1 shows the frequency of each strategy at the individual (i.e., household) level and the medians and standard deviations of the aggregate percentages at the interviewer level (e.g., if an interviewer used strategy A for 50 percent of her observations, her contribution to these interviewer-level statistics would be 50). The most popular strategies included those that did not require the interviewer to contact the target person. Interviewers took the physical condition of the building into account in 72.6 percent of all observations, and the type of the building into account in 69.9 percent of the observations. Interviewers also took the immediate surrounding area of the residential unit into account in most of the cases (52.1 percent). Interviewers could only evaluate their impression of the target person and the inside of the target person’s apartment in cases where an actual personal contact took place and – in the latter case – the household member invited the interviewer into the housing unit. Interviewers used these strategies in 41.3 percent (impression of target person) and 27.0 percent (inside of apartment) of the observations. The least popular strategy was using the reputation of the residential area (10.6 percent of observations). In only 3.3 percent of the cases did interviewers report some other strategy. As these responses require an open-ended answer about the type of strategy used, choosing this answer implies additional burden for the interviewer. Concerning the true value of the risk of poverty attribute, 14.8 percent of the responding households were at risk of poverty. This finding suggests that estimating the poverty status of these types of households may be more difficult simply due to their relatively low frequency in the sample.
The 167 interviewers recorded between one and 49 observations each, with a mean of 6.3. At the interviewer level, the range of the percentages indicating how often each of the strategies (A through F) were used was between zero and one hundred percent – meaning that for each strategy there was at least one interviewer who never used it and at least one interviewer who always used it. In contrast, the open answer category “something else” was not used by any interviewer for more than 60 percent of her workload. The percentage of respondents that reported being at risk of poverty varied substantially among the interviewers, ranging from no one in the workload to everyone in the workload with a standard deviation of 23.1. Table 1 also provides the medians of the aggregate interviewer-level percentages of observations using a specific strategy, in addition to the between-interviewer standard deviations in these percentages.
Table 1: Descriptive statistics for the frequencies of the specific strategies used when recording the risk of poverty observations, in addition to the two measures of risk of poverty.
We found a very modest correlation between the interviewer observations and the response indicator (-0.05). This indicates limited usefulness of this observation for nonresponse adjustment (although the association is at least in the expected direction and statistically significant). An estimated 14.8 percent of the respondents reported being at risk of poverty, and the interviewers underestimated this number (11.7 percent). The correlation between the interviewer observation and the survey reports was much stronger (0.27). Overall, roughly 83 percent of all observations agreed with the survey report. This high agreement rate is probably because the variable has a very strong mode (85.2 percent of households are not at risk of poverty). We found correlations of a similar size between the interviewer observation and related variables like welfare benefit receipt (0.19), and equivalized income (-0.22).
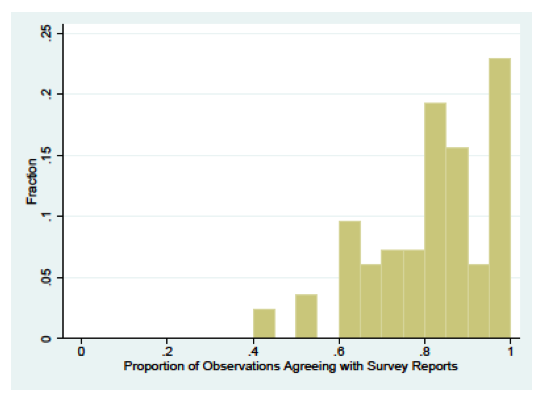
Figure 1 illustrates the overall between-interviewer variance in observation accuracy. This figure only presents results for the 83 interviewers with five or more observations. About one quarter of the interviewers had all of their observations correct. Another 40% had from 80 to under 95 percent correct. About 25% had 60% to 80% correct, while only 6% of the interviewers had less than 60 percent of their observations correct. Consistent with the prior literature, these results illustrate substantial between-interviewer variance in observation accuracy, and this clearly may have been due to the types of households assigned to each interviewer.
Figure 1: Proportions of 83 interviewers (making five or more observations) with specific levels of observation accuracy.
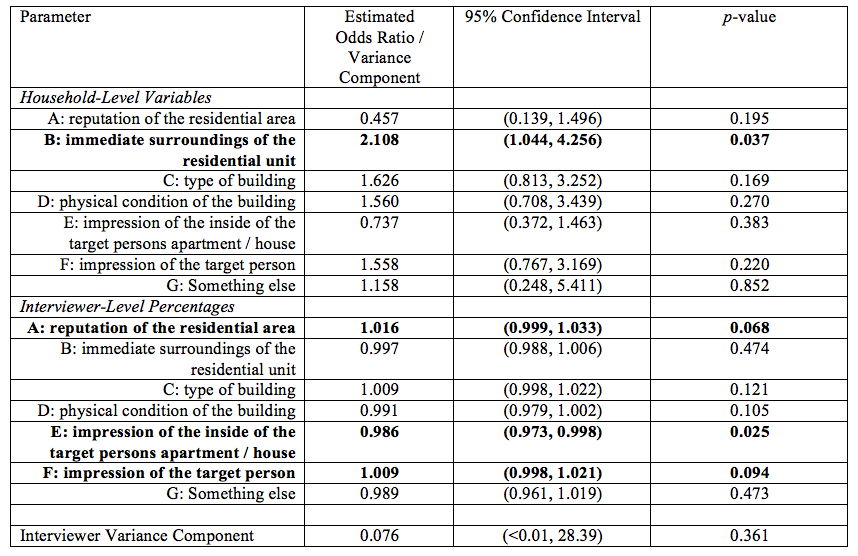
Next, we turn to our multilevel modeling results. We first consider the model for accuracy for those households that were not at risk of poverty. Table 2 demonstrates a significant (p < 0.05) relationship of taking the immediate surroundings of the building into account (strategy B) at the household level with the probability of an accurate observation, where using this strategy increases the odds of an accurate observation by about 111%. At the interviewer level, a one-percentage-point increase in the percentage of observations using the impressions of the inside of the target person’s housing unit reduces the odds of an accurate observation by about 1.4%. Additionally, at the 0.10 significance level, a one-percentage-point increase in the percentage of observations using the reputation of the residential area significantly increases accuracy by about 1.6%, and a one-percentage-point increase in the percentage of observations using the impression of the target person significantly increases accuracy by about 0.9%. We did not find any other significant predictors of observation accuracy for these types of households, and we found very little evidence of unexplained interviewer variance in accuracy. Collectively, these results suggest that taking the immediate surroundings of the housing unit into account may be beneficial for this particular type of household, while relying on observations of the insides of housing units may not be entirely productive.
Table 2: Estimated multilevel model for observations made on households not at risk of poverty, predicting a binary indicator of a household-level observation of the risk of poverty being correct based on respondent reports (162 interviewers, 894 observations).
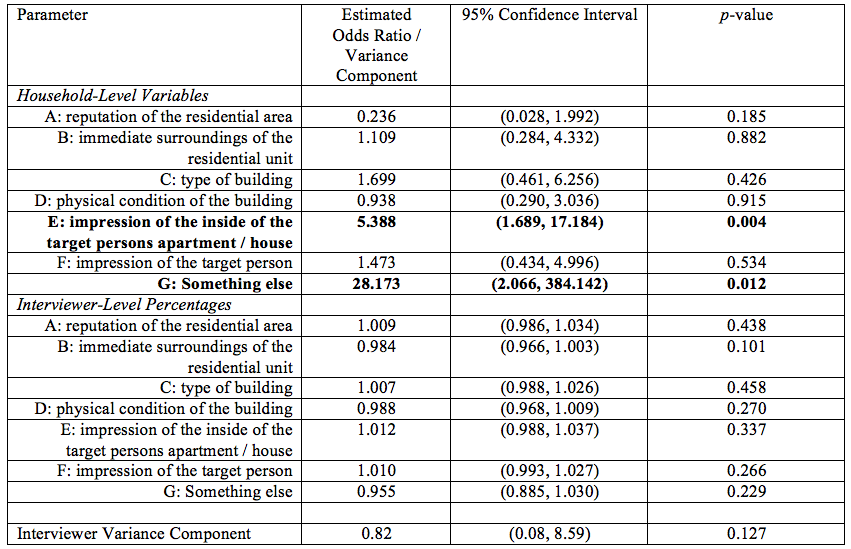
Second, we consider the model for accuracy for those households that were at risk of poverty. Despite the substantially reduced sample size, Table 3 presents evidence of positive relationships of taking impressions of the inside of the target person’s housing unit into account (unlike for households not at risk of poverty) and picking up on other cues (“something else”) with observation accuracy at the household level. We found that none of the aggregate tendencies had significant relationships with accuracy for these types of households. We also note a larger interviewer variance component for households of this type compared to Table 2, suggesting more unexplained variance in accuracy among interviewers (and further reflecting the difficulty of this task for these types of households).
Table 3: Estimated multilevel model for observations made on households at risk of poverty, predicting a binary indicator of a household-level observation of the risk of poverty being correct based on respondent reports (83 interviewers, 155 observations).
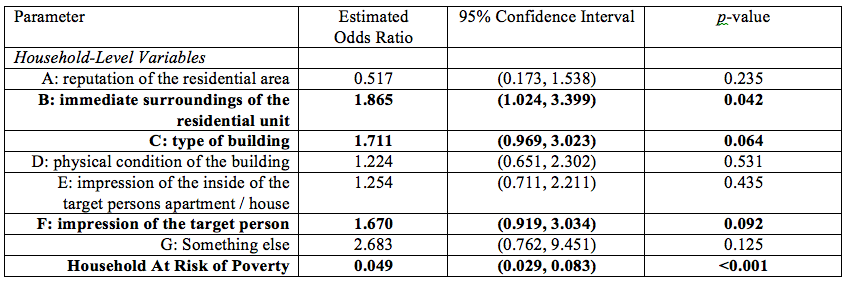
Finally, Table 4 presents estimated odds ratios for the household-level strategies from the fitted fixed-effects logit regression model. We note that this model only included data from 83 interviewers with variance in the dependent variable (i.e., they had at least one correct and one incorrect observation), given the fixed-effects specification. We see that when combining both types of households and adjusting for both unobserved interviewer heterogeneity in their assigned samples and the survey measure of being at risk of poverty, taking the immediate surroundings of the residential unit into account emerges as a positive correlate of accuracy. The type of building and an impression of the target person also emerge as marginally significant based on the combined sample (p < 0.10). The fixed-effects model appears to be detecting predictors that had reasonably large positive relationships with accuracy for both subgroups of households, regardless of their statistical significance (see Tables 2 and 3). These cues may be the most important for PASS interviewers to consider when making this observation, regardless of the types of households assigned to them.
Table 4: Estimated fixed-effects logit model, predicting a binary indicator of a household-level observation of the risk of poverty being correct based on respondent reports (83 interviewers, 785 observations).
Discussion
In this replication study, we once again find evidence of between-interviewer variance in the accuracy of an interviewer observation tailored to the content of a survey (risk of poverty, for a labor market survey in Germany). Investigating sources of this variance, which have important practical implications for training efforts designed to standardize accuracy across interviewers, we found that PASS interviewers drawing on cues from their surroundings (i.e., immediate surroundings of the residential unit, type of building) tended to record observations that are more accurate. There was also marginal evidence in favor of using impressions of the target person in each household, if possible. Collectively, these results provide additional support for a more “holistic” observational strategy that the literature has now suggested multiple times (West and Kreuter 2018; West and Li 2019). However, an interesting new finding of this study is that while holistic strategies might work well for correctly predicting traits that are frequent in the sample, more individualistic strategies might be required for making correct observations of rare traits.
Considering these results and related prior results in the literature, we feel that an important next step in this line of research is the implementation of randomized experiments during interviewer training designed to test the effectiveness of alternative training techniques for recording interviewer observations. Following this suggestion, a random subsample of interviewers could receive customized training in how to record these observations following only the strategies found to increase the accuracy of the observations, and a “control” subsample would be trained to use their best (or “native”) intuition when recording the observations. The results in this study support a hypothesis that the customized training approach would ultimately lead to standardized observations with higher accuracy and reduce the interviewer variance in observation accuracy that multiple studies have now demonstrated. Successful implementation of this type of experiment is necessary to test this hypothesis. Given the number of face-to-face surveys collecting these types of observations, additional efforts like this to stabilize the accuracy of the interviewer observations are necessary if this methodological practice is going to provide fruitful information for survey operations and estimation.
Appendix
Table A1: Question wording for interviewer observations and observational strategies used.
1. What do you think: Is the household at risk of poverty?
a. Yes, the household is at risk of poverty
b. No, the household is not at risk of poverty
2. How did you reach the assessment? (More than one answer is possible)
a. I used the reputation of the residential area to reach the assessment
b. I used the immediate surroundings of the residential unit to reach the assessment
c. I used the type of building to reach the assessment
d. I used the physical condition of the building to reach the assessment
e. I used the impression of the inside of the target persons apartment/ house to reach the assessment
f. I used the impression of the target person to reach the assessment
g. Something else [OPEN]: ……………………………………………………..
References
- Donner, A. and N. Klar (2000), Design and Analysis of Cluster Randomization Trials in Health Research, Arnold, London.
- Förster, M. F., & D’Ercole, M. M. (2012). The OECD Approach to Measuring Income Distribution and Poverty. In D. J. Besharov, & K. A. Couch (Ed.), Counting the Poor: New Thinking About European Poverty Measures and Lessons for the United States (pp. 27-58). Oxford: Oxford University Press.
- Sinibaldi, J., G. Durrant, and F. Kreuter (2013). Evaluating the measurement error of interviewer observed paradata. Public Opinion Quarterly, 77, 173–193.
- Trappmann, M., S. Bähr, J. Beste, A. Eberl, C. Frodermann, S. Gundert, S. Schwarz, N. Teichler, S. Unger, and C. Wenzig (2019): Data Resource Profile: Panel Study Labour Market and Social Security (PASS). International Journal of Epidemiology. https://doi.org/10.1093/ije/dyz041.
- West, B.T. (2013). An Examination of the Quality and Utility of Interviewer Observations in the National Survey of Family Growth. Journal of the Royal Statistical Society, Series A (General), 176(1), 211-225.
- West, B.T. and Kreuter, F. (2013). Factors Affecting the Accuracy of Interviewer Observations: Evidence from the National Survey of Family Growth (NSFG). Public Opinion Quarterly, 77(2), 522-548.
- West, B.T. and Kreuter, F. (2015). A Practical Technique for Improving the Accuracy of Interviewer Observations of Respondent Characteristics. Field Methods, 27(2), 144-162.
- West, B.T. and Kreuter, F. (2018). Strategies for Increasing the Accuracy of Interviewer Observations of Respondent Features: Evidence from the U.S. National Survey of Family Growth. Methodology, 14(1), 16-29.
- West, B.T., Kreuter, F., and Trappmann, M. (2014). Is the Collection of Interviewer Observations Worthwhile in an Economic Panel Survey? New Evidence from the German Labor Market and Social Security (PASS) Study. Journal of Survey Statistics and Methodology, 2(2), 159-181.
- West, B.T. and Li, D. (2019). Sources of Variance in the Accuracy of Interviewer Observations. Sociological Methods and Research, 48(3), 485-533.
-
Keywords
calibration CATI coverage coverage bias cross-national surveys data linkage data quality European Social Survey experiment face-to-face face-to-face survey Facebook hard to reach populations incentives item nonresponse measurement measurement error mixed-mode surveys multitasking non-probability samples Nonresponse nonresponse bias nonresponse rates paradata PIAAC Probability sample probability samples QR codes rare populations response rate Satisficing social desirability Social media survey survey-taking climate survey data survey management survey methods Telephone survey telephone surveys total survey error unit nonresponse validity web survey Web surveys weighting
