

Assessing Nonresponse Bias by Permitting Individuals to Opt Out of a Survey
Lewis T. (2020). Assessing Nonresponse Bias by Permitting Individuals to Opt Out of a Survey. Survey Methods: Insights from the Field. Retrieved from https://surveyinsights.org/?p=13357
© the authors 2020. This work is licensed under a Creative Commons Attribution 4.0 International License (CC BY 4.0) 
Abstract
The Federal Employee Viewpoint Survey (FEVS) is a Web-based organizational climate survey administered annually by the U.S. Office of Personnel Management. The survey targets full- or part-time, permanently employed civilian personnel from more than 80 U.S. government agencies. Despite increases in the scope, publicity, and uses of FEVS data, its response rate has gradually declined over time. In an effort to gauge the causes for nonresponse, this paper discusses results from an experiment fielded during the 2017 FEVS in which a portion of sampled individuals was given the opportunity to opt out from the survey. Before effectively being added to the “unsubscribe” list, however, the individual was asked to cite the primary reason for choosing not to take the FEVS. Using auxiliary information from the sampling frame, this article argues that inferences based on this item are valuable because opters out are generally representative of the larger pool of nonrespondents.
Keywords
Nonresponse, nonresponse bias, unit nonresponse, web survey
Acknowledgement
The author would like to thank Department of Commerce Labor-Management Forum members Laurie Schwede, Jennifer Childs, Gerson Morales, Paul Beatty, and Andrea Contratto for their input and feedback in the development of the opt out survey.
Copyright
© the authors 2020. This work is licensed under a Creative Commons Attribution 4.0 International License (CC BY 4.0)
Background
Relative to other survey modes, Web surveys offer the potential to collect higher quality data at a lower cost in a narrower field period (Bethlehem and Biffignandi, 2011), albeit oftentimes with a lower response rate (Manfreda et al., 2008; Shih and Fan, 2008). This is naturally of concern to applied researchers because, all else equal, a lower response rate increases the risk of nonresponse bias (Groves and Couper, 1998). Although there are numerous strategies one can pursue in the design and execution of Web-based surveys to increase response rates (e.g., Heerwegh and Loosveldt, 2006; Couper, 2008; Keusch, 2012; Dillman, Smyth, and Christian, 2014), because few of these surveys are compulsory, there is virtually always a need to compensate for nonresponse and assess the residual risk of bias it poses to point estimates.
A variety of techniques for assessing nonresponse bias have been proposed in the survey methodology literature. These techniques can be divided into two classes. The first class exploits auxiliary information on the sampling frame or from external sources. A critical limitation of these techniques is that they only indirectly measure nonresponse bias. A disparate demographic distribution, say, between respondents and known population figures will only introduce bias if those variables are also correlated with survey outcome variables (Little and Vartivarian, 2005) beyond what can be remedied by the given missing data compensation strategy employed (Little and Rubin, 2019). A second class of nonresponse bias assessment techniques seeks to extract information from a portion of nonrespondents to make inferences on the larger pool of nonrespondents. One strategy within this class is to follow up with (often a sample of) nonrespondents using a different mode or data collection protocol altogether (e.g., Criqui, Barrett-Connor, and Austin, 1978; Dallosso et al., 2003; Ingels et al., 2004; Stoop, 2004; Voogt, 2004; Groves et al., 2005). An inherent limitation of this second class of techniques is that the process of identifying nonrespondents for follow-up is itself subject to nonresponse bias, because not all nonrespondents can be contacted, and not all who are contacted comply with the subsequent data collection request. Moreover, requisite weighting of the follow-up cohort may lead to an increased unequal weighting effect (Kish, 1992) that can, in turn, decrease the precision of point estimates.
The purpose of this article is to report results from an experiment fielded in a self-administered Web survey to evaluate a novel strategy to assess nonresponse bias that combines elements of both classes of techniques described above and addresses some of their limitations. The notion is to offer individuals a way to opt out from a survey by embedding a link to effectively “unsubscribe” to further reminder emails. Prior to allowing the individual to opt out, however, he or she must first indicate the primary reason for deciding not to participate. Hence, the strategy taps directly into nonrespondents’ sentiments to learn why certain types of individuals decline the survey request. Additionally, though it may seem counterintuitive, introducing the opportunity to opt out also has the potential to increase the likelihood of participating, as it is believed to engender trust and empathy with the researcher (Sudman, 1985; Mullen et al., 1987).
Survey and Experimental Design
The survey data discussed in this paper were collected as part of the 2017 Federal Employee Viewpoint Survey (FEVS) (www.opm.gov/fevs). First administered in 2002, the FEVS—formerly the Federal Human Capital Survey—is an annual organizational climate survey administered to civilian employees of the U.S. federal government by the U.S. Office of Personnel Management (OPM). The survey instrument is chiefly attitudinal in nature, measuring various dimensions of employee satisfaction, such as one’s level of enjoyment with work performed, perceptions of management’s leadership skills, and availability of career progression opportunities.
Aside from a few minor exceptions, the FEVS sampling frame is derived from the Statistical Data Mart of the Enterprise Human Resources Integration (EHRI-SDM), a large-scale database of U.S. Federal government personnel maintained by OPM. The FEVS target population is full- or part-time, permanently employed (i.e., non-seasonal and non-political) civilian personnel who have been employed by their agency for at least six months prior to the start of the survey. As described in U.S. Office of Personnel Management (2017), a stratified sample of 1,139,882 employees from 85 agencies was selected for the 2017 FEVS that was fielded between May 2 and June 22, 2017. Agencies had staggered start and end dates, but each agency had a field period lasting exactly six weeks. On launch day, sampled employees were sent an email invitation to participate that contained a unique URL. Five weekly reminder emails were sent to nonrespondents thereafter, with the final reminder including wording to indicate that the survey would close at the end of the business day.
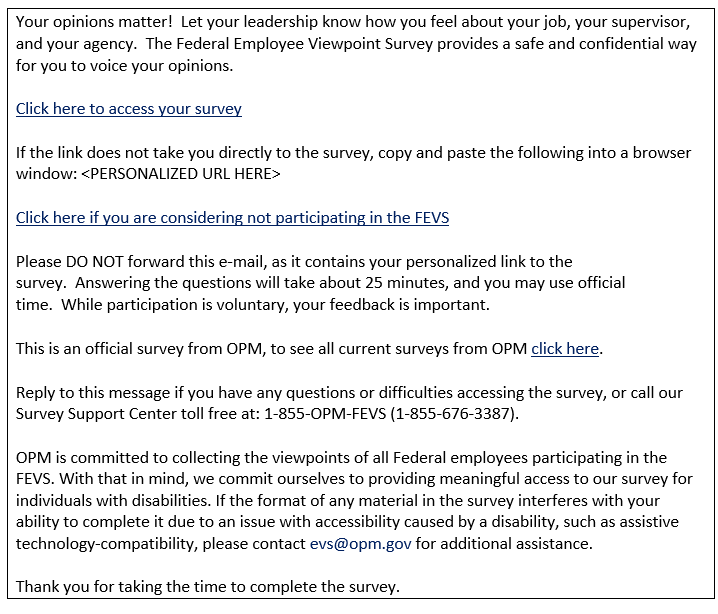
A total of 112,576 employees, roughly 10% of those sampled for the 2017 FEVS, were randomly selected to participate in the opt out experiment—small and independent agencies, often with fewer than 200 employees, were excluded. Figure 1 demonstrates the prototypical email body in which the opportunity to opt out was offered via a link labeled “Click here if you are considering not participating in the FEVS.” For those designated to be part of the opt out experiment, the link appeared in the initial invitation and all subsequent reminders. The link was absent in emails to employees not designated for the opt out experiment.
Figure 1: Example Email Invitation Body for the 2017 Federal Employee Viewpoint Survey Containing a Link to Opt Out.
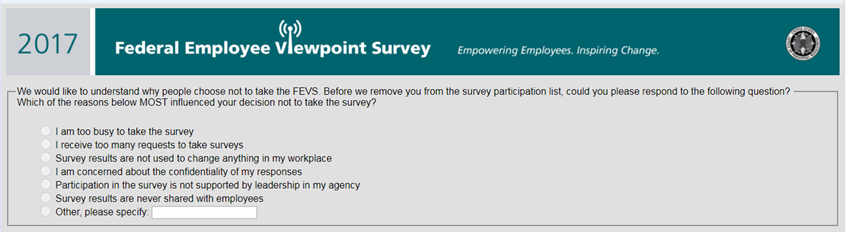
A short survey was launched when the link to opt out was clicked. The first question posed was “Would you say that you are unsure about participating in the FEVS, or that you do not wish to participate?” The intent of this question was to gauge the individual’s conviction level about not participating—essentially, to enable a proxy distinction between a soft and hard initial refusal. The second question in the opt out survey ascertained the single most influential reason for not wanting to participate in the 2017 FEVS. A screen shot of this question is given in Figure 2. Six options were offered (e.g., being too busy, data confidentiality concerns), which were drawn from results to an open-ended question included in a nonrespondent follow-up study fielded at the conclusion of the 2004 administration of the survey (U.S. Office of Personnel Management, 2006). Also included was a write-in option for someone to specify an unlisted reason. Two research team members independently recoded 176 write-in responses into new or existing categories, with 28 initially discordant recodes requiring reconciliation. Some of the reasons unaccounted for by the original set of response options include a recent or pending employment status change, technical issues accessing the survey, and a belief that one had already taken the survey. In all, 126 of the write-in responses were grouped into new or existing categories, while the other 50 remained classified as “Other.”
Figure 2: Screenshot of Opt Out Survey Question Regarding One’s Primary Reason for Refusing to Participate in the 2017 Federal Employee Viewpoint Survey.
Upon answering the question shown in Figure 2, a randomly predetermined 75% of individuals received a last-moment appeal in the form of a succinct, bulleted list of 3-4 assurances about which the individual may not have been aware. These assurances were tailored to the response given (e.g., brief itemization of protections in place for those expressing confidentiality concerns). The complementary 25% of individuals were routed to a page with short message stating no further email reminders to participate would be sent from the FEVS administration team, but that the survey link would remain active in case the individual changed his or her mind before the end of the field period. The purpose of this randomization—and the first opt out survey question regarding nonresponse conviction level—was to assess the effectiveness of the last-moment appeal, which we viewed as an automated refusal conversion procedure of sorts. Results pertinent to that research objective can be found in Lewis et al. (2019). The express purpose of this article is to report on the other research objective underpinning this experiment: to assess whether those who opt out are representative of the larger pool of 2017 FEVS nonrespondents.
Results
The flowchart in Figure 3 summarizes core dispositions and associated counts for individuals randomly selected for the 2017 FEVS opt out experiment. Of the original count of 112,576 individuals, 105,319 were deemed eligible to be included in the present analyses. We excluded from consideration individuals who had no chance to participate, which includes those for whom a valid email address could not be obtained, indication in EHRI-SDM of departing one’s position between the time of sample selection and survey administration, or being on an approved absence encompassing the full field period.
Figure 3: Flowchart of Key Dispositions and Counts for Individuals Randomly Selected for the 2017 FEVS Opt Out Experiment.
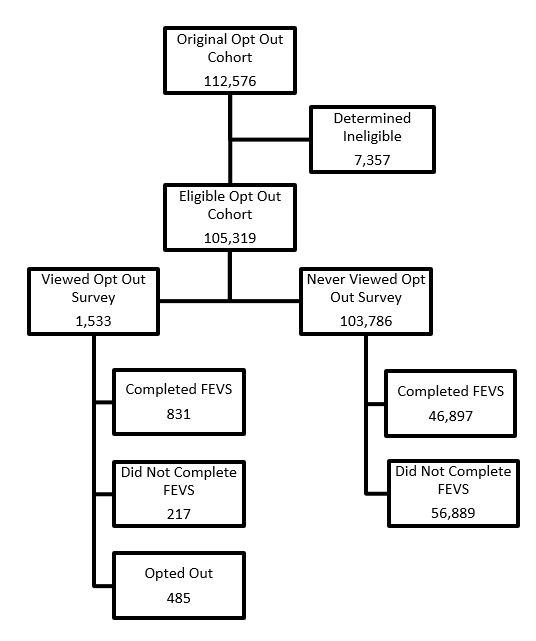
Considering the overall response rate to the 2017 FEVS was 45.5%, we were surprised to find that only 1,533 individuals (roughly 1.5% of those eligible) clicked on the link to launch the opt out survey. A similarly designed pilot study conducted during the 2016 FEVS resulted in a comparably low click rate, but was attributed at the time to placing the link too far towards the bottom of the email body and introducing the opt out link at the midpoint of the field period. Evidently, a more prominent placement and including from the onset of the field period fails to entice a greater proportion of individuals, at least for this survey and target population.
Of the 1,533 individuals clicking on the opt out survey link, 485, or 31.6%, opted out of the 2017 FEVS. On the other hand, 831 individuals, or 54.2%, decided to take the survey. This was notably larger than the response rate of those designated for the experiment but who never clicked on the link: 46,897/103,786 = 45.2%. The increase observed is a credit to the automated refusal conversion strategy targeting approximately 75% of these individuals, as discussed in Lewis et al. (2019). The remaining 217 individuals who viewed the opt out survey neither opted out nor completed the survey.
Table 1 summarizes the distribution of the primary reason the 485 opters out cited for declining to participate in 2017 FEVS. At 29.2%, the most frequently cited reason was the belief that results would not be used to enact any substantive workplace changes. This is understandable, considering the survey is administered on an annual basis and it takes several months following field period closeout for data processing, weighting for unit nonresponse, and report generation to occur. Results must then be interpreted, action plans created, and interventions approved by management prior to being implemented. Logistically, it can be difficult to make noticeable cultural changes in response to one year’s survey results prior to the commencement of the subsequent year’s FEVS administration. The second most frequently cited reason was concern about the confidentiality of one’s responses. This, too, is understandable, because the survey instrument includes sensitive items regarding one’s perception of an immediate supervisor’s performance, and reports are generated for work units with as few as 10 respondents. A public-use analysis file with individual-level responses is also released. For both formats, a rigorous sequence of confidentiality checks and protections are applied prior to release, yet the perceived risk of disclosure apparently remains high. Lastly, it is interesting to note how the distribution of reasons to not participate has changed relative to the nonrespondent follow-up study conducted after the 2004 administration. As reported in U.S. OPM (2006), the number one reason cited at that time was being too busy, at 46.9%. The belief that results would not be used to change anything was a distant second, at 9.5%. Confidentiality concerns were only cited 6.7% of the time.
Table 1: Distribution of Primary Reason for Opting Out of the 2017 Federal Employee Viewpoint Survey.
| Nonresponse Reason | Percentage |
| Survey results are not used to change anything in my workplace | 29.2 |
| I am concerned about the confidentiality of my responses | 24.0 |
| I am too busy to take the survey | 15.2 |
| I receive too many requests to take surveys | 10.3 |
| Dislike format / technical issues | 4.4 |
| Recent employment change | 3.7 |
| Survey results are never shared with employees | 3.1 |
| Participation in the survey is not supported by leadership in my agency | 1.6 |
| Indifference | 1.2 |
| Believed completed the survey | 0.9 |
| Other | 6.5 |
Figure 4 contrasts the distributions of 7 demographic variables derived from EHRI-SDM for those who opted out relative to respondents and nonrespondents who were designated for the opt out experiment. Ideally, the distributions of nonrespondents and opters would be found to resemble one another, as this would help to bolster the case for treating opters out—and their primary nonresponse reasons cited—as representative of the larger pool of nonrespondents. Results from Figure 4 are encouraging in that regard. The distributions are nearly identical for work location, supervisory status, gender, and minority status. The distributions appear to diverge slightly with respect to age and tenure with the U.S. Federal Government, with opters out tending to be older and longer tenured. For these two demographics, opters out tend to look more like respondents. But for the others, it appears the distributions of opters out more closely resemble nonrespondents than respondents.
Figure 4: Distribution of Opters Out versus Nonrespondents and Respondents in the 2017 Federal Employee Viewpoint Survey.
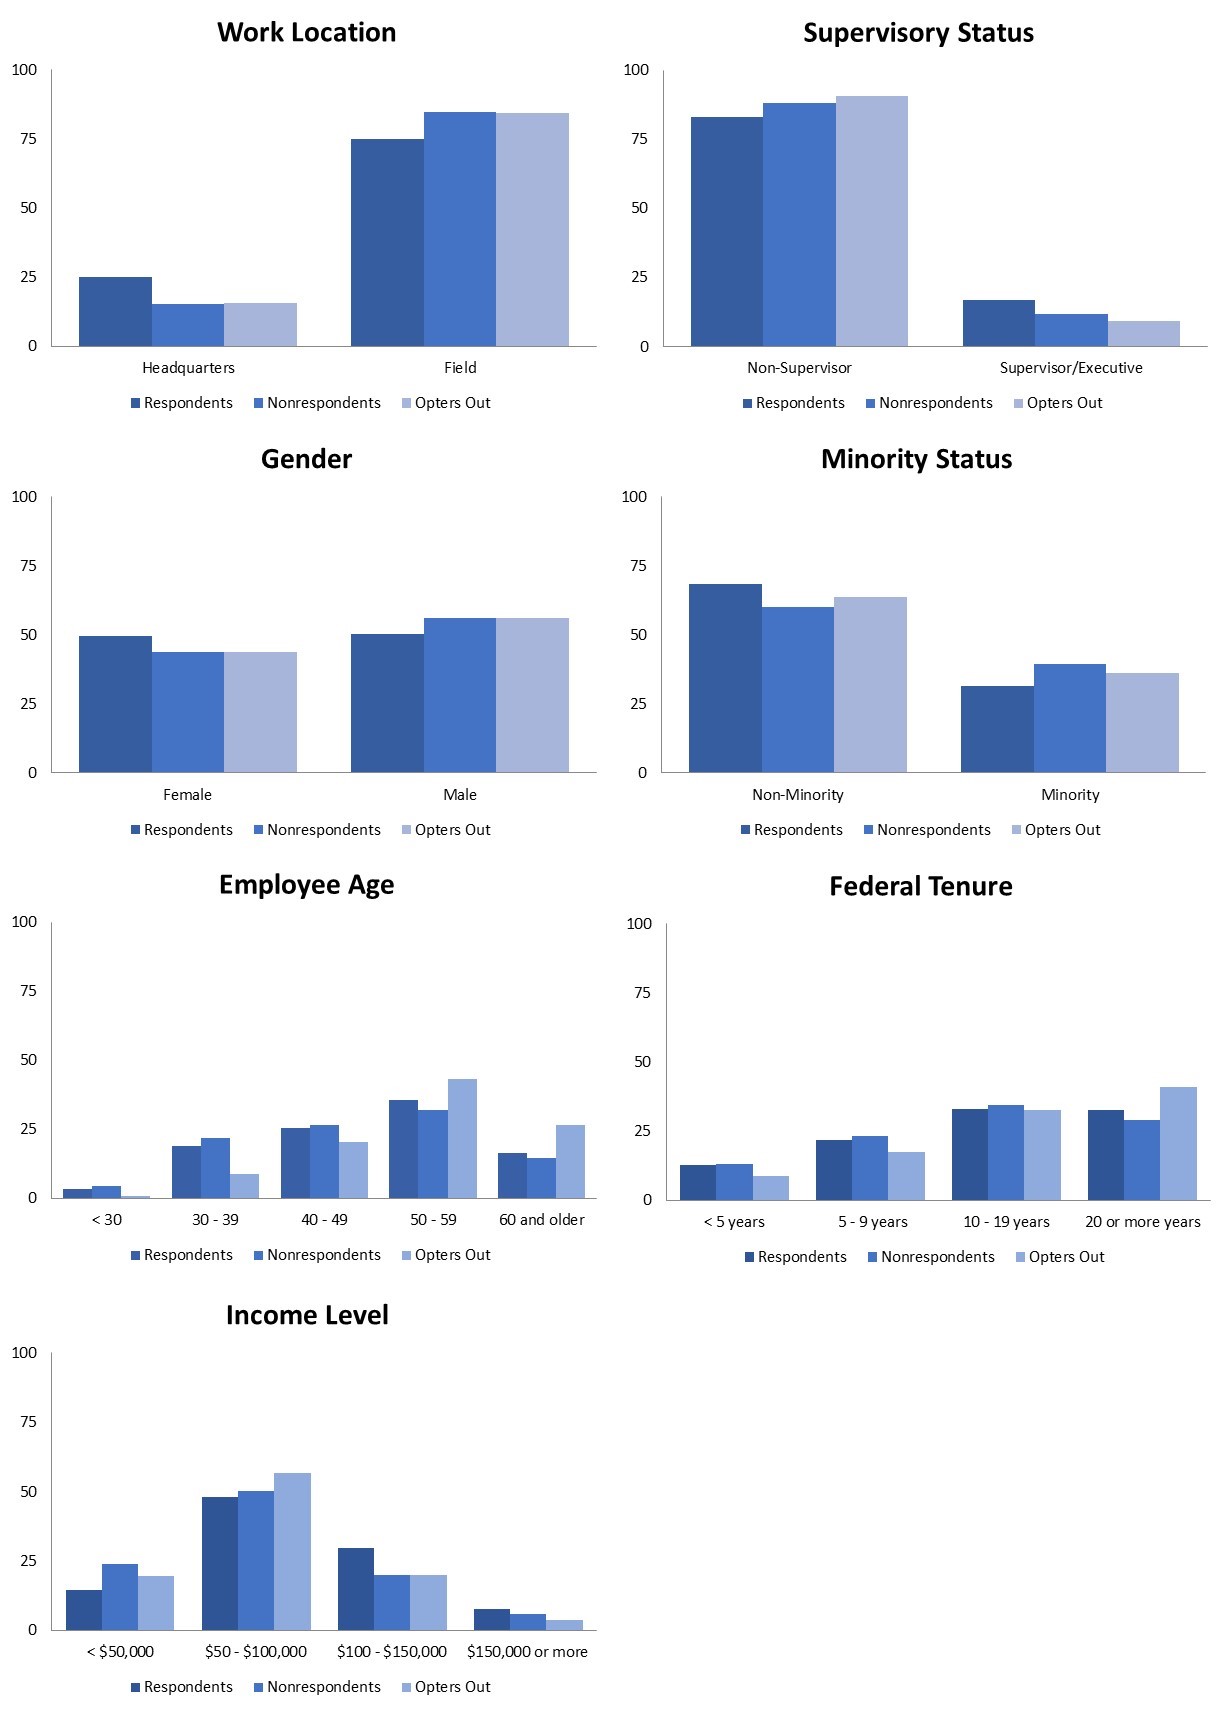
To more formally test these distributional hypotheses, we fit two multivariable logistic regression models, both using the same 7 EHRI-SDM covariates in Figure 4 as independent variables. In the first, we subsetted the data and assigned a dependent variable as an indicator variable of either being an opter out or a nonrespondent. In the second, we subsetted the data and assigned a dependent variable assigned as an indicator of either being an opter out or a respondent. With respect to the counts shown in Figure 3, the goal was to take a wholistic view of the auxiliary variables and investigate their simultaneous ability to predict whether an individual is likely to be one of the 485 opters out versus one of the 217 + 56,889 = 57,106 nonrespondents or one of the 831 + 46,897 = 47,728 respondents, respectively.
Results of the tests for main effects from these two models are provided in Table 2. The results confirm what was suggested in Figure 4, that opters out more closely resemble nonrespondents than respondents. With the exception of employee age, the Wald chi-square test statistic is always smaller for the nonrespondent model, implying more compatible demographic distributions. Additionally, at the conventional α = 0.05 level, 5 of the 7 auxiliary variables are insignificant in the nonrespondent model, whereas only 2 of the 7 are insignificant in the respondent model.
Table 2: Tests of Main Effects in Multivariable Logistic Regression Models of Opters Out versus Nonrespondents and Respondents in the 2017 Federal Employee Viewpoint Survey.
|
Opters Out vs. Nonrespondents |
Opters Out vs. Respondents |
|||||||
| Variable |
DF |
Wald Chi-Square |
p value |
Variable |
DF |
Wald Chi-Square |
p value |
|
| Work Location | 1 | 1.78 | 0.18 |
Work Location |
1 | 2.53 | 0.11 | |
| Supervisory Status |
2 |
4.28 | 0.12 |
Supervisory Status |
2 | 14.42 |
0.00 |
|
| Gender | 1 | 0.03 | 0.86 |
Gender |
1 | 13.37 |
0.00 |
|
| Minority Status | 2 | 3.95 | 0.14 |
Minority Status |
2 | 6.44 |
0.04 |
|
| Employee Age | 4 | 90.45 | < 0.01 |
Employee Age |
4 | 59.72 |
<.0001 |
|
| Federal Tenure | 3 | 1.50 | 0.68 |
Federal Tenure |
3 | 6.94 |
0.07 |
|
|
Income Level |
3 | 15.44 | < 0.01 |
Income Level |
3 | 37.92 |
<.0001 |
|
Discussion
This article presented results from an experiment fielded during a Web-based organizational climate survey, the 2017 Federal Employee Viewpoint Survey, in which a portion of sampled individuals were given the opportunity to opt out, or effectively “unsubscribe,” from a sequence of weekly follow-up email reminders about the survey sent to nonrespondents over the course of its six-week field period. Prior to being able to do so, however, the individual was asked to cite the primary reason for deciding not to participate. Using auxiliary information from the sampling frame, we demonstrated how the covariate distributions of those who opt out align well with the covariate distributions of the larger pool of 2017 FEVS nonrespondents. Hence, at least for the given survey population, the practice appears to be a promising way to learn more about nonrespondents and potentially improve response rates in future administrations. One example use would be to model the relative propensities of particular reasons cited, and subsequently tailor the messaging of invitations or other communications in the spirit of strategies discussed in Lynn (2016).
The biggest challenge to the approach is enticing enough individuals to click on the opt out link. The fact that roughly 45% of individuals clicked on the link to launch and complete the survey, yet a mere 1.5% of individuals clicked on the opt out link just a few lines below, was somewhat puzzling and discouraging. Indeed, Couper (2008, p. 325) acknowledges getting respondents to open, read, and act upon stimuli in email invitations remains a critical challenge to Web survey practitioners. Therein lies the biggest potential avenue for further research into improvements, however. Focus groups could be conducted with sampled individuals to learn more about processes for viewing and acting upon survey email requests. Utilizing and analyzing patterns in email read receipts could also be useful, as could exploring tools such as the Right Inbox add-on (https://www.rightinbox.com/features/email-tracking) where possible. A laboratory experiment with complementary cognitive interviewing and eye tracking (Neuert and Lenzner, 2016) or an investigation into mouse movements (Horwitz, Kreuter, and Conrad, 2017) could also be pursued to shed more light on the issue.
References
- Bethlehem, J., and Biffignandi, S. (2011). Handbook of Web Surveys. New York, NY: Wiley.
- Couper, M. (2008). Designing Effective Web Surveys. New York, NY: Cambridge.
- Criqui, M., Barrett-Connor, E., and Austin, M. (1978). Differences between Respondents and Non-Respondents in a Population-based Cardiovascular Disease Study. American Journal of Epidemiology, 108(5), 367-372.
- Dallosso, H., Matthew, R., McGrother, C., Clarke, M., Perry, S., Shaw, C., and Jagger, C. (2003). An Investigation into Nonresponse Bias in a Postal Survey on Urinary Symptoms. British Journal of Urology, 91(7), 631-636.
- Dillman, D., Smyth, J., and Christian, L. (2014). Internet, Phone, Mail, and Mixed-Mode Surveys: The Tailored Design Method. New York, NY: Wiley.
- Groves, R., and Couper, M. (1998). Nonresponse in Household Interview Surveys. New York, NY: Wiley.
- Groves, R., Benson, G., Mosher, W., Rosenbaum, J., Granda, P., Axinn, W., Lepkowski, J., and Chandra, A. (2005). Plan and Operation of Cycle 6 of the National Survey of Family Growth. Hyattsville, MD: National Center for Health Statistics.
- Heerwegh, D., and Loosveldt, G. (2006). An Experimental Study on the Effects of Personalization, Survey Length Statements, Progress Indicators, and Survey Sponsor Logos in Web Surveys. Journal of Official Statistics, 22(2), 191-210.
- Horwitz, R., Kreuter, F., and Conrad, F. (2017). Using Mouse Movements to Predict Web Survey Response Difficulty. Social Science Computer Review(3), 35, 388-405.
- Ingels, S., Pratt, D., Rogers, J., Siegel, P., and Stutts, E. (2004). Education Longitudinal Study of 2002: Base Year Data File User’s Manual (NCES 2004-405). Washington, DC: National Center for Education Statistics.
- Keusch, F. (2012). How to Increase Response Rates in List-Based Web Survey Samples. Social Science Computer Review, 30(3), 380-388.
- Kish, L. (1992). Weighting for Unequal Pi. Journal of Official Statistics, 8(2), 183-200.
- Lewis, T., Gorsak, M., and Yount, N. (2019). An Automated Refusal Conversion Strategy for Web Surveys. Field Methods, 31(4), 309-327.
- Little, R., and Rubin, D. (2019). Statistical Analysis with Missing Data. New York, NY: Wiley.
- Little, R., and Vartivarian, S. (2005). Does Weighting for Nonresponse Increase the Variance of Survey Means? Survey Methodology, 31(2), 161-168.
- Lynn, P. (2016). Targeted Appeals for Participation in Letters to Panel Survey Members. Public Opinion Quarterly, 80(3), 771-782.
- Manfreda, K., Bosnjak, M., Berzelak, J., Haas, I., and Vehovar, V. (2008). Web Surveys versus Other Survey Modes: A Meta-Analysis Comparing Response Rates. International Journal of Market Research, 50(1), 79-114.
- Mullen, P., Easling, I., Nixon, S., and Koester, D. (1987). The Cost-Effectiveness of Randomized Incentive and Follow-Up Contacts in a National Mail Survey of Family Physicians. Evaluation & The Health Professions(2), 10, 232-245.
- Neuert, C., and Lenzner, T. (2016). Incorporating Eye Tracking into Cognitive Interviewing to Pretest Survey Questions. International Journal of Social Research Methodology, 19(5), 501-519.
- Shih, T.-H., and Fan, X. (2008). Comparing Response Rates from Web and Mail Surveys: A Meta-Analysis. Field Methods, 20(3), 249-271.
- Stoop, I. (2004). Surveying Nonrespondents. Field Methods, 16(1), 23-54.
- Sudman, S. (1985). Mail Surveys of Reluctant Professionals. Evaluation Review, 9(3), 349-360.
- U.S. Office of Personnel Management. (2006). 2004 Federal Human Capital Survey Nonresponse Study. Unpublished technical report.
- U.S. Office of Personnel Management. (2017). 2016 Federal Employee Viewpoint Survey Technical Report. Retrieved at https://www.opm.gov/fevs/archive/2016FILES/2016_FEVS_Technical_Report.pdf.
- Voogt, R. (2004). Nonresponse Bias, Response Bias and Stimulus Effects in Election Research. PhD thesis: University of Amsterdam, The Netherlands.
-
Keywords
calibration CATI coverage coverage bias cross-national surveys data linkage data quality European Social Survey experiment face-to-face face-to-face survey Facebook hard to reach populations incentives item nonresponse measurement measurement error mixed-mode surveys multitasking non-probability samples Nonresponse nonresponse bias nonresponse rates paradata PIAAC Probability sample probability samples QR codes rare populations response rate Satisficing social desirability Social media survey survey-taking climate survey data survey management survey methods Telephone survey telephone surveys total survey error unit nonresponse validity web survey Web surveys weighting
