

Do supplemental list frames for subpopulations increase subpopulation sampling efficiency? Evidence from the National Household Food Acquisition and Purchase Survey
Zhang, S., Kirlin, J.A., Page E.T., Zhang, X. & West B.T. (2020). Do supplemental list frames for subpopulations increase subpopulation sampling efficiency? Evidence from the National Household Food Acquisition and Purchase Survey. Survey Methods: Insights from the Field. Retrieved from https://surveyinsights.org/?p=13478
© the authors 2020. This work is licensed under a Creative Commons Attribution 4.0 International License (CC BY 4.0) 
Abstract
Multiple-frame sampling has been regarded as a device for increasing efficiency in identifying small subpopulations. However, there has been a lack of empirical evidence in supporting the efficiency of the multiple-frame approach and in guiding best practices. The current study focuses on a special scenario in which two frames were used to recruit sample members. Using paradata from the U.S. National Household Food Acquisition and Purchase Survey (FoodAPS), the current analysis focuses on recruiting households that received Supplementary Nutrition Assistance Program (SNAP) as a sub-goal of the survey sampling. SNAP households account for around one-fifth of the general U.S. population, compared to a survey goal of 30 percent of responding households. Our findings were consistent with theoretical expectations. Having and using additional SNAP list frames improved the efficiency of identifying SNAP households as opposed to screening a general address-based sample frame. This efficiency remained even as the SNAP list frames aged.
Keywords
Dual-frame sampling, recruitment efficiency, sampling efficiency, small subpopulations
Acknowledgement
This research was supported by the U.S. Department of Agriculture, Economic Research Service. The findings and conclusions in this publication are those of the authors and should not be construed to represent any official USDA or U.S. Government determination or policy.
Copyright
© the authors 2020. This work is licensed under a Creative Commons Attribution 4.0 International License (CC BY 4.0)
Introduction
Surveys are often designed to produce estimates for different subpopulations. When the subpopulations are small, screening the entire population with a general frame may not be efficient for identifying eligible members of the subpopulation (Cowan, 1991; Kalton, 2009; Kalton & Anderson, 1986; Wagner & Lee, 2015). In response to this challenge, Hartley (1962, 1974) proposed that one could improve recruitment efficiency by adopting a multiple-frame approach and sampling subpopulation members from a separate list frame that is incomplete but contains a high percentage of eligible subpopulation members. The additional frame may boost the sample size of this subpopulation by making the recruitment less sporadic and thus more efficient (Kalton, 2003; Kalton, 2009; Kalton & Anderson, 1986; Lohr, 2009; Wagner & Lee, 2015). In the current study, we focus on a dual-frame setting and investigate whether having and using a list frame indeed provides extra benefits compared to screening a sample selected from a general frame.
The idea of using multiple frames to oversample small subpopulations has received substantial theoretical attention since its introduction and is currently implemented in several surveys (e.g., Bricker et al., 2017; Kalton, 2009; Lohr, 2009; Mecatti & Singh, 2014; Metcalf & Scott, 2009; Wagner & Lee, 2015; Srinath et al., 2004; Weerasekera et al., 2019). A great deal of research has been devoted to the development of point and variance estimators under the multiple-frame design (Chen, Stubblefield, & Stoner, 2020; Lohr & Rao, 2000; Lohr & Rao, 2006; Mecatti, 2007; Mecatti & Singh, 2014; Ranalli, Arcos, Rueda, & Teodoro, 2016; Rao & Wu, 2010; Sánchez-Borrego, Arcos, Rueda, 2019). Despite these important advances, very few studies have provided empirical support for the original motivation of adopting the multiple-frame approach. There is a dearth of evidence on whether the additional list frame can indeed increase operational and cost efficiency in identifying subpopulation members in comparison to screening the general population.
While it is certainly reasonable to assume that using a supplementary list frame would increase efficiency in identifying subpopulation members, this may not be unconditionally true. For instance, depending on the source of the list frame, the information could be inaccurate (West, Wagner, Hubbard, & Gu, 2015), which would largely undermine the usefulness of the additional frame. Likewise, depending on the specific subpopulation of interest, the group status could be time sensitive, which would make the list frame age quickly and lose its usefulness. Further, there may be a cost associated with obtaining the list frame, and this cost needs to be weighed against the efficiency benefits introduced in the sampling process. Thus, more empirical evidence is needed to support the assumptions and practices of adopting a multiple-frame sample design with the intention of increasing efficiency in recruiting subpopulation members.
The Current Study
The current study investigates the utility of supplementary list frames in the U.S. National Household Food Acquisition and Purchase Survey (FoodAPS). Using paradata, we examine whether obtaining and using a list frame of recipients of the Supplementary Nutrition Assistance Program (SNAP) enabled more efficient identification of SNAP households in the FoodAPS recruitment process.
Based on the 2010 census enumeration (Lofquist, Lugaila, O’Connell, & Feliz, 2012), households with members receiving SNAP accounted for about 19% of all U.S. households (Gray & Eslami, 2014). With this proportion, while SNAP households are certainly a subpopulation, they are not necessarily rare and thus a general screening may suffice (Kalton, 2009; Kish, 1987). Since the added benefit of having an additional list frame depends on how rare the subpopulation is in the general population (Srinath, Battaglia, & Khare, 2004), we investigate whether the additional list frames brought additional benefit in sampling SNAP households, especially considering that these frames had aged and were not perfectly accurate.
Lists of SNAP recipient addresses were obtained from state SNAP agencies as supplemental list frames to boost the subsample size of SNAP households. As we explain in the Methodology section, only some states provided the list to be used as an additional frame; additionally, even in the states that did offer a list of SNAP recipients, the list was not consistently used throughout the entire data collection. This variation in having and using the SNAP list frames allows us to answer our first research question:
Did using SNAP list frames increase the efficiency in identifying SNAP households, in comparison to relying on general screening?
We defined efficiency in two ways. First, leveraging the fact that the data collection in different months and areas identified different numbers of SNAP households, field operations that identified a larger number of SNAP households are regarded as more efficient in recruiting SNAP households. Second, given that the number of contact attempts is a proxy of recruitment effort, we regard field operations that directed a larger percentage of total contact attempts to SNAP households as more efficient and goal-oriented in recruiting SNAP households from an effort-per-completed SNAP interview standpoint.
The aging of the list frame was another concern. Even if the list frames were accurate when they were freshly obtained from the state SNAP agencies in January 2012, they may have aged quickly. Being a SNAP participant is a fluid status. Over the four years from 2009-2012, 30% of SNAP participants were in the program for fewer than 12 months (Irving & Loveless, 2015). A substantial number of individuals on the initial list of SNAP participants may no longer be eligible in the latter period of the field operation. Even if participation lasted longer, household mobility might reduce the effectiveness of a list of addresses as time passes. These considerations motivate our second research question:
Did the usefulness of the SNAP list frames decrease over time as the frame aged?
Methodology
FoodAPS overview
In 2012 and 2013, FoodAPS collected information on foods acquired and their quantities and prices for a nationally representative sample of U.S. households. Households with a member receiving SNAP benefits were classified as one of the target groups that the survey intended to oversample.
FoodAPS had a three-stage sampling design. In the first stage, 50 primary stage units (PSUs) (U.S. counties or groups of contiguous counties) were selected. The 50 selected PSUs were located in 27 States; Alaska and Hawaii were excluded from the sample universe. In the second stage, within each of the 50 sampled PSUs, eight secondary sampling units (SSUs) were selected. The SSUs were defined as census block groups or groups of contiguous census block groups. The fact that the SSUs consisted of census block groups allowed us to draw information from the 2012 Census Planning Database (CPD) to characterize these SSUs and construct the covariates. In the third stage, addresses were sampled from the SSUs for screening interviews. The address selection utilized two frames—a commercial list of addresses obtained from the United States Postal Service (CDSF) and a list of SNAP household addresses obtained from state SNAP agencies. The two frames were first merged to identify duplicate addresses, which were then excluded from the postal service file to create two mutually exclusive frames.
The selected PSUs were located in a total of 27 states, but only 22 of the state SNAP agencies provided a list of SNAP addresses in time to be included in the sampling process. Even though the address lists were provided to the FoodAPS contractor at no financial cost, extracting and providing the lists placed an unknown cost on the already burdened state agencies. The difference in SNAP frame availability motivated our analyses: was the process of identifying SNAP households more efficient when a SNAP frame was available?
For determining household eligibility for participation, a 5-minute screening interview was conducted with sampled households at 13,445 addresses. Field interviewers did not know from which frame a particular address had been sampled, in part because there was no guarantee that the original occupants had not moved or changed program status by the time the screening interview was completed. For each address, field interviewers made up to eight in-person contact attempts at different times of the day and on different days of the week to try screening the household. Out of the 13,445 addresses, the eligibility/ineligibility status was determined for 11,812, and these 11,812 households with confirmed status were the basis of our analyses. Of the 11,812 households, 2,375 of them (20.1%) were SNAP households. For detailed information about the recruitment process of FoodAPS, please refer to FoodAPS documentation at www.ers.usda.gov/foodaps.
Dataset construction
The focus of the current study is the recruitment process for SNAP households during the third stage of sampling. To evaluate the ease of identifying SNAP households, we tracked the screening activities for each month of survey operations within each SSU. Each row of our analytical dataset represents one month of screening activity within one SSU and is referred to as an SSU-month unit. There are 2,319 SSU-month units in total available for our analyses. Our two outcome variables were defined at this level using the screening activities associated with SNAP households within each SSU-month unit (see below).
Different SSUs have different concentrations of SNAP participants. Areas in the 22 states that provided the additional SNAP frame could naturally differ from areas in the other 5 states that did not provide the SNAP frame. Thus, the ability to find SNAP households efficiently during the screening process could be confounded by areal characteristics. To control for these potential confounding effects, we extracted information from the 2012 Census Planning Database (CPD) to characterize the SSUs and used these SSU characteristics as covariates in our models (see below). We selected two types of variables that are likely to be associated with the outcome of recruiting SNAP households: 1) variables that reflect areal socioeconomic status and thus are related to concentration of SNAP households, and 2) variables that reflect the difficulty of approaching and recruiting respondents in that area.
Outcome variables
Number of SNAP households
Our first outcome variable is the number of self-reported SNAP households screened in each SSU-month unit. However, directly comparing the number of screened SNAP households across SSU-month units would not be appropriate because the overall number of households screened varied across different SSU-month units. If some SSU-month units screened more households in general (i.e., more exposure), then we would reasonably expect them to have screened more SNAP households specifically (i.e., more event counts). Therefore, when using the number of SNAP households as the outcome variable, we coupled it with the total number of households screened in each SSU-month unit to offset the fact that more households being screened could mean more SNAP households being screened. By including the offsets and thus incorporating the exposure underlying the event counts, we are modeling the rate of screening SNAP households, with the number of screened SNAP households being the numerator and the number of total screened households being the denominator.
Number of contact attempts associated with SNAP households
The second outcome variable is the number of contact attempts associated with SNAP households in each SSU-month unit. For simplicity, we refer to this variable as the “number of SNAP contact attempts”. Parallel to the discussion above about the number of SNAP households, when using the number of SNAP contact attempts as the outcome variable we include the number of contact attempts for all households in that SSU-month unit as an offset variable. This compensates for the fact that more contact attempts associated with SNAP households may have resulted from more contact attempts associated with all households in those SSUs.
Covariates
Percentage of screened households coming from a SNAP frame (i.e., SNAP frame usage)
For evaluating the usefulness of the SNAP frames, we constructed a variable—the percentage of screened households coming from a SNAP frame in each SSU-month unit—to indicate not only whether the SNAP frame was available, but also whether the SNAP frame was in active use in each SSU-month unit. We note that households coming from a SNAP frame do not equate to SNAP households because the SNAP frames were not perfectly accurate or timely.
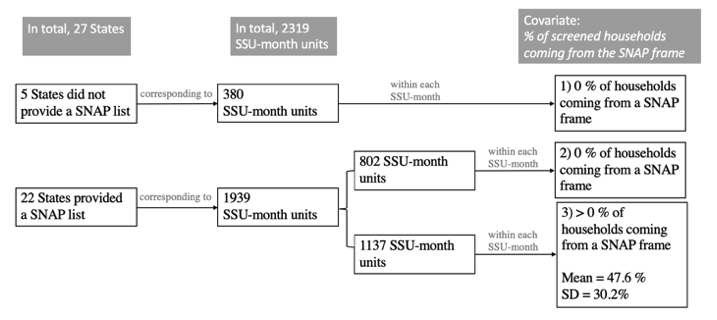
The values of this covariate range from 0 to 100 percent. Three scenarios underlie these values:
1) For data collection in the five states that did not provide a SNAP frame, their corresponding SSU-month units all have a value of 0 for this covariate because none of their screened households could come from a SNAP frame.
2) Although the other 22 states provided a list of SNAP addresses to be used as a supplementary frame, not all SSUs in these 22 states were actively using the SNAP frame in every month. For the 1,939 SSU-month units corresponding to these 22 states, 802 of the SSU-month units had 0% of screened households coming from the SNAP frame.
3) The remaining 1,137 SSU-month units had more than one screened household coming from the SNAP frame.
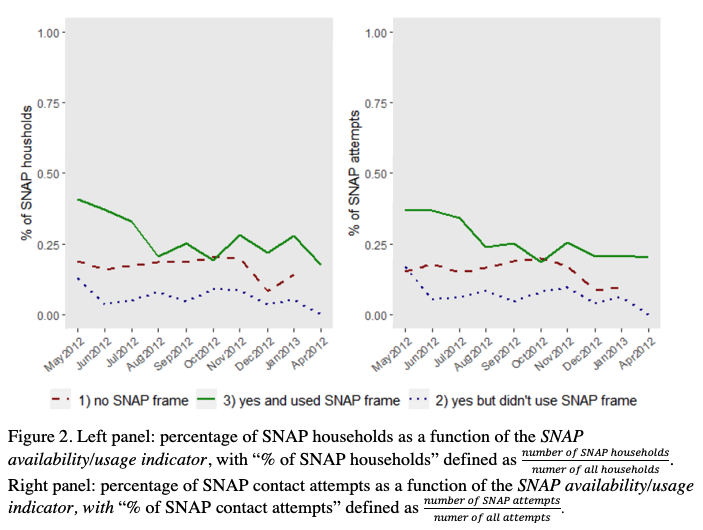
The three scenarios and value assignments of the covariate percentage of screened households coming from a SNAP frame are summarized in Figure 1. This variable was rescaled so that one unit corresponds to 10 percentage points. For visualization purposes only (Figure 2 below), we constructed a separate categorical indicator to indicate these three scenarios. We refer to this categorical indicator as SNAP frame availability/usage indicator.
Figure 1. A graphical explanation of the three scenarios and value assignments for the covariate percentage of screened households coming from a SNAP frame
Time
The FoodAPS was fielded for ten months from mid-April 2012 to mid-January 2013. We examined whether time had a moderating effect on the usefulness of the SNAP frame. Time was included as a categorical variable. We collapsed the 10 data collection months into three groups: the first group from April to June (reference category); the second group from July to September; and the third group from October to January.
SSU characteristics
The SSUs in FoodAPS’s second-stage sampling consisted of one or more contiguous census block groups. The 2012 CPD contains characterizing information for each of the census block groups and provides denominators that can be used to turn counts into ratios. To characterize the FoodAPS SSUs, we either aggregated the counts across census block groups to attain SSU-level counts which were then turned into ratios, or we took a weighted average of block groups’ characteristics within each SSU. For a detailed description of how the covariates were constructed, please refer to Appendix A. All the SSU characteristics were centered on their means when included in the regression models as predictors. All the SSU characteristics that are percentages were rescaled so that one unit corresponds to 10 percentage points. Table 1 below summarizes the SSU characteristics:
| Table 1. The SSU characteristics used as covariates | |
| 1. Percentage of people with a college degree or higher | the percentage of people with at least a college degree in each SSU, where a higher value would suggest higher socio-economic status for that SSU |
| 2. Percentage of people who are below poverty level | the percentage of people who were classified as living below the federal poverty level in each SSU given their total family income within the last year, family size, and family composition |
| 3. Percentage of people who moved | the percentage of people who moved from another residence in the US or Puerto Rico within the last year in each SSU |
| 4. Percentage of non-English speaking households | the percentage of households in which no one aged 14 years and older spoke English very well in each SSU |
| 5. Percentage of households that receive public assistance | the percentage of households that received public assistance income (i.e., Temporary Assistance to Needy Families or a state’s general assistance program) in each SSU |
| 6. Percentage of renter households | the percentage of households that were not owner-occupied in each SSU |
| 7. Median income | the annual median household income of each SSU |
| 8. Mail return rate | the number of 2010 census mail returns received out of the total number of valid occupied housing units (intended to capture the general survey cooperativeness of each SSU) |
Statistical Analysis
We fitted zero-inflated negative binomial regression models using the number of SNAP households and the number of SNAP contact attempts as the outcome variables, respectively. Both outcome variables are count variables with a substantial portion of zero values (49%).
The zero-inflated negative binomial regression model is a mixture model consisting of two parts. The zero-inflation part predicts 0 count values (rather than a non-zero count value, as in the usual case) with a logistic regression; the negative binomial part models the non-zero counts with a negative binomial regression. Although covariates included in the two parts of the model do not need to be the same, we specified the same covariates for the two parts of the model (except for a small difference in the specification of the offset, as discussed below) because our interest in the SNAP frame’s usefulness applies to both parts of the model. For a short description of zero-inflated negative binomial regression models, please refer to Appendix B.
As stated above when we introduced the two outcome variables, for the negative binomial part of each model, we included the total number of households screened in each SSU-month unit as an offset for the outcome variable number of SNAP households, and the total number of contact attempts for all households as an offset for the outcome variable number of SNAP contact attempts. With the offset term in our model, we were essentially parameterizing the percentages (i.e.,  and
and  ) (see Appendix B). The consideration that a larger exposure results in more event occurrence also applies to the zero-inflation part of the model. The larger the exposure, the less likely we are to observe a zero. Because it is not sensible to statistically specify an offset term for a logistic model, we included a log-transformed version of the total number of households screened as a covariate in the zero-inflation part of the model for modeling the number of SNAP households. Similarly, we included a log-transformed version of the total number of contact attempts as a covariate in the zero-inflation part of the model for modeling the number of SNAP contact attempts.
Results
Descriptive results
The analytical dataset of the current study is at the SSU-month level. The two outcome variables (number of SNAP households and number of SNAP contact attempts) as well as our main covariate (SNAP frame usage) are defined at this SSU-month level and capture the sampling outcomes and activities within each SSU-month. The series of covariates that we constructed from the CPD to characterize the SSUs are at the SSU level. A given SSU was therefore assigned only one set of values for these characteristics, and these values were repeatedly assigned to the SSU’s corresponding SSU-month units in our dataset. We bring this distinction between the SSU level and the SSU-month level to the reader’s attention because, in this descriptive section, we report the descriptive statistics of the variables at the level where they are defined. The means, ranges, and standard deviations of the variables are presented in Table 2. We also compared the mean estimates based on the units with and without the SNAP frame.
Table 2. Descriptive statistics for the study variables based on the full sample, the units with a SNAP frame and the units without a SNAP frame.
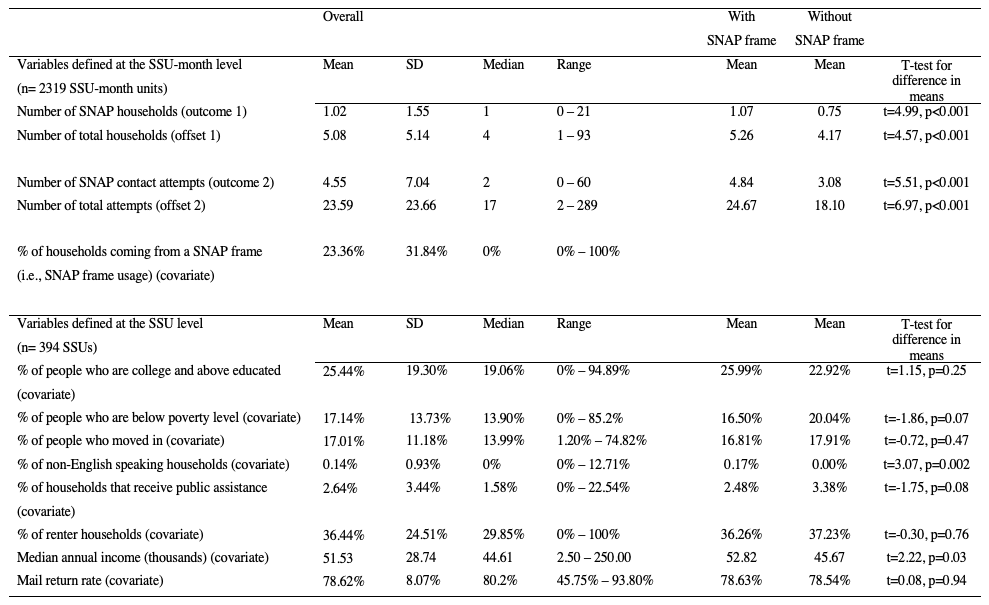
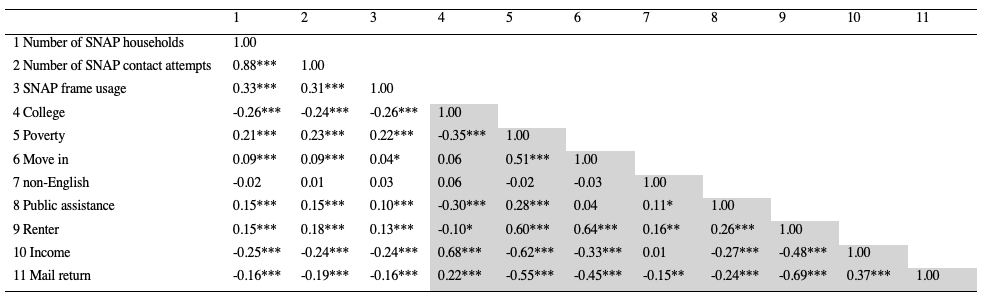
The correlations between the variables are presented in Table 3. The correlations between SSU characteristics were calculated at the SSU level (marked gray in Table 3). The remaining correlations were calculated at the SSU-month level. Based on the bivariate relationships, there was indeed a positive association between having and using SNAP frames and identifying SNAP households, as suggested by the positive correlation between the number of SNAP households and the SNAP frame usage (r= 0.33). Similarly, having and using SNAP frames was positively associated with a larger amount of contact effort being directed to the SNAP households (r=0.31). All SSU characteristic covariates, except for percent of non-English households, were significantly associated with the two outcome variables, suggesting that it was easier to identify SNAP households in some SSUs than in others.
Table 3. Pairwise Correlations of the study variables.
Modeling results
Predicting the number of SNAP households
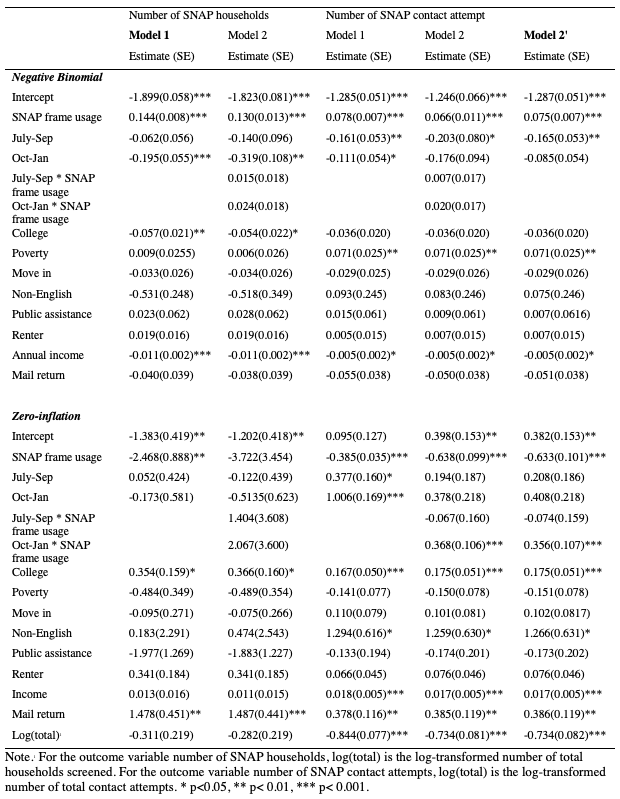
The estimated parameters in the zero-inflated negative binomial model for the outcome variable number of SNAP households are presented in Table 4. As all interaction terms were not significant (Model 2), we interpret Model 1 as our final model for this dependent variable.
After adjusting for the various SSU characteristics, the coefficient for having and using SNAP frames was significant, for both the zero-inflation part and the negative binomial part of the model. In terms of the negative binomial part, the higher the percentage of households coming from a SNAP frame in each SSU-month, the more SNAP households were screened (Estimate= 0.144, 95% CI= [0.120, 0.159]). Mirroring this association, the higher percentage of households coming from a SNAP frame in each SSU-month unit, the less likely it was that no SNAP households were screened (Estimate= -2.468, 95% CI= [-4.207, -0.729]). Time also had a negative effect on the identification of SNAP households. In the negative binomial part of the model, the last period from October to January screened significantly fewer SNAP households compared to the period from April to June (Estimate= -0.195, 95% CI= [-0.304, -0.087]).
Table 4. Estimated parameters in the zero-inflated negative binomial models.
Predicting the number of SNAP contact attempts
The estimated parameters in the zero-inflated negative binomial model for the outcome variable number of SNAP contact attempts are also presented in Table 4. The interaction between time and SNAP frame usage was not significant for the negative binomial part, but was significant for the zero-inflation part of the model. We fitted a Model 2′ (2 Prime) that retains the interactions only for the zero-inflation part of the model as the final model for this outcome variable.
The pattern regarding our first research question about the effect of having and using SNAP frames stayed the same. As shown in the negative binomial part of the model, having a larger percentage of households coming from a SNAP frame was associated with a significantly larger portion of contact attempts directed toward SNAP households (Estimate= 0.075, 95% CI= [0.061, 0.089]). Time had a significant negative effect. Compared to the period from April to June, fewer contact attempts were directed toward SNAP households in the period from July to September (Estimate= -0.165, 95% CI= [-0.270, -0.060]), though the difference was not significant for the period from October to January.
Considering the zero-inflation part of the model, the interaction between time and percentage of households coming from a SNAP frame was significant. For the reference period from April to June, having and using SNAP frames significantly decreased the likelihood of having no contact attempts directed toward SNAP households (Estimate= -0.633, 95% CI= [-0.830, -0.435]). This effect of the SNAP frame usage was significantly weakened for the period from October to January (the interaction estimate= 0.356, 95% CI= [0.147, 0.565]), although the overall effect of the SNAP frame usage remained significant for the period from October to January (Estimate= -0.276, 95% CI= [-0.346, -0.206]; values not included in the table).
These findings consistently suggest that having and using the SNAP frames resulted in significant benefits in terms of increasing the efficiency of SNAP household identification. To visualize the results, we plot the percentage of SNAP households screened over all households screened in each month for the three scenarios summarized in the SNAP availability/usage indicator (Figure 2, left panel). The red dashed line represents activities in the SSU-months corresponding to the five states that did not have a SNAP frame (note that survey activities ended in the five states without a SNAP frame in December), the blue dotted line represents the activities in the SSU-months that did have the SNAP frame but did not seek to recruit SNAP households (SNAP frame usage = 0), and the green solid line represents the activities in the SSU-months that used the SNAP frame (the SNAP frame usage > 0). The green solid line generally hovered above the red dashed and blue dotted lines, indicating the benefit of using the SNAP frame in terms of increasing the efficiency of SNAP household identification. In parallel, we plot the percentage of SNAP contact attempts over all contact attempts in each month for the three scenarios summarized in the SNAP availability/usage indicator (Figure 2, right panel). We see a very similar pattern in this figure.
Discussion
Our first research question concerned whether the use of additional SNAP list frames improved the efficiency of identifying SNAP households as opposed to solely relying on general screening. We have shown that using the SNAP frames was associated with screening more SNAP households and a lower likelihood of screening zero SNAP households. Specifically, if we fix the values of all other covariates to zero (recall that we centered the covariates around their means), then a 10 percentage-point increase in SNAP frame usage was related to a 1.41 times increase (i.e., a 41% increase) in the expected number of SNAP households screened. These findings suggest that the additional list frames aided in the identification of SNAP households from the general population.
Considering the number of contact attempts, using the SNAP frames was associated with more contact attempts directed toward SNAP households and a lower likelihood of zero contact attempts directed toward SNAP households. Specifically, if we fix the value of all other covariates to zero, then a 10 percentage-point increase in SNAP frame usage was related to a 1.49 times increase (i.e., a 49% increase) in the expected number of contact attempts directed toward SNAP households. These findings suggest that when the additional list frames were used, a significantly larger amount of contact attempts were directed to the subpopulation of interest, which indicates more efficient effort directed at recruiting SNAP households.
Our second research question concerned whether the usefulness of the SNAP frames decreased over time because the list frames aged. Based on the interaction terms between the SNAP frame usage and the time variables, we found some evidence supporting this possibility, but the effect was not strong. Within FoodAPS’s 10-month fielding period, the utility of the supplementary list frames persisted.
This study is one of the few that have empirically investigated the efficiency of multiple-frame surveys. Our findings confirm that general screening activities can identify SNAP households, as shown by the SNAP households screened in the five states whose state SNAP agency did not provide the supplemental SNAP frames. Nonetheless, by making comparisons between operations that worked with and without the additional list frames, our findings demonstrate that using additional list frames could improve screening efficiency and reduce survey screening costs in comparison to the general screening.
One caveat is that our results represent a case study. Our findings may not generalize if other studies focus on subpopulations of different sizes or if the list frames have different error structures. However, our results have shown the benefit of using additional frames even though SNAP households were not rare in the population (19%). Others who recruit rarer subpopulations may expect larger gains with additional list frames (Srinath et al., 2004).
Additionally, our results are based on observational data. The availability of SNAP frames was not part of a randomized experimental design. Even though our analyses controlled for a series of SSU characteristics that were likely to be related to SNAP household concentrations, we might not have accounted for all factors that differed between SSUs from states that did and did not provide the SNAP frame (and thus could have confounded the relationships of the presence of a SNAP frame with the recruitment outcomes).
Another limitation of the current analyses is that our analytical dataset was based on the households that were screened and reported their SNAP status in the screening interviews. This is not ideal because only 66% of the contact attempts were associated with the screened households. The remaining futile attempts could not be analytically included in the construction of one of the outcome variables (the number of SNAP contact attempts) because we have no information on the cases that they targeted. In addition, we rely on the screened households to construct our major covariate, the percentage of screened households coming from a SNAP frame, because we do not know in which SSUs those non-screened units resided. Our findings could be affected if the households that did not respond were systematically different from the households that did respond. We unfortunately cannot avoid or evaluate this problem because an address-based sampling frame was used in the FoodAPS and no information is available on the non-contacted cases. Future studies may address this problem if they draw samples from a frame that contains information on all of the frame units.
Appendix A.
Construction of SSU characteristics as covariates
Table A. How we constructed the SSU-level characteristics using the block group level information provided by 2012 Census Planning Database.
| Covariate | Construction |
| Percentage of people with a college degree or higher | Within each SSU, we took the sum across census block groups to obtain the number of college-educated people within each SSU; we then divided these college-educated SSU sums by the total number of people who were 25-years-and-above within the SSUs, which resulted in the percentages of people with a college degree or higher in each SSU.
|
| Percentage of people who are below poverty level | We summed the number of people living below the federal poverty level across census block groups within each SSU, and then divided these values by the total number of people whose poverty status was determined in each SSU.
|
| Percentage of people who moved | We summed the number of movers across census block groups within each SSU, and then divided these values by the total number of people who were older than one year of age in each SSU.
|
| Percentage of non-English speaking households | We summed the number of non-English speaking households across census block groups within each SSU, and then divided these values by the total number of occupied households in each SSU.
|
| Percentage of households that receive public assistance | We summed the households that received public assistance across census block groups within each SSU, and then divided these values by the total number of occupied households in each SSU.
|
| Percentages of renter households | We summed the number of non-owner-occupied households across census block groups in each SSU, and then divided these values by the total number of occupied households in each SSU.
|
| Median income | We took a weighted average across the median incomes of census block groups within each SSU. The weights were calculated as , with census block group size equaling the number of occupied households in each census block group, and SSU size equaling the total number of occupied households in the SSU that the census block group nests in.
|
| Mail return rate | The CPD reports a mail return rate for each census block group. We took a weighted average of the rates across census block groups within each SSU, with weights constructed in the same way as for median income. |
Appendix B.
A short description of zero-inflated negative binomial models
If we conceptualize the observed count variable  as a product of the two latent variables
  and
and 
![\[ y_i = z_i y_i^* \]](https://surveyinsights.org/wp-content/uploads/ql-cache/quicklatex.com-1efc5f8b955691c032b6209aafa190df_l3.png "Rendered by QuickLaTeX.com")
where is a binary variable with values 0 for observations who have consistent zero count and 1 for all other observations and where has a negative binomial distribution, then the probability of each observed count can be modeled as
![\[ P(y_i = k) = \begin{cases} P(z_i = 0)+P(z_i = 1, y_i^* = 0), &\text{if k = 0}\\ P(z_i = 1)f(k), &\text{if k = 1, 2, ...}\\ \end{cases} \]](https://surveyinsights.org/wp-content/uploads/ql-cache/quicklatex.com-09916ddf556ac6c2870f201bc4cd2e29_l3.png "Rendered by QuickLaTeX.com")
where  is modeled with a logit link function including covariates, and
  is the negative binomial distribution with its mean being a linear parametric function of some (other) covariates.
For the negative binomial part of the model, we included an offset term to account for the fact that larger exposure (e.g., more households screened) results in more event occurrence (e.g., more SNAP households screened). With this offset term, our model’s parameterization
![\[ log E(y_i^*) = \beta \boldsymbol{X_i} + log(\text{Offset}_i) \]](https://surveyinsights.org/wp-content/uploads/ql-cache/quicklatex.com-ba280636c76935c8d7cd3033a5f00042_l3.png "Rendered by QuickLaTeX.com")
can be rewritten as
![\[ log E(y_i^*)- log(\text{Offset}_i) = \beta \boldsymbol{X_i} \]](https://surveyinsights.org/wp-content/uploads/ql-cache/quicklatex.com-1c3b2a6b39c6073d67d7cb8c47fca682_l3.png "Rendered by QuickLaTeX.com")
![\[ log E(\frac{y_i^*}{\text{Offset}_i})= \beta \boldsymbol{X_i} \]](https://surveyinsights.org/wp-content/uploads/ql-cache/quicklatex.com-aab8e9fed327a4289fb17cf24cd7cbcf_l3.png "Rendered by QuickLaTeX.com")
where  refers to model predictors. Thus, we are essentially parameterizing percentages (e.g., .)
References
- Bricker, J., Dettling, L. J., Henriques, A., Hsu, J. W., Jacobs, L., Moore, K. B., … & Windle, R. A. (2017). Changes in US family finances from 2013 to 2016: Evidence from the Survey of Consumer Finances. Federal Reserve Bulletin, 103(3), 1-42.
- Chen, S., Stubblefield, A., & Stoner, J. A. (2020). Oversampling of Minority Populations Through Dual-Frame Surveys. Journal of Survey Statistics and Methodology. Advance online publication. https://doi.org/10.1093/jssam/smz054
- Cowan, C. D. (1991). Using Multiple Sample Frames to Improve Survey Coverage, Quality, and Costs. Marketing Research, 3(4), 66-69.
- Gray, K. F., & Eslami, E. (2014). Characteristics of Supplemental Nutrition Assistance Program Households: Fiscal Year 2012. US Department of Agriculture. Retrieved from: https://files.eric.ed.gov/fulltext/ED582002.pdf
- Hartley, H. O. (1962). Multiple frame surveys. In Proceedings of the social statistics section, American Statistical Association (Vol. 19, No. 6, pp. 203-206).
- Hartley, H. O. (1974). Multiple frame methodology and selected applications. Sankhya, 36(997), 118.
- Irving, S. K., & Loveless, T. A. (2015). Dynamics of economic well being: Participation in government programs, 2009-2012: Who gets assistance. US Department of Commerce, Economics, and Statistics Administration, US Census Bureau. Retrieved from: https://www.census.gov/content/dam/Census/library/publications/2015/demo/p70-141.pdf
- Kalton, G. (2003). Practical methods for sampling rare and mobile populations. Statistics in Transition, 6, 491-501.
- Kalton, G. (2009). Methods for oversampling rare subpopulations in social surveys. Survey Methodology, 35(2), 125-141.
- Kalton, G., & Anderson, D. W. (1986). Sampling rare populations. Journal of the Royal Statistical Society: Series A (General), 149(1), 65-82.
- Lofquist, D. (2012). Households and families: 2010. US Department of Commerce, Economics and Statistics Administration, US Census Bureau. Retrieved from: https://www.census.gov/prod/cen2010/briefs/c2010br-14.pdf
- Lohr, S. L., & Rao, J. N. K. (2000). Inference from dual frame surveys. Journal of the American Statistical Association, 95(449), 271-280.
- Lohr, S., & Rao, J. K. (2006). Estimation in multiple-frame surveys. Journal of the American Statistical Association, 101(475), 1019-1030.
- Lohr, Sharon. 2009. Multiple Frame Surveys. In D. Pfefferman and C.R. Rao (Ed.), Handbook of Statistics, Vol. 29A, Sample Surveys: Design, Methods, and Applications (pp. 3–8). Amsterdam: Elsevier/North-Holland.
- Mecatti, F. (2007). A single frame multiplicity estimator for multiple frame surveys. Survey Methodology, 33(2), 151-157.
- Mecatti, F., & Singh, A. C. (2014). Estimation in multiple frame surveys: A simplified and unified review using the multiplicity approach. Journal de la Société Française de Statistique, 155(4), 51-69.
- Metcalf, P., & Scott, A. (2009). Using multiple frames in health surveys. Statistics in Medicine, 28(10), 1512-1523.
- National Household Food Acquisition and Purchase Survey. (2016). National Household Food Acquisition and Purchase Survey (FoodAPS): User’s Guide to Survey Design, Data Collection, and Overview of Datasets. U.S. Department of Agriculture. Retrieved from: https://www.ers.usda.gov/media/8804/0_foodaps-user-guide-puf.pdf
- Ranalli, M. G., Arcos, A., del Mar Rueda, M., & Teodoro, A. (2016). Calibration estimation in dual-frame surveys. Statistical Methods & Applications, 25(3), 321-349.
- Rao, J. N. K., & Wu, C. (2010). Pseudo–empirical likelihood inference for multiple frame surveys. Journal of the American Statistical Association, 105(492), 1494-1503.
- Sánchez-Borrego, I., Arcos, A., & Rueda, M. (2019). Kernel-based methods for combining information of several frame surveys. Metrika, 82(1), 71-86.
- Srinath, K. P., Battaglia, M. P., & Khare, M. (2004, August). A dual frame sampling design for an RDD survey that screens for a rare population. In Proceedings of the Survey Research Methods Section of the American Statistical Association (pp. 4424-29).
- Wagner, J., & Lee, S. (2015). Sampling rare populations. In Timothy P. Johnson (Ed.), Handbook of health survey methods (pp.77-106). John Wiley.
- Weerasekera, D., Lynch, C., Clark, R., Gribben, B., Boustead, C., & Tee, N. (2019). Methodology Report 2017/2018: New Zealand Health Survey. Ministry of Health, New Zealand Government. Retrieved from: https://www.health.govt.nz/system/files/documents/publications/nzhs-methodology-report-2017-18-20190319-update.pdf
- West, B. T., Wagner, J., Hubbard, F., & Gu, H. (2015). The utility of alternative commercial data sources for survey operations and estimation: evidence from the National Survey of Family Growth. Journal of Survey Statistics and Methodology, 3(2), 240-264.
-
Keywords
calibration CATI coverage coverage bias cross-national surveys data linkage data quality European Social Survey experiment face-to-face face-to-face survey Facebook hard to reach populations incentives item nonresponse measurement measurement error mixed-mode surveys multitasking non-probability samples Nonresponse nonresponse bias nonresponse rates paradata PIAAC Probability sample probability samples QR codes rare populations response rate Satisficing social desirability Social media survey survey-taking climate survey data survey management survey methods Telephone survey telephone surveys total survey error unit nonresponse validity web survey Web surveys weighting
