

Using Facebook and Instagram to Recruit Web Survey Participants: A Step-by-Step Guide and Application
Kühne, S. & Zindel, Z. (2020). Using Facebook and Instagram to Recruit Web Survey Participants: A Step-by-Step Guide and Application in Survey Methods: Insights from the Field, Special issue: ‘Advancements in Online and Mobile Survey Methods’. Retrieved from https://surveyinsights.org/?p=13558
© the authors 2020. This work is licensed under a Creative Commons Attribution 4.0 International License (CC BY 4.0) 
Abstract
In many countries and contexts, survey researchers are facing decreasing response rates and increasing survey costs. Data collection is even more complex and expensive when rare or hard-to-reach populations are to be sampled and surveyed. In such cases alternative sampling and recruiting approaches are usually needed, including non-probability and online convenience sampling. A rather novel approach to recruiting rare populations for online and mobile-device surveys uses advertisements on social media networks. This paper provides a step-by-step guide on how to recruit web-survey participants via ads on Facebook and Instagram – two of the largest social networks worldwide. Researchers may use this paper as a starting point for setting up their own recruiting campaigns. Moreover, the paper describes the results of fieldwork for a research project in which lesbian, gay, bisexual, transsexual, and queer (LGBTQ) web-survey participants in Germany were recruited via ads on social media.
Keywords
Facebook, Instagram, non-probability samples, Nonresponse, rare populations, social media, Social media survey
Acknowledgement
We would like to thank Steffen Pötzschke (GESIS – Leibniz Institute for the Social Sciences) for sharing his insights on how to handle Facebook’s ad campaign management system.
Copyright
© the authors 2020. This work is licensed under a Creative Commons Attribution 4.0 International License (CC BY 4.0)
Introduction and Background
Many researchers agree that surveys require probability-based samples to allow for meaningful and reliable inferences about a target population. Common and classical approaches for probability sampling of a country’s general population include register-based sampling, random-walk procedures for face-to-face interviewing, and random-digit dialing for telephone interviewing (Groves et al., 2009). However, applying these techniques has become increasingly complex and expensive as survey practitioners and fieldwork agencies face decreasing response rates in many countries worldwide. For instance, in the German General Social Survey (ALLBUS), a bi-annual cross-sectional survey of the general population in Germany, response rates dropped from 69.5% in 1980 to 32.4% in 2018 (GESIS, 2019). A similar pattern was observed in the German Socio-Economic Panel Study (SOEP), in which subsample response rates started at 60.9% in Sample A in 1984 and dropped to, for instance, 33% in the refresher Sample J (Kroh et al., 2019).
Also, when aiming to survey small subpopulations and minorities, applying classical probability-based sampling techniques is not possible or is highly ineffective. On the one hand, lists or register information for rare target populations that could function as a sampling frame is often not available. On the other hand, common techniques such as random walks or random-digit dialing produce a large number of screen-outs, that is, individuals who in principle could be contacted and interviewed but who do not belong to the target population. And even with newer random-sampling approaches, such as the respondent-driven sampling used for recruiting members of rare and hard-to-reach populations in particular, some obstacles can be difficult to overcome (e.g., because such participants can only rarely assess their personal network accurately).
One worthwhile alternative to these problematic approaches is the use of non-probability convenience samples in which participants are recruited online to take part in a web survey. Using non-probability samples reduces the costs not only for the actual data collection (i.e., web surveys are less expensive than the more traditional survey modes) but also for recruiting survey participants (Dillman et al., 2014). Sending e-mail-invitations, using banners and pop-ups on websites, or implementing push-messages on mobile devices is usually less expensive than other recruitment strategies such as telephone screening interviews and advertisements placed in newspapers, on billboards, or sent through the mail. In addition, these reduced costs make it possible to reach rare and hard-to-reach population groups in particular by being able to recruit a larger number of potential survey participants, thus effectively compensating for the problems associated with falling response rates.
A rather new approach to recruiting web-survey participants makes use of online social media and networks such as Facebook and Instagram. Using social networks for recruiting appears to be increasingly worthwhile, because in many countries they represent a growing portion of the general population. For instance, according to a 2019 survey of Germans 14 years of age and older, 35 percent used Facebook and 21 percent used Instagram at least once a month (ARD & ZDF, 2019).
There are several potential advantages to recruiting rare and hard-to-reach populations via social media compared with other recruitment strategies for convenience sampling. For example, ads on social media platforms are rather inexpensive compared with ads either elsewhere on the web (banners, pop-ups) or offline (printed ads in newspapers and magazines and on billboards). Moreover, the greater reach offered by social media platforms can be considered an advantage when one wants to survey rare and hard-to-reach populations. Even a small number of social networks and their advertising platforms allow recruiters to reach hundreds of millions of individuals worldwide, thus increasing the potential for finding and recruiting extremely rare populations. No existing online access-panel service combines that many panelists, which explains why most access panels cannot be used when a relatively small subpopulation is under study. Finally, many users of social networks visit sites and use apps regularly and spend much time browsing the services (Huang, 2017), thereby increasing the number of occasions when researchers may reach out to potential participants.
Another advantage of recruiting via social media is the comparatively large amount of meta-information available on these platforms. Whereas traditional recruitment strategies for online surveys can ascertain only limited information about potential respondents (e.g., previous websites visited or the type of device used), social networks allow recruiters to specifically address and manage target groups. For instance, for researchers aiming to survey members of rare populations, these networks allow them to target specific gender and age groups who have specific interests within a specific geographic region.
In addition, converting potential respondents to the subsequent online survey is a short and uncomplicated process. Users access social network services via smartphones, tablets, and computers. Thus, potential respondents are being reached through the same technology that they would use when participating in a web survey. Transitioning from social media apps on a smartphone by clicking on a link (or an image) to the online survey website is simple for these participants, because they can respond without even putting their phone down. Today, ease-of-use for smartphone users is even more important in that web surveys are almost always mixed-device surveys, with a constantly growing share of respondents participating via mobile devices (Couper et al., 2017). This advantage has the potential of greatly reducing the rate of dropouts between recruitment and actual survey participation.
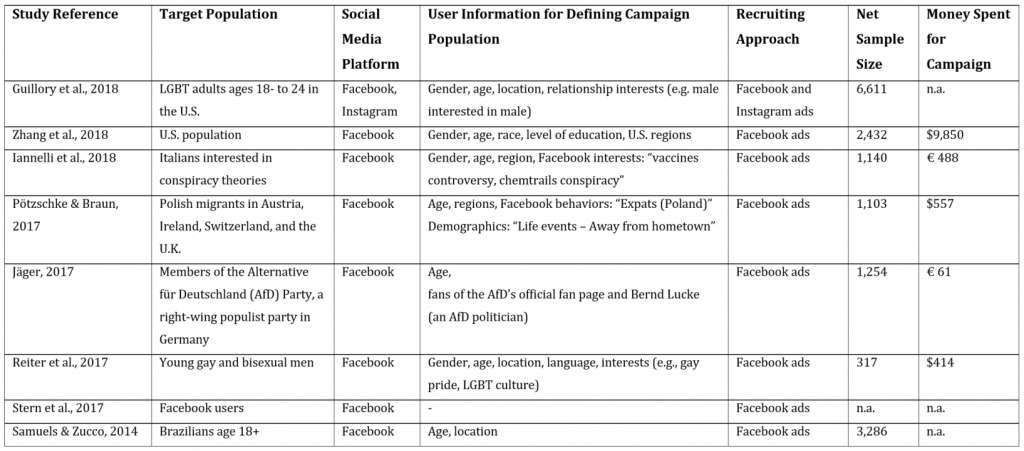
The studies listed in Table 1 made use of Facebook’s (and Instagram’s) advertising system, which allowed researchers to reach potential respondents by displaying ads that would motivate them to take part in a social science survey project (e.g., Guillory et al., 2018; Iannelli et al., 2018; Jäger, 2017; Pötzschke & Braun, 2017; Reiter et al., 2017; Samuels & Zucco, 2014; Stern et al., 2017; Zhang et al., 2018). Note that Table 1 represents a selection of studies based on a simple keyword search targeting relevant research journals to find studies that focused on political, sociological, or economic topics and that involved a sufficiently high number of subjects. Social media recruitment for public health and medical studies was not covered in this literature review (for an overview, see Topolovec-Vranic & Natarajan, 2016).
Table 1: Social Science Web Surveys That Relied on Recruitment via Facebook and/or Instagram
When users visit the Facebook homepage or use the Facebook app on their smartphone, ads will appear between postings and updates from their friends and family (as posts in the user’s timeline, for instance). By clicking on the ad, the user is then forwarded to a browser-based web survey. Facebook allows to specify target groups that define who can in principle see an ad and who cannot. Researchers can use key demographics such as gender, age, and region to define these target populations. Also, surveyors can specify so-called “Interests”, which represent the traits or characteristics that are automatically assigned to a user according to Facebook’s algorithm, which is based on that person’s interactions with the social network. In addition to these advertising systems, researchers can use social media in other ways to recruit target populations, such as through Facebook groups or Facebook pages. For this approach, we refer the reader to Brickman Bhutta (2012) and Baltar and Brunet (2012).
Recruiting via Facebook and Instagram Ads: A Step-by-Step Guide
Although many existing studies on this topic report some recruiting campaign details such as the costs of advertising or the definition of the specific target group, no available publication can serve as a practical guide for researchers who are planning their social media recruiting campaign. In this section we provide a step-by-step guide on how to recruit survey participants via Facebook and Instagram. In the next section, we summarize the results of a specific application: the 2019 “LGBielefeld” survey project, in which lesbian, gay, bisexual, transsexual and queer people in Germany were recruited through ads that appeared on these two social media channels.
Both Facebook and Instagram are among the most widespread social networks in the world today. Facebook was founded in 2004 with the goal of connecting friends, families, communities, and businesses. Basically, the network was designed to enable users to communicate with other users by connecting their profiles, following topic pages, and participating in groups. Since it was founded, Facebook has continued to grow and now includes in its network approximately 2.5 billion monthly users worldwide. Instagram was released in 2010 as a free app to create and share photos with friends. Since being taken over by Facebook Inc. in 2012, Instagram has changed rapidly and now enables users not only to create photos and videos, but also to share them with a wide audience via feed, live stream, or “Stories” (i.e., brief images, gifs, or videos from accounts a user follows that are accessible for only a limited time [usually 24 hours]). Overall, Instagram is one of the fastest growing social media channels, with an estimated 1 billion users worldwide who use the network every month (We are social & Hootsuite, 2020).
The structures of these two social media networks differ substantially. Whereas Facebook is based on direct, mutual relations (i.e., connected people are referred to as “friends”), Instagram users don’t necessarily follow one another’s online activity. Instagram tends to be a more public network than Facebook and focuses primarily on visuals and aesthetics. Although the presence of friend networks within Facebook suggests a quasi-private setting, almost all (inter)actions on Instagram take place publicly. In addition, both channels offer a desktop version, with Instagram mainly focusing on its mobile-device version and certain options (such as live streaming) that are possible only via its app.
Recruiting survey participants via Facebook and Instagram relies on multiple sequential steps. Each recruiting campaign can be subdivided into three stages: (1) preparation, (2) creation of the ad campaign(s), and (3) monitoring and evaluation.
1. Preparation (Account Setup and Requirements)
Advertising on Facebook and Instagram requires opening an account on each of these platforms. These accounts cannot represent organizations or companies but instead need to represent existing individuals. In the case of a research project, a project team member needs to create the accounts or use their own existing private accounts in order for any further steps to be taken in the setup process. Next, a Facebook page must be created that represents the research project or organization/institution. The Facebook page will then be connected to any ad used in an ad campaign, allowing network users to easily access more information about the advertisers by simply clicking on the name of the sponsor as displayed in each ad. Users will then be redirected to the respective Facebook or Instagram page.
Facebook approves each ad before publishing it based on both automatic and manual procedures. Some topics need special verification and authorization (see Facebook, 2020b), including political campaigning and ads thematically related to political or social topics (see Facebook, 2020a). Requirements vary across the countries where the ads are to appear. Because many social science projects relate to political, social, or sensitive topics, researchers may choose to verify their account at this point during the campaign planning stage. Otherwise, some ads may not be approved later on.
2. Creation of the Ad Campaigns
After all admin accounts and pages have been set up, the actual ad campaign can be created. Facebook’s ad management system is structured hierarchically. At the top are the campaigns, and each account may manage multiple ad campaigns at the same time. Each campaign consists of one or multiple “ad sets”, and each ad set consists of one or multiple ads (the bottom layer of the hierarchy).
Facebook and Instagram ads emphasize visual aspects such as images and videos. Most ads display a single photo, and researchers need to produce, buy, or license these images. Because most users do not focus on text when scrolling through their Facebook or Instagram timeline, images are the most important part of any ad campaign and need to be selected carefully. If possible, images should be pretested with members of the target group or with colleagues to identify which ones will be most appropriate and effective. The overall goal in selecting pictures is to capture the attention of individuals in the target population. Once potential participants consciously take an interest in an ad and have read the accompanying information, they may then click on the ad and take part in the survey. Variations in the content of the photos (e.g., individuals of different gender, age, etc.) will allow the researchers to specifically address target population subgroups. This is an important aspect, since the content that people find interesting in images and that attracts their attention varies greatly. Thus, more variation in the images used in an ad campaign will also probably lead to more heterogeneity among the respondents.
Each image (or video) is accompanied by a caption, a brief descriptive text, and an (invisible) link redirecting the user to an external web page or a Facebook page. The textual information should inform users about the project and motivate them to participate. Researchers may directly address users by inserting imperative phrases, such as “Take part in our survey on Topic X!”. Finally, the ad design needs to be optimized by experimenting with the various ad formats and placements offered by Facebook and Instagram, including ads displayed in a user’s timeline or in Stories. Facebook’s ad management system provides an ad preview for all available placements. At this point in the process, we recommend that researchers also check for the look and readability of the ad on different devices, especially on smartphones that have comparatively small displays (i.e., 5 inches or smaller).
To comply with the ad management system rules, ads cannot stand alone; it is technically necessary for them to be associated with an ad set, even if the set contains only one ad. Ad sets allow researchers to specify how one or multiple ads should run, that is, how ads are displayed and to whom. Moreover, campaign plans and details can be specified only at the ad set level and include the target population, a timeframe, budget, and ad channels. The target user population can be specified using the Facebook/Instagram user’s self-reported gender, age, and location. Facebook also offers so-called “Interests” as a way of characterizing users based on any information obtained from a given user’s interactions (for instance, placing a “like” on a posting or page). The algorithm then assigns likely interests to each user. These interests can be physical (“cars”) or abstract (“gay pride”). Combining users’ sociodemographic data and range of interests helps to define a target population (“target audience”) that represents those for whom the probability of seeing an ad will be positive (non-zero).
Each ad set needs to be defined by a start and end date. Moreover, a given (maximum) budget needs to be assigned and will not be exceeded throughout the campaign. The actual costs of a campaign depend on an internal, algorithm-based auction system. Thus, costs vary with respect to time, location, and market demand. The more companies and organizations place ads at a certain time, location, and target audience, the higher the price. Facebook offers different cost plans. For researchers who want to direct users to converge on an external website to take part in a survey, the costs-per-click (CPC) approach fits best. Here, the algorithm aims to maximize the number of clicks on the ads and thus the number of individuals who can be redirected to the online-survey website. Other options include costs-per-mille (CPM) (i.e., costs per 1,000 impressions [conscious/subconscious views]), which maximizes the number of individuals who (in principle) saw the ad but did not necessarily interact with (click on) it. For each ad set, a maximum daily budget is specified (e.g., $20), and the ad algorithm then delivers ads to users until the specified daily maximum is reached.
3. Monitoring and Evaluation of the Campaign
We recommend that the researchers carefully monitor and evaluate their ad campaign. During the early campaign period, daily check-routines are recommended, as follows: First, researchers may want to answer questions that users have posted below an ad or on the project’s Facebook page. Sometimes, it is also necessary to moderate comments and discussions or even to hide or delete certain undesirable comments (e.g., if they contain hate speech and insults). Second, researchers should evaluate the costs per click and costs per completed interview soon after launching the ad campaign. Costs depend on Facebook’s ad auction algorithm, as well as on users’ interest in the topic and their motivation to click on an ad and then actually take part in the survey. As a consequence, costs will vary across research topics and target populations. By calculating the actual costs per completed interview after the first few days of an ongoing ad campaign, the researcher can make controlled adjustments to the daily budget being spent on ad sets. Third, Facebook’s ad management system allows one to monitor the performance of each ad and ad set. Ads that do not result in clicks may be removed by the researchers from ad sets. Finally, analyzing the composition of respondents based on the survey data can inform about which ad sets need to be “boosted” to reach minimum subgroup sample sizes.
Having outlined the step-by-step recommendations for recruiting survey participants via Facebook and Instagram, we now present the practical approach to working with these social media platforms as a sampling frame.
Application: Recruiting from the LGBTQ Community and from Rainbow Families in Germany
When it comes to recruiting members of a rare population, traditional recruiting approaches often fail to reach some of the study’s objectives or to provide a sufficient number of recruits owing to limited financial or personal capacities. For this reason, the present study was designed to assess the use of social media platforms as an alternative recruitment tool for studying the hard-to-reach lesbian-gay-bisexual-transsexual-queer (LGBTQ) population. Thus, an online convenience sample was initiated for recruiting participants via social media. In the following sections, we describe the background and goals of our study, explain the ad campaign itself in detail, highlight the fieldwork and campaign results, and offer some insights into the sample composition and quality of data obtained in this way.
Background and Goals
Diverse forms of living, sexual orientation, and gender identity are increasingly discussed topics in society, the media, politics, and research. However, in many countries, no reliable and representative survey data about sexual and gender minorities are available (see Kühne et al., 2019). For instance, the first nationally representative estimate of the size of the LGB population in Germany was not available until 2017 (see Kroh et al., 2017). Moreover, high-quality survey data are greatly needed to investigate social inequality and discrimination in order to meet the supra-national and national standards demanded by the European Union (see Directive 2006/54/EC. and Council Directive 2004/113/EC.).
In 2019, to strengthen the LGBTQ (lesbian, gay, bisexual, transsexual, queer) survey data infrastructure in Germany, the Socio-Economic Panel (SOEP) initiated a random sample of LGB households. The SOEP is a longitudinal survey of private households in Germany that has conducted annual interviews since 1984 (see Goebel et al., 2018). The SOEP-LGB sample was based on a telephone screening approach followed by face-to-face, computer-assisted personal interviews (CAPI). Screening questions on sexual orientation and gender identity were integrated into random-sample telephone surveys (random-digit dialing, dual-frame) operated by KANTAR, with about 2,000 computer-assisted telephone interviews (CATI) per week. If an individual matched the target population of LGBTQ in Germany, they were asked to participate in the SOEP study and to provide contact information. After providing this information, the entire household was asked to participate in personal interviews . More than 69,000 screening interviews were conducted, resulting in a sample of 718 households willing to participate in the SOEP. From those, 465 households actually participated (response rate: 68%, AAPOR RR1) (The American Association for Public Opinion Research, 2016). The representative but costly sample of these 465 households allowed for a variety of analyses and comparisons with the non-LGB population in Germany. However, the sample size did not allow for regional comparisons and subgroup analyses, such as the living conditions of “rainbow families”, (i.e., households of same-sex couples with children). Here, the practical limits of probability sampling seem to have been reached, given the large but still limited research budget.
To address this limitation, our team at Bielefeld University initiated an additional online convenience sample for which participants were recruited via Facebook and Instagram. The questionnaire was programmed using LimeSurvey, and its design was optimized for mobile devices to assure compatibility with different hardware and software and functionality on mobile devices such as smartphones.
Ad Campaign Details
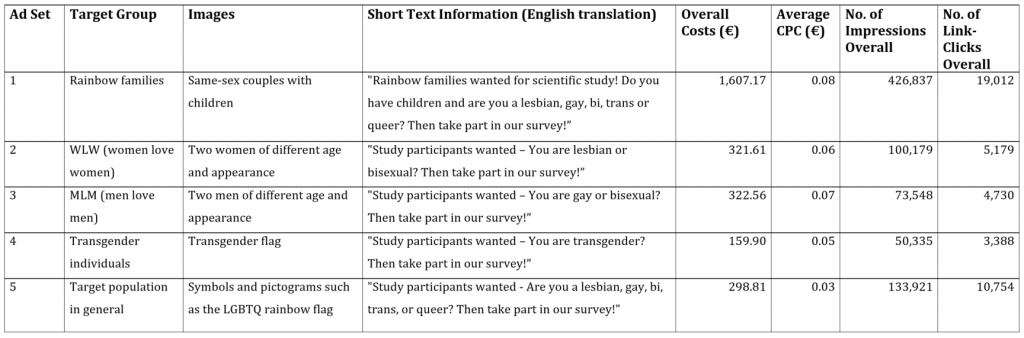
Our recruiting campaign was launched on July 3, 2019 and closed on August 2, 2019. Ads were shown on Facebook’s Timeline (desktop and smartphone versions) as well as on Instagram’s Timeline and “Stories” (smartphone only). Several ad sets were used to address different subgroups within our target population. Ad set 1 addressed rainbow families by showing different images of same-sex couples with children. Ad set 2 addressed females by showing various images of two women of different ages and appearances. Ad set 3 addressed males by showing images of two men of varying ages and appearances. Ad set 4 addressed transgender individuals by showing the “transgender flag” (see Wikipedia contributors, 2020, August 7). Finally, ad set 5 was aimed at the target population in general by using symbols and pictograms such as the “LGBTQ rainbow flag”. Each ad was accompanied by a caption and a short text informing the user about our survey and encouraging them to take part in it. Figure 1 shows selected examples of these ads, including the short invitation texts and how the ads were displayed on the two social media platforms. Table 2 provides additional information regarding the respective ad sets.
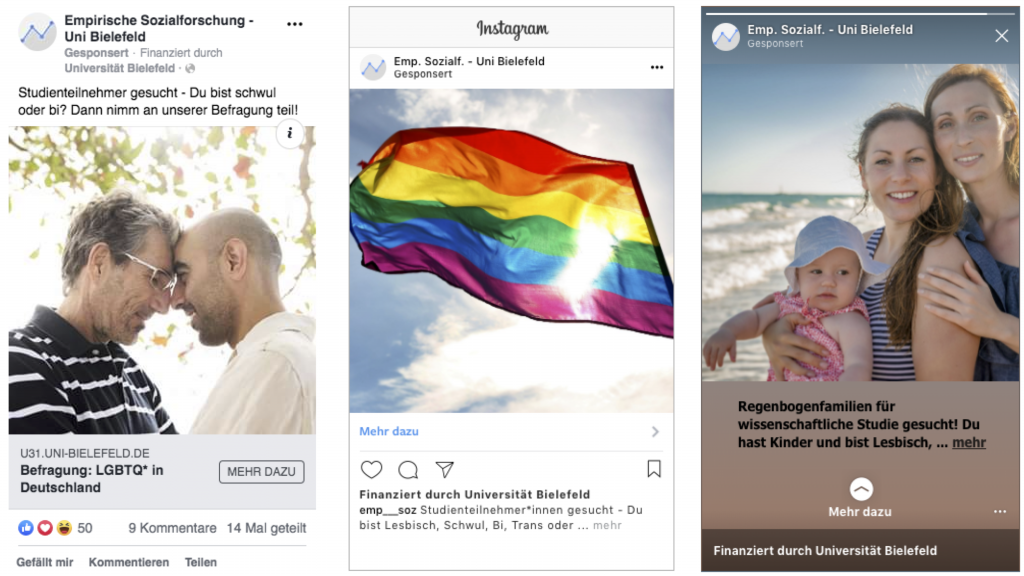
Figure 1: Examples of ads as shown on the Facebook app Timeline (left panel) (ad set 3), the Instagram app Timeline (middle panel) (ad set 5), and the Instagram app Stories (right panel) (ad set 1)
With respect to the costs and payment method, we chose the auction-based “CPC” approach and a maximum cost limit per day and per ad set. The total maximum budget for the ad campaign was € 3,000. Because our research project specifically focused on rainbow families, 60 percent of the total budget was assigned to ad set 1.
Fieldwork and Campaign Results
Our ad campaign reached 335,461 individuals, with 784,820 impressions (i.e., the total number of times an individual [consciously/subconsciously] saw one of our ads). Table 2 shows the cost and reach for each of the five individual ad sets. Since most of the budget was assigned to the recruitment of rainbow families, ad set 1 achieved the largest percentage of impressions. Ad set 4, which specifically targeted transgender people, had the lowest reach.
A total of 43,063 link-clicks were achieved, with the ad sets with particularly high number of impressions (ad sets 1 and 5) resulting in particularly high link-click counts and vice versa for the ad sets with lower reach (ad sets 3 and 4). Of the overall link-click total, 12,263 (28.5 percent) started answering the questionnaire – that is, they saw at least the first survey question – and 7,129 (58.1 percent) individuals completed the entire questionnaire. Of these, only 43 (0.6 percent) individuals did not belong to our target population of LGBTQ in Germany based on their self-reported sexual orientation and gender identity.
The total costs for ads amounted to €2,710.05 (about $2,990). The average CPC was €0.063 (or 6.3 Eurocent). Ad sets varied with respect to their CPC, with the lowest average in ad set 5 relying on symbols (e.g., rainbow flag) at €0.03 and the highest average in ad set 1 targeting rainbow families (€0.08) (see Table 2).
The average net cost for a completed interview amounted to €0.38 (or 38 Eurocent).
Table 2: Overall Cost and Reach of the Individual Ad Sets
About 80 percent of all clicks were generated through Instagram, with 99 percent of those generated through Instagram Stories (in contrast to its Timeline). With respect to the devices used when users clicked on an ad, over 98 percent used smartphones, 1 percent used a desktop PC, and less than 1 percent used tablets. Of the smartphone users, 60 percent used an iPhone. Excluding potential outliers (bottom and top one percent), the average completion time for the survey was 14 minutes.
Clearly, these findings show that recruiting via Facebook and Instagram ads results in a smartphone survey (rather than a mixed-device web survey). This finding has important implications for survey design: short surveys and optimized questionnaire design are crucial factors for the success of social media recruitment.
Facebook provides meta-information about the performance of a campaign, including, for instance, the total number of individuals reached through an ad on a given day. Analyzing the campaign meta-information allows us to learn about the performance of Facebook’s ad auctioning and publishing algorithm – a black box, since Facebook provides almost no detailed information about how the algorithm works (Andreou et al., 2018; Thorson et al., 2019). Because the algorithm’s main objective is to maximize the number of clicks rather than maintaining a sample that resembles Facebook users in terms of their sociodemographic characteristics, the net sample of participants may also move toward a systematic and biased composition.
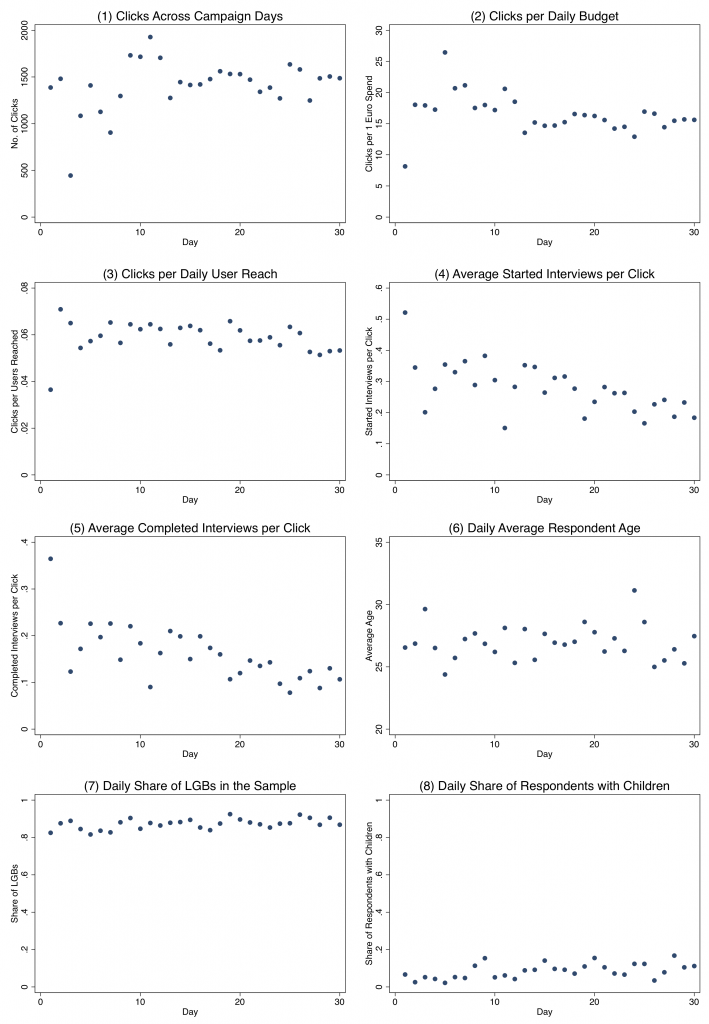
Figure 2: Campaign and survey results across the 30-day fieldwork period
Figure 2 displays campaign results and features across the 30-day fieldwork period. Systematic changes in patterns over time (i.e., slopes) indicate changes in the performance of the campaign or the ad distribution algorithm. Plots 1, 2, and 3 relate to clicks on the ads, clicks for each euro spent on a given day, and the average number of clicks per users reached, respectively. As can be seen, the results became rather stable throughout the campaign period after showing a larger variance within the first days of the campaign. A possible explanation for this pattern could be that the algorithm tests several publishing and distribution approaches before selecting specific rules and procedures. Plots 4 and 5 relate to realized web-survey interviews. For both started and completed interviews, we observed a slight decrease in the efficiency of the ad campaign: with ongoing fieldwork, the average daily number of started and completed interviews per click decreased. One possible explanation for this could be that the more highly motivated members of the target population had already participated at the beginning of the campaign, so the share of less motivated users increased over time. Finally, Plots 6, 7, and 8 relate to the composition of users who completed an interview. Does the ad distribution algorithm attract a more and more homogeneous group of users over time? The distributions of the average age of the respondent, the share of LGBs in the sample, and the share of respondents with their own children showed no evidence that the homogeneity of the participants grew over time.
Sample Composition and Quality
The success of a web-survey project can be evaluated by means of different indicators. An important aspect is whether the target population groups could be reached and motivated to participate in the survey. As can be seen from Table 3, the majority of respondents in our study who completed the questionnaire self-identified as LGB or as having another non-heterosexual orientation. In fact, out of the 121 respondents who self-identified as heterosexual, 78 did not self-identify as male or female, thus, they still match our target population of individuals with non-binary gender identities. In addition, recruiting the extremely rare subpopulation of individuals in rainbow families was a major success. More than 28 percent of all respondents were living together with underage (< 18 years old) household members.
Table 3: Comparison of Sample Composition in the Social Media Sample (LGBielefeld) and the Probability-based Sample (SOEP-LGB)
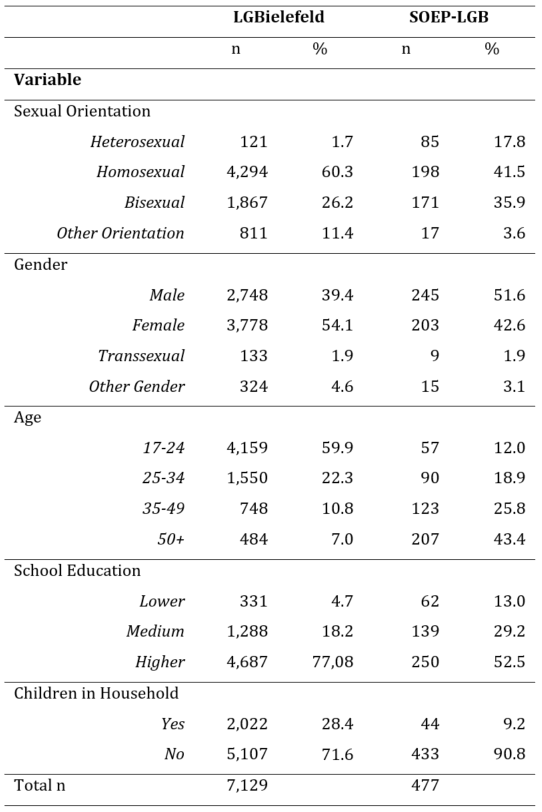
Another key aspect of data quality relates to potential errors in the survey data (“Total Survey Error”; see Groves & Lyberg, 2010). In order to learn about potential coverage error, key features of the composition of the social media sample were compared with those of the SOEP-LGB probability-based sample, from which a random sample of LGB households in Germany was drawn based on a telephone screening followed by face-to-face interviews. Please note that we are currently working on the final weighting strategies for both datasets, hence the following information was derived from the unweighted datasets.
As can be seen from Table 3, the composition of the sample recruited via Facebook and Instagram was more successful insofar as it was possible to survey a greater number of people from the LGB community (see “Sexual Orientation” section in Table 3). This confirms the postulated advantage of social networks in allowing us to reach a large number of members of rare target populations within a very short time. In comparison, the SOEP-LGB contains a larger number of individuals who self-identified as heterosexual during the personal interviews (even though they were classified as target population members in the telephone screening). A possible explanation relates to the survey mode: respondents may openly identify as homosexual or bisexual in a telephone screening interview but may answer differently when face-to-face with an interviewer.
Further comparison of the demographic composition of both samples indicated that the non-probabilistic (unweighted) social media sample was heavily biased. It consisted of comparatively more females, most likely due to the fact that we aimed at recruiting rainbow families, and females (mothers) are more likely than males (fathers) to live with children in their households (see “Gender” section in Table 3). Moreover, the social media sample was much younger than the SOEP-LGB sample. About 60 percent of all our respondents were 24 years of age or younger (see “Age” section in Table 3). The most plausible explanation for this finding is the sampling approach itself: users on Facebook and especially on Instagram are much younger compared with the population average (Mellon & Prosser, 2017). It is likely that this would also explain the high average educational level in the social media sample, because younger age cohorts in Germany are more likely to have obtained a high school diploma when compared with previous generations (see “School Education” section in Table 3). In order to compensate for these biases, appropriate adjustment strategies must be developed and applied in future work. But even when such adjustments are made, there is no guarantee that they will compensate for these biases (see, e.g., Cornesse et al., 2020). Therefore, whether or not such adjustments will really help avoid the bias present seen here remains an open question, but at the same time offers an opportunity for additional research.
Another aspect of (prospective) survey data quality and research potential relates to the willingness of participants to be re-interviewed in the future or to take part in a panel study, since high rates of re-participation minimize the potential for nonresponse bias in the analyses of survey data collected in subsequent waves. We asked participants to provide an e-mail address if they were willing to be contacted again for another web survey. More than 62 percent (4,433) of the respondents complied – a highly successful result for an online convenience sample.
Discussion
Recruiting participants has become increasingly expensive for survey practitioners, especially when targeted population groups are rare or hard-to-reach. Social media-based sampling offers a new and comparatively inexpensive alternative to classic recruiting strategies such as advertisements on web pages, offline, or via online access panels. Besides costs, it comes along with other advantages including available information about social network users, and that information can be used throughout the recruiting process. In this paper, we provided a step-by-step guide for researchers planning to recruit web survey participants via social media and presented results of a recruiting campaign involving the LGBTQ community in Germany. In the 2019 LGBielefeld project, we were able to successfully recruit a large number of target population participants while investing only a small advertisement budget. The results of our fieldwork point to the growing importance of Instagram as a recruitment tool and show that social media recruitment results in mobile-device (smartphone) surveys.
Although its low costs and practicability make social media recruitment a promising strategy, several potential issues and sources of error remain and warrant much more research. First of all, social media recruiting comes with a potentially large undercoverage error. Clearly, not everyone uses Facebook or Instagram, and even today not all target population members can be reached via the Internet. Therefore, this recruiting approach systematically excludes some population groups. At the same time, it has been shown, for example, that those who use the Internet regularly tend to be younger and more highly educated (Chinn & Fairlie, 2006) as well as healthier (Schnell et al., 2017). We need more information about who can and cannot be reached in order to decide whether or not social media-based recruiting matches a project’s goals. Second, we need more information about Facebook’s ad distribution algorithm – a black-box, since Facebook does not publish details about it. What parameters are used to decide who gets an ad displayed and who doesn’t? Can we influence this choice through campaign settings and management? Experimental and “reverse-engineering” approaches – that is, as a way to learn about the underlying functionalities of Facebook’s algorithm based on experimental and statistical inference (see e.g., Ho, 2020) – may in future studies help to shine a light on some of these details. Third, we need to develop adjustment routines to counteract potential bias. Because all convenience-sample approaches face the challenges of unknown selection probabilities for target population members and self-selection of respondents into the sample, questions related to statistical inference and generalizability remain to be answered. Weighting techniques such as propensity score adjustment (Lee, 2006) may minimize bias in estimates to some degree but probably not for all variables of interest. Thus, there is an urgent need to carry out further investigations to compensate for varying self-selection probabilities, for instance, by taking into account that some individuals own more than one social media account and that users vary in the time they spend on social media. At best, a research project can systematically compare data from a social media-recruited web survey with data from a parallel probability-based sample of the same target population. For example, post-stratification techniques that adjust sample distributions to meet known population distributions can be employed. But here, too, there are still some research gaps and thus great potential for further research. Finally, we need well-established techniques that will allow probability and non-probability samples to be integrated for survey data analysis. This is a promising approach as a way to benefit from the advantages of both techniques – that is, to both improve the cost and minimize the error in survey estimates. Recent studies have shown that a joint analysis of data collected from parallel probability and non-probability samples can reduce bias compared with an analysis of a probability-only sample (see, e.g., Sakshaug et al., 2019). It will be necessary to follow up on these findings in future studies.
References
- The American Association for Public Opinion Research (2016). Standard Definitions: Final Dispositions of Case Codes and Outcome Rates for Surveys (9th ed.). AAPOR.
- Andreou, A., G. Venkatadri, O. Goga, K. P. Gummadi, P. Loiseau & A. Mislove (2018). Investigating Ad Transparency Mechanisms in Social Media: A Case Study of Facebook’s Explanations. In Proceedings 2018 Network and Distributed System Security Symposium. San Diego, CA: Internet Society.
- ARD & ZDF (2019). Ergebnisse der ARD/ZDF Onlinestudie 2019. Retrieved from www.ard-zdf-onlinestudie.de/files/2019/Ergebnispraesentation_ARD_ZDF_Onlinestudie_PUBLIKATION_extern.pdf (Accessed: 03 January 2020).
- Baltar, F. & I. Brunet (2012). Social research 2.0: virtual snowball sampling method using Facebook. Internet Research, 22(1), 57–74.
- Brickman Bhutta, C. (2012). Not by the Book. Sociological Methods & Research, 41(1), 57–88.
- Chinn, M. D. & R. W. Fairlie (2006). The determinants of the global digital divide: A cross-country analysis of computer and internet penetration. Oxford Economic Papers, 59(1), 16–44.
- Cornesse, C., A. G. Blom, D. Dutwin, J. A. Krosnick, E. D. de Leeuw, S. Legleye, J. Pasek, D. Pennay, B. Phillips, J. W. Sakshaug, B. Struminskaya & A. Wenz (2020). A Review of Conceptual Approaches and Empirical Evidence on Probability and Nonprobability Sample Survey Research. Journal of Survey Statistics and Methodology, 8(1), 4–36.
- Couper, M., C. Antoun & A. Mavletova (2017). Mobile Web Surveys. A Total Survey Error Perspective. In P. P. Biemer, E. de Leeuw, S. Eckman, B. Edwards, F. Kreuter, L. E. Lyberg, N. C. Tucker, & B. T. West (Eds.), Total Survey Error in Practice (pp. 133–154). New Jersey: Wiley.
- Dillman, D. A., J. D. Smyth & L. M. Christian (2014). Internet, phone, mail, and mixed-mode surveys: the tailored design method (4th edition). Hoboken: Wiley.
- Council Directive 2004/113/EC of 13 December 2004 implementing the principle of equal treatment between men and women in the access to and supply of goods and services (2004), OJ L373/37.
- Directive 2006/54/EC of the European Parliament and of the Council of 5 July 2006 on the implementation of the principle of equal opportunities and equal treatment of men and women in matters of employment and occupation (recast) (2006), OJ L204/3.
- Facebook (2020a). Wahlwerbung bzw. Werbung zu politischen oder gesellschaftlich relevanten Themen. Retrieved from www.facebook.com/business/help/167836590566506?id=288762101909005 (Accessed: 03 January 2020).
- Facebook (2020b). Werberichtlinien. Retrieved from www.facebook.com/policies/ads (Accessed: 03 January 2020).
- GESIS (2019). ALLBUS Allgemeine Bevölkerungsumfrage der Sozialwissenschaften. Ein Kompendium standardisierter Surveydeskriptionen. Release 2019.05.
- Goebel, J., M. M. Grabka, S. Liebig, M. Kroh, D. Richter, C. Schröder & J. Schupp (2018). The German Socio-Economic Panel (SOEP). Jahrbücher Für Nationalökonomie Und Statistik, 239(2), 345–360.
- Groves, R. M., Fowler, F. J., Couper, M. P., Lepkowski, J. M., & Singer, E. (Eds.) (2009). Wiley series in survey methodology. Survey methodology (2nd ed.). Wiley.
- Groves, R. M. & L. Lyberg (2010). Total Survey Error: Past, Present, and Future. Public Opinion Quarterly, 74(5), 849–879.
- Guillory, J., K. F. Wiant, M. Farrelly, L. Fiacco, I. Alam, L. Hoffman, E. Crankshaw, J. Delahanty & T. N. Alexander (2018). Recruiting Hard-to-Reach Populations for Survey Research: Using Facebook and Instagram Advertisements and In-Person Intercept in LGBT Bars and Nightclubs to Recruit LGBT Young Adults. Journal of Medical Internet Research, 20(6), 1–23.
- Ho, J. C.‑T. (2020). How biased is the sample? Reverse engineering the ranking algorithm of Facebook’s Graph application programming interface. Big Data & Society, 7(1), 1-15.
- Huang, C. (2017). Time Spent on Social Network Sites and Psychological Well-Being: A Meta-Analysis. Cyberpsychology, Behavior, and Social Networking, 20(6), 346–354.
- Iannelli, L., F. Giglietto, L. Rossi & E. Zurovac (2018). Facebook Digital Traces for Survey Research: Assessing the Efficiency and Effectiveness of a Facebook Ad–Based Procedure for Recruiting Online Survey Respondents in Niche and Difficult-to-Reach Populations. Social Science Computer Review, OnlineFirst, 1–15.
- Jäger, K. (2017). The potential of online sampling for studying political activists around the world and across time. Political Analysis, 1–15.
- Kroh, M., Kühne, S., Richter, D., & Kipp, C. (2017). Income, social support networks, life satisfaction: lesbians, gays, and bisexuals in Germany. DIW Economic Bulletin 33–35.2017. Berlin: DIW/SOEP. Retrieved from www.diw.de/documents/publikationen/73/diw_01.c.563931.de/diw_econ_bull_2017-33-2.pdf
- Kroh, M., Kühne, S., Siegers, R., & Belcheva, V. (2019). SOEP-Core – Documentation of Sample Sizes and Panel Attrition (1984 until 2016). SOEP Survey Papers 480: Series C. Berlin: DIW/SOEP.
- Kühne, S., M. Kroh & D. Richter (2019). Comparing Self-Reported and Partnership-Inferred Sexual Orientation in Household Surveys. Journal of Official Statistics, 35(4), 777–805.
- Lee, S. (2006). Propensity Score Adjustments as a Weighting Scheme For Volunteer Panel Web Surveys. Journal of Official Statistics, 22(2), 329–349.
- Mellon, J. & C. Prosser (2017). Twitter and Facebook are not representative of the general population: Political attitudes and demographics of British social media users. Research & Politics, 4(3), 205316801772000.
- Pötzschke, S. & M. Braun (2017). Migrant Sampling Using Facebook Advertisements: A Case Study of Polish Migrants in Four European Countries. Social Science Computer Review, 35(5), 633–653.
- Reiter, P. L., M. L. Katz, J. A. Bauermeister, A. B. Shoben, E. D. Paskett & A.‑L. McRee (2017). Recruiting Young Gay and Bisexual Men for a Human Papillomavirus Vaccination Intervention Through Social Media: The Effects of Advertisement Content. JMIR Public Health and Surveillance, 3(2), 1–10.
- Sakshaug, J. W., A. Wiśniowski, D. A. P. Ruiz & A. G. Blom (2019). Supplementing Small Probability Samples with Nonprobability Samples: A Bayesian Approach. Journal of Official Statistics, 35(3), 653–681.
- Samuels, D. & C. Zucco (2014). The Power of Partisanship in Brazil: Evidence from Survey Experiments: The POWER OF PARTISANSHIP IN BRAZIL: Evidence FROM SURVEY EXPERIMENTS. American Journal of Political Science, 58(1), 212–225.
- Schnell, R., M. Noack & S. Torregroza (2017). Differences in General Health of Internet Users and Non-users and Implications for the Use of Web Surveys. Survey Research Methods, 11(2), 105–123.
- Stern, M. J., I. Bilgen, C. McClain & B. Hunscher (2017). Effective Sampling From Social Media Sites and Search Engines for Web Surveys: Demographic and Data Quality Differences in Surveys of Google and Facebook Users. Social Science Computer Review, 35(6), 713–732.
- Thorson, K., K. Cotter, M. Medeiros & C. Pak (2019). Algorithmic inference, political interest, and exposure to news and politics on Facebook. Information, Communication & Society, 1–18.
- Topolovec-Vranic, J. & K. Natarajan (2016). The Use of Social Media in Recruitment for Medical Research Studies: A Scoping Review. Journal of Medical Internet Research, 18(11), e286.
- We are social & Hootsuite (2020). Digital 2020: Global Digital Overview. Essential Insights into how People around the World use the Internet, Mobile Devices, Social Media, and Ecommerce. Retrieved from wearesocial-net.s3-eu-west-1.amazonaws.com/wp-content/uploads/common/reports/digital-2020/digital-2020-global.pdf (Accessed: 06 May 2020).
- Wikipedia contributors (2020, August 7). Transgender flags. Wikipedia, the Free Encyclopedia. Retrieved from en.wikipedia.org/w/index.php?title=Transgender_flags&oldid=971735744 (Accessed: 30 August 2020).
- Zhang, B., M. Mildenberger, P. D. Howe, J. Marlon, S. A. Rosenthal & A. Leiserowitz (2018). Quota sampling using Facebook advertisements. Political Science Research and Methods, 1–7.
-
Keywords
calibration CATI coverage coverage bias cross-national surveys data linkage data quality European Social Survey experiment face-to-face face-to-face survey Facebook hard to reach populations incentives item nonresponse measurement measurement error mixed-mode surveys multitasking non-probability samples Nonresponse nonresponse bias nonresponse rates paradata PIAAC Probability sample probability samples QR codes rare populations response rate Satisficing social desirability Social media survey survey-taking climate survey data survey management survey methods Telephone survey telephone surveys total survey error unit nonresponse validity web survey Web surveys weighting
