

Just a Difficult Election to Poll? How Context Affects Polling Accuracy
Sohlberg, J. & Branham, J. A. (2020). Just a Difficult Election to Poll? How Context Affects Polling Accuracy. Survey Methods: Insights from the Field. Retrieved from https://surveyinsights.org/?p=13652. The data used in this article is available for reuse from http://data.aussda.at/dataverse/smif at AUSSDA – The Austrian Social Science Data Archive. The data is published under the Creative Commons Attribution-ShareAlike 4.0 International License and can be cited as: ” Replication data for: Sohlberg, J. & Branham, J. A. (2020) Just a Difficult Election to Poll? How Context Affects Polling Accuracy. ” https://doi.org/10.11587/FSYU0A, AUSSDA.
© the authors 2020. This work is licensed under a Creative Commons Attribution 4.0 International License (CC BY 4.0) 
Abstract
Although polling accuracy increases throughout the election, polls are always at least a little wrong on election day. In this article, we attempt to understand how characteristics of particular elections may make them harder (or easier) to predict. In particular, we focus on estimating the impact of voter turnout, electoral change, and vote buying on polling error. We find support for two of the three hypotheses. There is little evidence that voter turnout affects polling error. However, polling errors tend to be higher where there have been large changes in parties’ vote share from the previous election. We also find that higher prevalence of vote buying may be associated with larger polling errors.
Keywords
electoral change, polling context, turnout, vote buying, voting behaviour
Acknowledgement
We would like to thank Mikael Gilljam, Christopher Wlezien, Johann Bacher and the anonymous reviewers for helpful comments and suggestions.
Copyright
© the authors 2020. This work is licensed under a Creative Commons Attribution 4.0 International License (CC BY 4.0)
Introduction
One of the uses of election polling is to predict the eventual outcome of the election (Hillygus 2011). Their accuracy varies widely; sometimes pollsters are quite close to the actual election outcome, but other times polls are off by wide margins. When polls are off by a lot, pollsters and academics try to understand why and how polling went wrong so that it can be improved in the future. Commissions that try to asses polling errors sometimes point to flaws in sampling methods (for examples, Mosteller and Doob 1949; Sturgis et al. 2016; Kennedy et al. 2017). These commissions usually focus on single elections, which is also common in research on the causes of polling accuracy (for examples, Jowell et al. 1993; Durand, Blais, and Vachon 2001; Traugott 2001). Somewhat less frequently, scholars look at sources of polling inaccuracy within one country over multiple years (Shamir 1986; Mitofsky 1998; Desart and Holbrook 2003; Magalhaes 2005).
However, since polling accuracy varies over time and by country, it would be helpful to compare polls over many countries and elections. Only recently have scholars gathered enough data to be able to systematically analyse polling accuracy in such a manner. Building on this material, our understanding of polling accuracy has improved substantially, especially with regard to institutional features (Jennings and Wlezien 2016; Wlezien, Jennings, and Erikson 2017).
However, our understanding of the determinants of polling accuracy from this perspective is still incomplete. While the impact of institutions on polling accuracy is important to understand, it is equally important to understand the impact of non-institutional factors. To be clear, in the context of electoral circumstances, we view polling error as a function of both institutional and non-institutional factors:
Poll Error = f(institutional, non-institutional) (1)
Previous research has focused exclusively on the institutional side of that relationship. In this paper, we begin to consider the non-institutional side. Until we have a better understanding of how such factors influence polling accuracy, survey practitioners may fret over the error of their survey instruments without realizing that the instruments are no worse than previous years; the election was simply harder to predict due to a more challenging polling environment. Similarly, an increase in accuracy compared to previous elections may not signify that pollsters improved, but that the environment of that particular election was more forgiving.
In this paper, we begin to address this gap in the research by assessing how contextual circumstances affect accuracy of polls across countries and elections. Since this research area is relatively new, we take a broad approach and draw on research from diverse fields in identifying potential contextual determinants. Specifically, we test three hypotheses: that polling error is lower when (1) voter turnout is higher, (2) electoral change from one election to the next is lower, and (3) vote buying is less prevalent. We find that decreases in electoral change and vote buying tend to result in more accurate polls. However, contrary to a common assumption and the findings of several post-mortem polling commissions, voter turnout does not seem to be systematically related to polling accuracy.
Sources of variability in polling accuracy
Prior research has identified several factors that affect how close polls are to the election outcome. As expected, based on probability theory, polls with larger sample sizes tend to be more accurate (Lau 1994; Desart and Holbrook 2003; Magalhaes 2005). For this to be true, however, data quality needs to be high. Otherwise, larger sample sizes are not associated with higher accuracy (Meng, 2018). We also know that polls are more accurate the closer they are to the election date (Jennings and Wlezien 2016).
The sampling method used can also affect polling accuracy. While opt-in internet surveys can be as accurate as probability-based polls if advanced techniques are used to adjust for the inherent biases of self-selected samples (Ansolabehere and Schaffner 2014; Wang et al. 2015), these samples are often associated with more bias in practice (Cornesse et al. 2020).
With response rates falling worldwide (Curtin, Presser, and Singer 2005; Kohut et al. 2012), there has been much interest in determining whether lower response rates are associated with lower polling accuracy. Generally speaking, this does not seem to be the case. Even though nonresponse bias is a plausible concern as response rates drop, polls with low response rates are not more biased overall (Keeter et al. 2006; Groves and Peytcheva 2008; Kohut et al. 2012).
As for other factors, more accurate polls tend to screen for likely voters (Desart and Holbrook 2003), are fielded over a longer period (Lau 1994), and are not sponsored by the parties or candidates themselves (Hennessy and Hennessy 1961; Shamir 1986; Martin, Traugott and Kennedy 2005).
Institutional features also affect polling accuracy. Jennings and Wlezien (2016) find, for example, that there is a difference in polling accuracy between presidential and parliamentary systems (though that difference disappears by election day). Our study differs from theirs in several important ways. Whereas Jennings and Wlezien (2016) look at variation across electoral systems, we examine variation within an electoral system. They show that systems can explain quite a bit of polling accuracy, but there still is variation to explain, and that is what we examine here.
However, almost all studies on polling accuracy focus on specific countries. A large portion of these examine accuracy in the United States (for example, Traugott 2005; Panagopoulos 2009) or the United Kingdom (for example, Pickup et al. 2011; Sturgis et al. 2016), yet some use data from countries such as France (Arzheimer and Evans 2014), Italy (Callegaro and Gasperoni 2008), Portugal (Magalhaes 2005), Mexico (Cantú, Hoyo, and Morales 2015), and Sweden (Sohlberg, Gilljam, and Martinsson 2017). While these studies are helpful in improving our understanding of polling accuracy, we still know little of the specific electoral circumstances that make polling harder or easier. Drawing on research from multiple areas, we have identified three factors that seem especially likely to influence cross-national polling accuracy over time.
Voter turnout
When most citizens cast a vote, pollsters potentially have an easier job because they become less reliant on likely voter models. Likely voter models attempt to account for the fact that there may be (and usually are) systematic differences between individuals who vote and those who do not. If we naively include everyone in the sample, then the sample may be biased, especially if non-voters have different preferences than voters. Unfortunately, these likely voter models are difficult to calibrate, as there are major differences between elections in what kinds of people turn out to vote. For example, in the U.S. 2008 presidential election, African Americans voted at unprecedented rates (Philpot, Shaw, and McGowen 2009), which may have made likely voter models harder to get right given the departure from historical norm. Another problem with likely voter models is that they can produce artificial swings in estimates of the electorate because changing levels of enthusiasm affects the classification of voter and non-voters (Erikson, Panagopoulos, and Wlezien 2004). Given the problems associated with likely voter models, it might be tempting to disregard them entirely, but that tends to further exacerbate polling mistakes in low-turnout elections (Desart and Holbrook 2003).
In elections with high turnout, there is less need for pollsters to rely on likely voter models because most people who are polled also vote. Of course, elections that have, say, an 85 percent turnout may also be highly biased if the non-voters strongly and systematically favour a specific party or candidate. In practice, however, we expect that such biases are less common.
A related proposition is the law of dispersion, which states that the higher the turnout, the more dispersed electoral participation is for different groups (Tingsten 1937; Persson, Solevid, and Öhrvall 2013). If electoral participation is more equal across societal groups, it follows that likely voter models are less needed to compensate for such imbalances.
To the extent that the effect of turnout on polling accuracy has been studied before, prior research has relied on data from single countries. Using Portuguese data, Magalhaes (2005) finds that the low turnout European Parliamentary elections are more difficult to predict than the high turnout national election. While this finding is consistent with our prediction, it is difficult to rule out the possibility that European Parliamentary elections are harder to poll for other reasons. For example, these are generally considered second order, low salience elections (Vreese et al. 2006; Hix and Marsh 2011; Hobolt and Wittrock 2011). Similarly, the findings by Crespi (1988) suggest that polls conducted before U.S. elections are more accurate when turnout is higher. However, it appears that this effect can also be driven by differences in election type. Low-turnout primary elections have lower accuracy than high-turnout general elections. Therefore, given the strong relationship between primary elections and low turnout in his data, it is difficult to know the degree to which they separately influence accuracy.
Hypothesis 1: Higher levels of voter turnout reduce polling error on average.
Electoral change
Electoral volatility — change in party support from election to election — is a central concept in research on party systems and may have an effect on polling accuracy. In the 1960s, Lipset and Rokkan (1967) published their influential thesis that the party systems of the time reflect cleavage structures that froze in place in the 1920s. However, there has been an intense discussion among scholars on the empirical support for the frozen party system thesis. Siding with Lipset and Rokkan, one perspective maintains that party systems are largely stable. While new parties arise and support for traditional parties fluctuates, there is remarkable stability in party support over time, according to this view (Mair 1997). In contrast, other researchers argue that traditional forces, such as class, party identification, or ideology, which are associated with stability, have weakened over time (Franklin, Mackie, and Valen 1992; Brug 2010). Overall, the perspective that argues for increasing electoral volatility seems to have more supporters (for example Pedersen 1979; Dalton, McAllister, and Wattenberg 2002; Drummond 2006), and even proponents of the opposing perspective acknowledge that volatility often describes current party systems (Mair 2008).
Electoral volatility is presumably also relevant in polling accuracy. When there is an unusual level of change in party support, it suggests that something important has happened in a society. It may be economic problems, scandals, or other events that shift the status quo. Which such changes, polling also becomes challenging because it is uncertain whether the normal polling procedures are still valid. The standard advice in all forecasting, sometimes described as the Golden Rule is to be conservative (Armstrong, Green, and Graefe 2015). However, when something suggests that the polling environment really has changed, as a comparison between the results from the previous election and polls before the new election indicate, it is presumably tempting to change polling practices. After all, a large polling error could mean a damaged reputation for individual pollsters and consequently less future revenue. Pollsters face a difficult choice; either they rely on their usual polling practices even though societal changes suggest that they will produce erroneous estimates, or they can alter their practices. The latter option is fraught with problems. Since pollsters have little experience with this new situation, it is difficult to know which polling techniques that need to be adjusted (for example, sampling, weighting, or mode) and how much. In the face of such difficulties, it may be tempting to follow the lead of other polls, a phenomenon known as herding, which generally leads to inferior polling overall (Silver 2014; Enten 2014). Moreover, there is a risk that a large degree of electoral volatility triggers an overreaction. For example, if Party A won 60% of the vote last election, but pollsters see that they are polling around 30% of the vote in the polls, pollsters may worry that their sampling methods are off and adjust their sampling technique rather than accept that Party A’s support is really around 30%.
Hypothesis 2: Larger changes in electoral results increase polling error on average.
Vote buying
Vote buying, “the payment by political parties of minor benefits (food, clothing, cash) to citizens in exchange for their votes,” (Brusco, Nazareno, and Stokes 2004) is extensive in many areas of the world, yet its prevalence within countries varies across different social groups (for example Brusco, Nazareno, and Stokes 2004; Bratton 2008). It is usually associated with negative consequences. For example, it makes it harder to hold politicians accountable and reduces the likelihood of good policymaking. Consequently, when citizens receive favours, gifts or money in compensation for their vote, it hinders economic development and reduces the quality of government (Schaffer 2006). Many hoped that the secret ballot would end (or at least lessen) vote buying, as it is impossible to check whether the seller actually voted for the buyer; however, vote buying continues (Nichter 2008; Lawson and Greene 2014).
Vote buying may also affect average polling error. The intuition is straightforward. If vote buying is low or non-existent, then people’s responses to pollsters’ questions about their favoured candidate should accurately reflect their intention to vote. On the other hand, if there is rampant vote buying, then people may respond that their favoured candidate is candidate X but then associates of candidate Y buy their vote. This creates discrepancy between who people vote for and their actual political preferences.
Since few people openly want to admit that someone bought their vote, it can be challenging to assess the prevalence of vote buying. Fortunately, experimental methods such as list experiments can be used to address possible social desirability bias on this issue. They show that vote buying and attempts at buying votes is extensive in Nicaragua (Gonzalez-Ocantos et al. 2011), Mexico (Mizuno 2012) and Lebanon (Corstange 2012). For instance, 24 percent of respondents in Nicaragua report that they have been offered compensation for their vote, though only two percent admit this openly in direct questioning. Another method to gauge the commonness of vote buying is to rely on expert judgments. After an extensive data collection effort on this issue, the Varieties of Democracy project shows that there is marked variation between elections and countries in the frequency of vote buying (Coppedge et al. 2017).
Hypothesis 3: Increased levels of vote buying increase polling error on average.
Data and measurement
To examine these propositions, we rely on a dataset gathered by Jennings and Wlezien (2016). Their impressive data collection effort means our analysis rests on a corpus of over 26,000 polls over 71 years starting in 1942 across 44 countries. This covers 312 discrete electoral cycles. Whereas they are interested in analyzing the predictive power of the polls over the course of the election (see also Wlezien and Erikson 2002; Jennings and Wlezien 2016; Wlezien, Jennings, and Erikson 2017), we focus on the performance of the polls at the end of the campaign — election day. We choose to focus on polling accuracy on election day for a few reasons. One concern is that several of our independent variables (voter turnout and electoral change) are determined on election day, making it unclear how to best measure the impact of these. It seems unclear how future electoral change could impact current polling accuracy, for example. This is less problematic if we look only a few days before the election, but could become much more problematic the further out we look. Therefore, we exclude observations coming before election day. To be clear — we are not analyzing the predictive power of the polls over the course of the election; we are simply interested in the difference between what the polls indicated would happen on election day versus the actual election outcome.
Our measure of average polling error in an election is constructed by taking the mean of the absolute value of the difference between the prediction of the polls on election day and the actual vote outcome for each party. The prediction of the polls is taken to be each party’s support measured by vote intention questions. When vote intention polls are missing on the final day of the election cycle, numbers are carried forward from the final poll. See Jennings and Wlezien (2016, page 222–224) for more information. In other words, if an election has three parties competing and the polls, on average, predict that party A will get 40 percent of the vote, party B will get 35 percent, and party C will get 25 percent, but they actually receive 50, 30, and 20 percent respectively, then our measure of polling accuracy would be 13 (|40 − 50| + |35 − 30| + |25 − 20|) ≈ 6.67. Thus, we have one observation for each country-election. Descriptive statistics of this measure and the main variables we examine are shown in Table 1. The mean is 2.62. This means that on average, the polls get a party’s vote share incorrect by about 2.62 percentage points the day of the election. The average absolute error measure that we rely on to form the dependent variable is straightforward to calculate and interpret. It is not without potential problems, however, and other measures have been proposed. For a discussion on different polling accuracy measures, and their advantages and disadvantages, see Mosteller (1949), Martin, Traugott and Kennedy (2005), and Arzheimer and Evans (2014). (Thus far, there is no conclusive evidence that the more advanced measures change the substantive results in applied research on polling accuracy, but more research is needed in this area.)
Since we know that polls generally predict the outcome fairly well on election day, one worry is that there is relatively little left to explain. It could be the case, for example, that nearly all of the variation in polling error is due to time (as polling may have improved over the years, for example) or place (if polling in one country is simply better on average than others) or both. This, however, does not seem to be the case. An analysis of variance due to years and countries suggests that about 26.2 percent of the variance is attributable to variation across years, 36.3 percent to country-level variation, and 58.1 percent of the variance is explained by country and year together. Therefore, while time and place account for quite a bit of variation in polling accuracy, there is still substantial variation even after that. It is this variation we seek to understand.
Electoral change is calculated as the mean of the absolute value of the difference between a party’s share of the vote in the most recent election minus its share in the previous election. We take the mean of that value for all parties in an election. In calculating this average, we drop parties that competed in the previous election but not in the current or did not compete in the previous election but are in the current. Results are similar if we treat those values as a zero instead of missing data. Thus, a value of one means that the average party gained or lost one percentage point support from the previous election. Higher values indicate that parties gained or lost quite a bit of support. The lower bound (zero) would mean that parties’ vote share did not change at all from the previous election (a value that we do not actually observe in the data).
We merged the Jennings and Wlezien (2016) data with information from the Varieties of Democracy project (Coppedge et al. 2017) for information on the amount of vote buying. The vote buying variable is meant to capture the amount of vote or turnout buying in national elections according to a survey of experts. Specifically, the experts answer the following question: “In this national election, was there evidence of vote and/or turnout buying?” They rate each election on a categorical zero to four scale, which is converted to a continuous measure by V-Dem’s measurement model. The variable has been recoded from the original data so that higher numbers indicate more vote buying and lower numbers indicate less.
Figure 1 plots the four variables over time (recall that descriptive statistics are also available in Table 1). Each observation is represented by a dot with lines connecting observations from the same country. Due to the number of observations, particularly in more recent years, there is considerable overplotting which makes it difficult to see all the observations. To rectify this somewhat, we plot a smoothed average of the variables over time with the solid black line. We also include a rug plot on the left side of each pane that shows the distribution of each variable unconditional on time.
We can see that average polling error has remained relatively stable over time. Pessimistically, this could mean that pollsters are not improving over time. Alternatively, pollsters could be improving over time but adding more countries in more recent years increases the mean error. That is ultimately a testable proposition, but one that is probably unfruitful with the available data given the relatively short time series for most countries.
Figure 1 shows that vote buying does not vary dramatically within country over time (note how the coloured lines — one representing each country — tend to be flat). The remaining variables, however, do vary substantially both within country over time and within time across countries. Which of these variables is most predictive of polling errors, though?

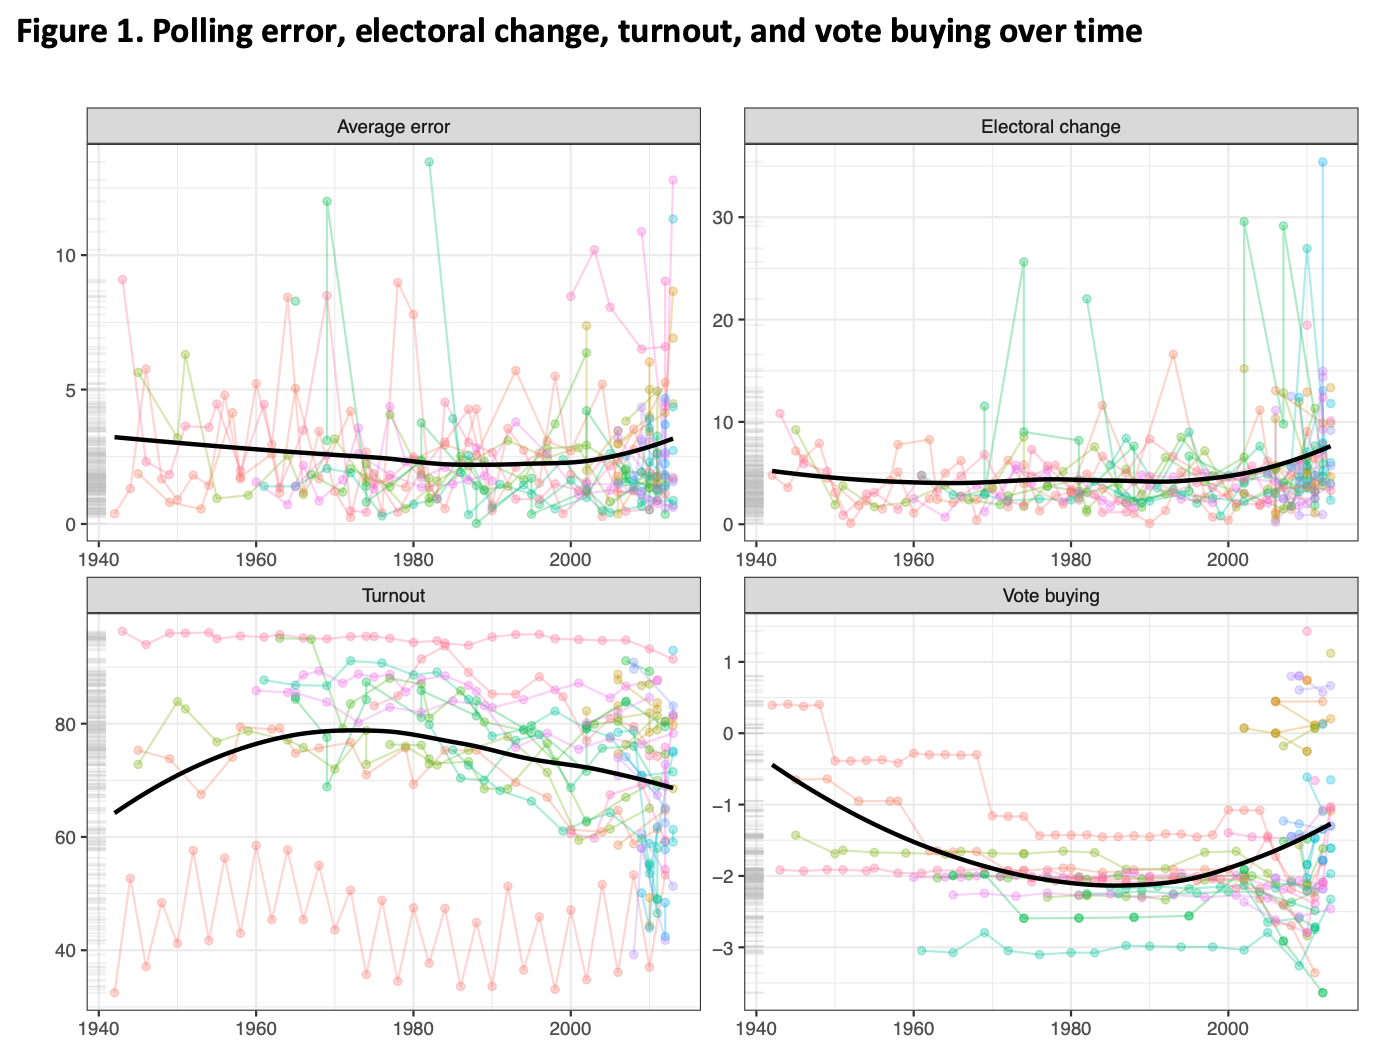
Notes: Black lines plot a smoothed average of the variables by year over time. Faded, colored lines plot all the observations with one line per country. Grey lines on the side are a rug plot of the variables unconditional on year.
Analysis
We present results from three bivariate regressions — including each variable separately — and two regressions when we include all three variables at once, one without country fixed effects and one with. Since the dependent variable is continuous and the distribution is not too grouped together around one or a few points, we use OLS to estimate the five models. Table 2 shows a summary of the regression models. Models 1 through 3 represent bivariate regressions. Model 4 shows results including our three variables of interest all together, and Model 5 includes the three variables as well as country fixed effects, which allows the mean level of polling error to vary across countries.
There is no evidence that voter turnout is related to polling error. Without controlling for other variables, the average effect of a one percentage point increase in turnout is to change average error by just -0.01 points, a relationship that is not statistically significant. Once we control for other variables (see Models 4 and 5 from Table 2), the estimated coefficient is still not statistically significant. Therefore, we find no support for Hypothesis 1.
Electoral volatility makes a large difference to average polling error and is statistically reliable across various modelling strategies, yielding support for Hypothesis 2. Larger swings from the previous election are associated with larger errors in the polls on election day. This accounts for about 5 percent of the variance by itself. An average swing of one percentage point results in a change of 0.1 increase in polling error, on average.
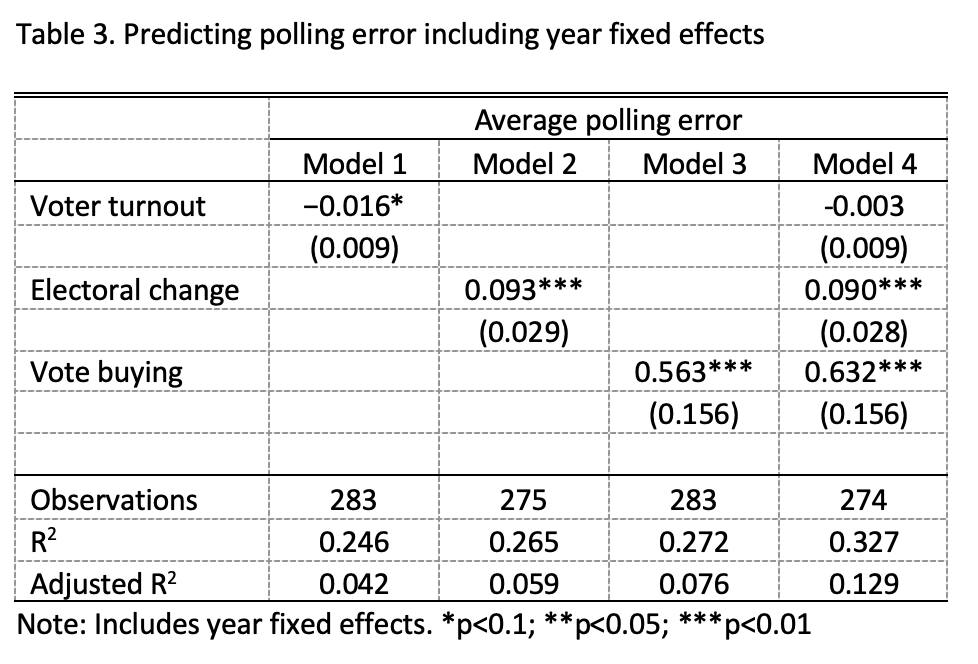
With regard to vote buying, we find mixed evidence. The bivariate model (Model 3) shows that as vote buying increases, polling error increases on average. This effect is statistically significant at conventional significance levels and remains so when we control for the other two variables of interest or add fixed effects for years (see Table 3). However, we caution against over-interpretation of this result. Adding fixed effects for country (Model 5) produces an estimate closer to zero and not statistically significant. Since vote buying is slow-moving within countries (see Figure 1), our model has a difficult time distinguishing between the effect of vote buying when including country fixed effects. Therefore, we conclude that there is some evidence that increases in vote buying tend to result in increases in polling error – favoring Hypothesis 3 – but more work needs to be done to say for certain.
Of course, while it is interesting to note whether one variable affects polling error, we also care about the size of the effect. Although Table 2 can give us some indication, since the scale of the variables differ it is difficult to see which variable (or variables) have a substantially large effect on polling error. For this reason, we present the predicted change in polling error from a one standard deviation increase in each of the independent variables in Figure 2. On the left side, we present effect sizes from models 1 through 3 where we model the bivariate relationship. The right side shows effect sizes from model 4 where we include all three variables in a single regression.
From Figure 2, we can see that all variables have similar effect magnitudes, with the exception of turnout, which does not appear to predict polling error. A one standard deviation increase in any of the variables changes the predicted polling error by about half a percentage point. This may seem like a trivial difference, but in the context of close elections, a change in polling error of 0.4 is a substantially meaningful difference — many elections have been decided by a tighter margin of victory than that. Thus, two of the three variables appear to have consequential effects if we move a single standard deviation. For a a more extensive discussion on effect sizes, see This means that pollsters should keep in mind the context of the election that they are polling; highly volatile elections in places with high levels of vote buying will be particularly difficult to poll accurately. On the other hand, societies with minimal vote buying and small shifts in electoral fortunes should be relatively easy to accurately poll.
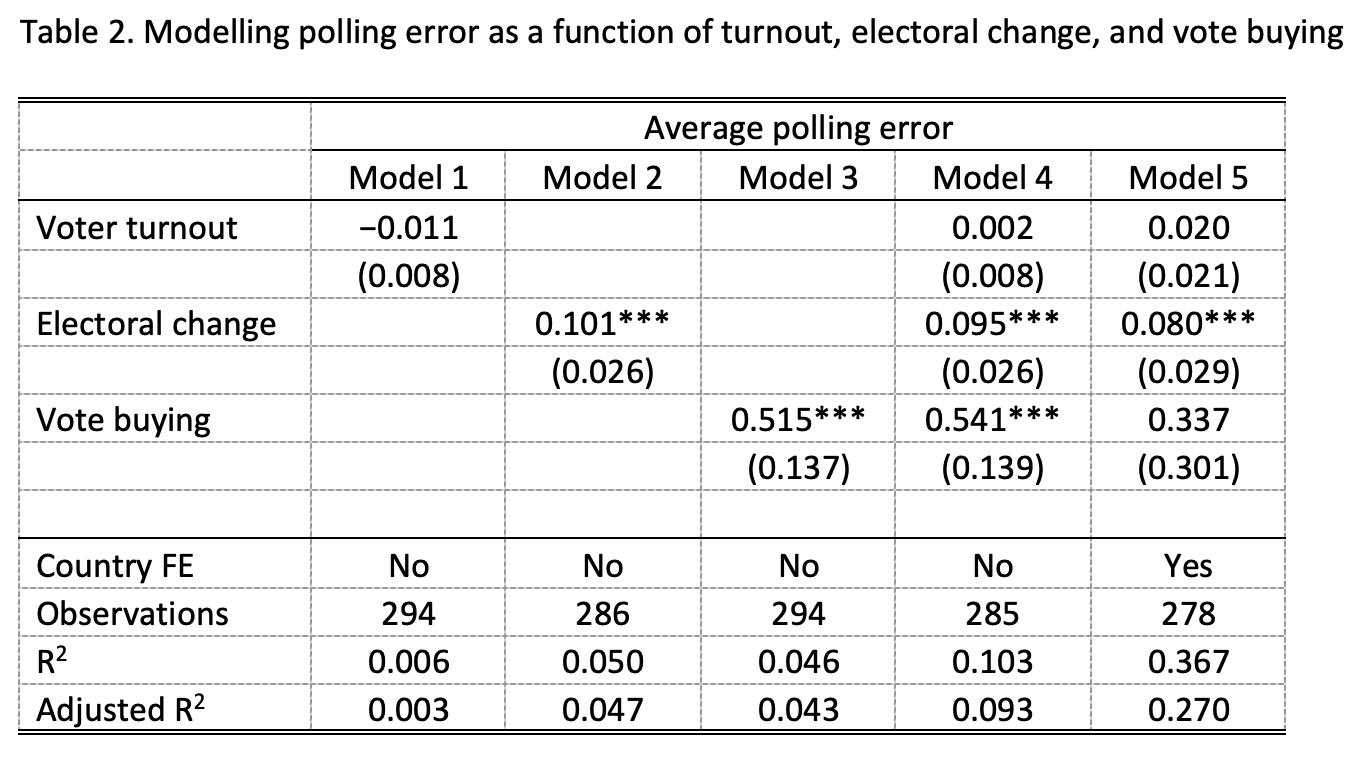
Note: Models 1-3 are results from bivariate regression. Model 4 includes all three independent variables in a single regression. Model 5 includes country fixed effects. The significant results of our two-sided calculations were all in the right direction and, therefore, with respect to our one-sided research hypotheses significant at the 5 percent significance level. *p<0.1; **p<0.05; ***p<0.01
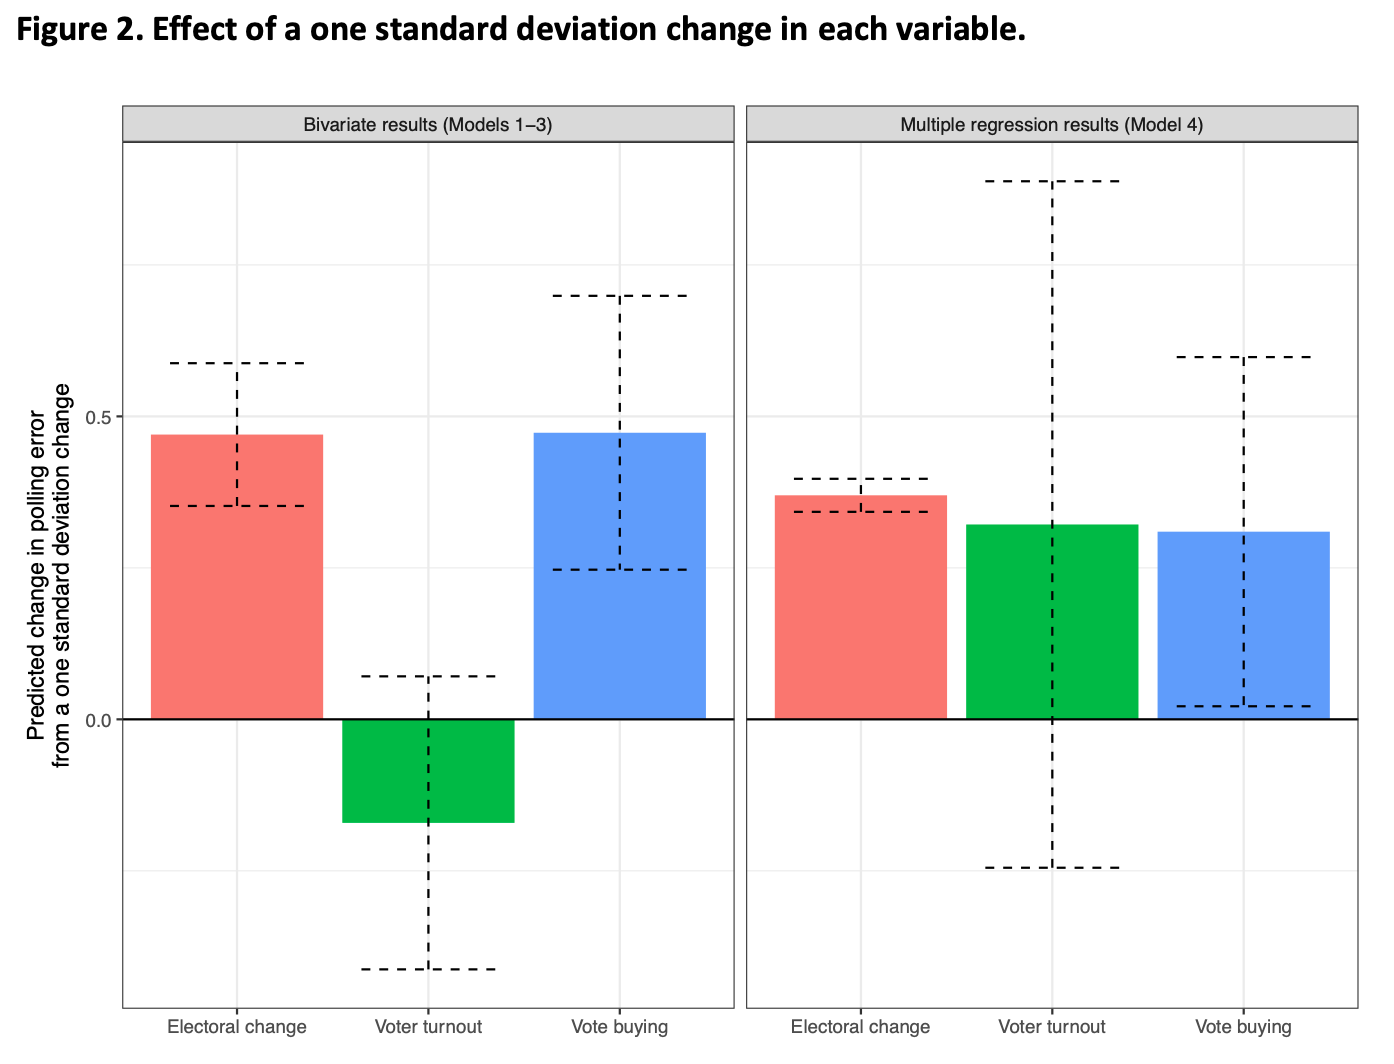
Note: The left panel reports estimates from three bivariate models (Models 1–3 in Table 2). The right panel reports estimates from a single regression model (Model 4 in Table 2). Dashed lines represent 95% confidence intervals.
Conclusion and discussion
The polling industry is rapidly changing in response to various challenges. For example, declining survey participation rates and rising costs have forced organizations to try new methods of contacting people and new survey modes. However, even with these innovations, polls are always at least a little wrong on election day, and sometimes they are off by an embarrassing amount. With so much at stake for both pollsters and academics, it is no wonder that a large number of studies have examined variation in polling accuracy. These studies have greatly improved our understanding of factors that increase or decrease accuracy. However, we still know relatively little about the effects of election-specific variables.
In this paper, we began to address the possibility that not all elections are equally easy to predict by looking at election-specific variables. We found support for the notion that elections conducted around large changes in party support are particularly difficult to poll. Party scholars have documented an increase in electoral volatility, in particular after the turn of the new millennium, which is due in part to the replacement of more long-term and stable forces like party identification with short-term economic evaluations (Kayser and Wlezien 2011; Dassonneville and Hooghe 2015). The increase in electoral change is obviously not behind all polling mistakes, yet it is possible that the polling industry is getting its reputation hurt by a factor beyond its control.
Normative arguments against vote buying are quite strong; many believe that it corrupts the democratic process. From a more empirical perspective, it also appears to increase polling error. This implies that pollsters should not assume that knowledge gained from decades of polling in places that have little vote buying applies equally well in contexts where vote buying is more prevalent.
In contrast to a popular narrative, voter turnout does not seem to be systematically associated with increased (or decreased) polling error. Of course, absence of evidence of an effect is not the same as evidence of absence of an effect. Frequentist statistics lacks a straightforward way to test whether the null hypothesis is true. However, given the relatively large number of observations in our sample, the absence of serious measurement problems for turnout and polling error, and the fact that the coefficients are quite close to zero, we conclude that turnout is unrelated to polling bias. Perhaps pollsters in low-turnout elections are better at compensating for the lower levels by, for example, relying on likely voter models.
We have already hinted that several actors can benefit from our results. For instance, when pre-election polls suggest that party support has changed substantially compared to the last election, pollsters would do well to inform its audience that predictions are particularly uncertain. Moreover, election post-mortems should vary in harshness depending on electoral change. Lastly, individuals who construct forecasting models would be advised to change their levels of uncertainty depending on fluctuation in party support between elections. That is, the point estimates of support based on poll aggregates need to be accompanied by larger uncertainty if there has been high electoral volatility. This can be accomplished by forgoing the assumption of a normal distribution and instead, for example, rely on the fatter tails of a t-distribution with few degrees of freedom, which makes what might seem an otherwise highly unlikely event more plausible. Likewise, pollsters, commentators, and forecasters should take into account the prevalence of vote buying. Knowing these levels determines whether the polling environment is easy or hard.
Appendix
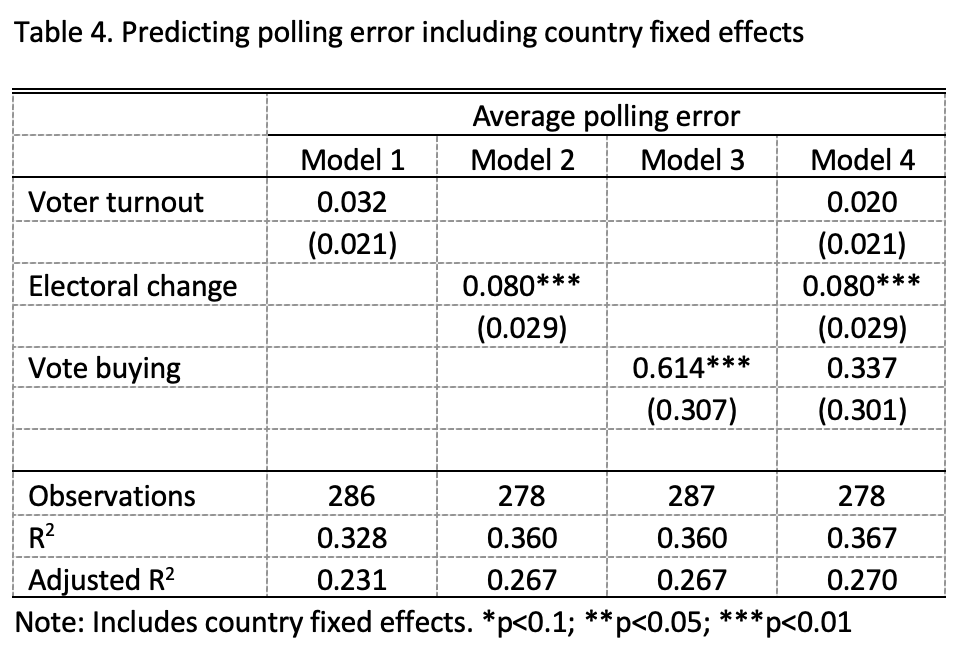
Fixed effects
Here we report results when we include year fixed effects (Table 3) and country fixed effects (Table 4). Because several observations only had one year or one country in the data, we are forced to drop these, so these estimates rely on a slightly reduced dataset. As noted in the text, most of the results are similar if we exclude fixed effects. One result that changes is that when we include country fixed effects, the effect of vote buying is estimated much closer to zero and is no longer statistically significant. This is likely due to the fact that this variable does not change much over time within country.
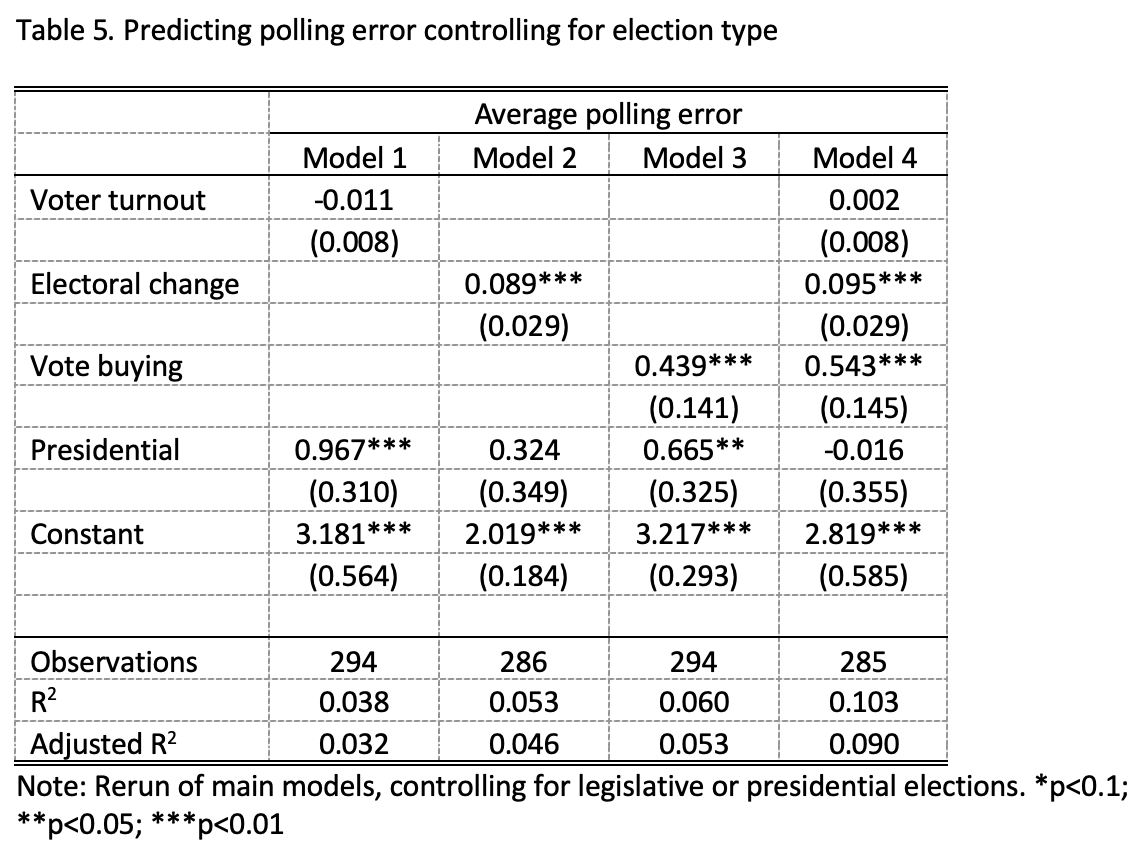
Type of election
Here we control for whether the election is a legislative or presidential election, as Jennings and Wlezien (2016) find that this matters for poll accuracy. Note that there are only a small number of presidential elections in the dataset; just 39 in total.
References
- Ansolabehere, Stephen, and Brian Schaffner. 2014. “Does Survey Mode Still Matter? Findings From a 2010 Multi-Mode Comparison.” Political Analysis 22 (03): 285–303. doi:10.1093/pan/mpt025. https://doi.org/10.1093/pan/mpt025.
- Armstrong, J. Scott, Kesten Green, and Andreas Graefe. 2015. “Golden Rule of Forecasting: Be Conservative.” Journal of Business Research 68 (8): 1717–1731. doi:10.1016/ j.jbusres.2015.03.031. https://doi.org/10.1016/j.jbusres.2015.03.031.
- Arzheimer, Kai, and Jocelyn Evans. 2014. “A New Multinomial Accuracy Measure for Polling Bias.” Political Analysis 22 (01): 31–44. doi:10.1093/pan/mpt012. https://doi.org/10.1093/pan/mpt012.
- Bratton, Michael. 2008. “Vote Buying and Violence in Nigerian Election Campaigns.” Electoral Studies 27 (4): 621–632. doi:10.1016/j.electstud.2008.04.013. https://doi.org/10.1016/j.electstud.2008.04.013.
- Brug, Wouter van der. 2010. “Structural and Ideological Voting in Age Cohorts.” West European Politics 33 (3): 586–607. doi:10.1080/01402381003654593. https://doi.org/10.1080/01402381003654593.
- Brusco, Valeria, Marcelo Nazareno, and Susan Carol Stokes. 2004. “Vote Buying in Argentina.” Latin American Research Review 39 (2): 66–88. doi:10.1353/lar. 2004.0022. https://doi.org/10.1353/lar.2004.0022.
- Callegaro, Mario, and Giancarlo Gasperoni. 2008. “Accuracy of Pre-Election Polls for the 2006 Italian Parliamentary Election: Too Close To Call.” International Journal of Public Opinion Research 20 (2): 148–170. doi:10.1093/ijpor/edn015. https://doi.org/10.1093/ijpor/edn015.
- Cantú, Francisco, Verónica Hoyo, and Marco A. Morales. 2015. “The Utility of Unpacking Survey Bias in Multiparty Elections: Mexican Polling Firms in the 2006 and 2012 Presidential Elections.” International Journal of Public Opinion Research 28 (1): 96–116. doi:10.1093/ijpor/edv004. https://doi.org/10.1093/ijpor/edv004.
- Coppedge, Michael, John Gerring, Staffan Lindberg, Svend-Erik Skaaning, Jan Teorell, David Altman, Michael Bernhard, et al. 2017. V-Dem Dataset v7.0.
- Cornesse, Carina, Annelies G. Blom, David Dutwin, Jon A. Krosnick, Edith D. De Leeuw, Stéphane Legleye, Josh Pasek, Darren Pennay, Benjamin Phillips, Joseph W. Sakshaug, Bella Struminskaya, and Alexander Wenz. 2020. “A Review of Conceptual Approaches and Empirical Evidence on Probability and Nonprobability Sample Survey Research.” Journal of Survey Statistics and Methodology. doi:10.1093/jssam/smz041
- Corstange, Daniel. 2012. “Vote Trafficking in Lebanon.” International Journal of Middle East Studies 44 (3): 483–505. doi:10.1017/s0020743812000438. https://doi.org/0.1017/s0020743812000438.
- Crespi, Irving. 1988. Pre-election polling: Sources of accuracy and error. Russell Sage Foundation.
- Curtin, Richard, Stanley Presser, and Elanor Singer. 2005. “Changes in Telephone Survey Nonresponse Over the Past Quarter Century.” Public Opinion Quarterly 69 (1): 87–98. doi:10.1093/poq/nfi002. https://doi.org/10.1093/poq/nfi002.
- Dalton, Russell, Ian McAllister, and Martin Wattenberg. 2002. “The Consequences of Partisan Dealignment.” In Parties Without Partisans, 37–62. Parties Without Partisans. Oxford University Press. doi:10.1093/0199253099.003.0003. https://doi.org/10.1093/0199253099.003.0003.
- Dassonneville, Ruth, and Marc Hooghe. 2015. “Economic Indicators and Electoral Volatility: Economic Effects on Electoral Volatility in Western Europe, 1950-2013.” Comparative European Politics. doi:10.1057/cep.2015.3. https://doi.org/10.1057/cep.2015.3.
- Desart, Jay, and Thomas Holbrook. 2003. “Campaigns, Polls, and the States: Assessing the Accuracy of Statewide Presidential Trial-Heat Polls.” Political Research Quarterly 56 (4): 431–439. doi:10.1177/106591290305600405. https://doi.org/10.1177/106591290305600405.
- Drummond, Andrew. 2006. “Electoral Volatility and Party Decline in Western Democracies: 1970-1995.” Political Studies 54 (3): 628–647. doi:10.1111/j.1467-9248.2006. 00617.x. https://doi.org/10.1111/j.1467-9248.2006.00617.x.
- Durand, Claire, André Blais, and Sébastien Vachon. 2001. “Review: A Late Campaign Swing Or a Failure of the Polls? The Case of the 1998 Quebec Election.” Public Opinion Quarterly 65 (1): 108–123.
- Enten, Harry. 2014. “Are Bad Pollsters Copying Good Pollsters.” August. https://fivethirtyeight.com/features/are-bad-pollsters-copying-good-pollsters/.
- Erikson, Robert, Costas Panagopoulos, and Christopher Wlezien. 2004. “Likely (and Unlikely) Voters and the Assessment of Campaign Dynamics.” Public Opinion Quarterly 68 (4): 588–601. doi:10.1093/poq/nfh041. https://doi.org/10.1093/poq/nfh041.
- Franklin, Mark, Thomas Mackie, and Henry Valen. 1992. Electoral change: Responses to Evolving Social and Attitudinal Structures in Western Countries. ECPR Press.
- Gonzalez-Ocantos, Ezequiel, Chad Kiewiet de Jonge, Carlos Meléndez, Javier Osorio, and David Nickerson. 2011. “Vote Buying and Social Desirability Bias: Experimental Evidence From Nicaragua.” American Journal of Political Science 56 (1): 202–217. doi:10.1111/j.1540-5907.2011.00540.x. https://doi.org/10.1111/j.1540-5907.2011.00540.x.
- Groves, Robert, and Emilia Peytcheva. 2008. “The Impact of Nonresponse Rates on Nonresponse Bias: A Meta-Analysis.” Public Opinion Quarterly 72 (2): 167–189. doi:10.1093/poq/nfn011. https://doi.org/10.1093/poq/nfn011.
- Hennessy, Bernard, and Erna Hennessy. 1961. “The Prediction of Close Elections: Comments on Some 1960 Polls.” Public Opinion Quarterly 25 (3): 405–411.
- Hillygus, D. Sunshine. 2011. “The Evolution of Election Polling in the United States.” Public Opinion Quarterly 75 (5): 962–981. doi:10.1093/poq/nfr054. https://doi.org/10.1093/poq/nfr054.
- Hix, Simon, and Michael Marsh. 2011. “Second-Order Effects Plus Pan-European Political Swings: An Analysis of European Parliament Elections Across Time.” Electoral Studies 30 (1): 4–15. doi:10.1016/j.electstud.2010.09.017. https://doi.org/10.1016/j.electstud.2010.09.017.
- Hobolt, Sara Binzer, and Jill Wittrock. 2011. “The Second-Order Election Model Revisited: An Experimental Test of Vote Choices in European Parliament Elections.” Electoral Studies 30 (1): 29–40. doi:10.1016/j.electstud.2010.09.020. https: //doi.org/10.1016/j.electstud.2010.09.020.
- Jennings, Will, and Christopher Wlezien. 2016. “The Timeline of Elections: A Comparative Perspective.” American Journal of Political Science 60 (1): 219–233. doi:10.1111/ ajps.12189. http://dx.doi.org/10.1111/ajps.12189.
- Jowell, Roger, Barry Hedges, Peter Lynn, Graham Farrant, and Anthony Heath. 1993. “Review: The 1992 British Election: The Failure of the Polls.” Public Opinion Quarterly 57 (2): 238. doi:10.1086/269369. https://doi.org/10.1086/269369.
- Kayser, Mark Andreas, and Christopher Wlezien. 2011. “Performance Pressure: Patterns of Partisanship and the Economic Vote.” European Journal of Political Research 50 (3): 365–394. doi:10.1111/j.1475-6765.2010.01934.x. https://doi.org/10.1111/j.1475-6765.2010.01934.x.
- Keeter, Scott, Courtney Kennedy, Michael Dimock, Jonathan Best, and Peyton Craighill. 2006. “Gauging the Impact of Growing Nonresponse on Estimates From a National Rdd Telephone Survey.” Public Opinion Quarterly 70 (5): 759–779. doi:10.1093/ poq/nfl035. https://doi.org/10.1093/poq/nfl035.
- Kennedy, Courtney, Mark Blumenthal, Scott Clement, Joshua Clinton, Claire Durand, Charles Franklin, Kyley McGeeney, et al. 2017. An Evaluation of 2016 Election Polls in the United States. Technical report. American Association of Public Opinion Research.
- Kohut, Andrew, Scott Keeter, Carroll Doherty, Michael Dimock, and Leah Christian. 2012. Assessing the Representativeness of Public Opinion Surveys. Technical report. Washington DC: Pew Research Center.
- Lau, Richard. 1994. “An Analysis of the Accuracy of “Trial Heat” Polls During the 1992 Presidential Election.” Public Opinion Quarterly 58 (1): 2–20. doi:10.1086/269405. https://doi.org/10.1086/269405.
- Lawson, Chappell, and Kenneth Greene. 2014. “Making Clientelism Work: How Norms of Reciprocity Increase Voter Compliance.” Comparative Politics 47 (1): 61–85. doi:10.5129/001041514813623173. https://doi.org/10.5129/001041514813623173.
- Lipset, Seymour Martin, and Stein Rokkan. 1967. “Cleavage Structures, Party Systems And Voter Alignments: An Introduction.” In Party Systems and Voter Alignments: Cross-National Perspectives, edited by Seymour Martin Lipset and Stein Rokkan. Free Press.
- Magalhaes, Pedro. 2005. “Pre-Election Polls in Portugal: Accuracy, Bias, and Sources of Error, 1991-2004.” International Journal of Public Opinion Research 17 (4): 399–421. doi:10.1093/ijpor/edh078. https://doi.org/10.1093/ijpor/edh078.
- Mair, Peter. 1997. Party System Change: Approaches and Interpretations. Oxford University Press.
- Mair, Peter. 2008. “The Challenge To Party Government.” West European Politics 31 (1-2): 211–234. doi:10.1080/01402380701835033. https://doi.org/10.1080/01402380701835033.
- Martin, Elizabeth, Michael Traugott and Courtney Kennedy. 2005. “A Review and Proposal for a New Measure of Poll Accuracy.” Public Opinion Quarterly 69 (3): 342–369. doi:10.1093/poq/ nfi044. https://doi.org/10.1093/poq/nfi044.
- Meng, Xiao-Li. 2018. “Statistical paradises and paradoxes in big data (I): Law of large populations, big data paradox, and the 2016 US presidential election.” Annals of Applied Statistics 12 (2): 685–726. doi:10.1214/18-AOAS1161SF.
- Mitofsky, Warren. 1998. “Review: Was 1996 a Worse Year for Polls Than 1948?” Public Opinion Quarterly 62 (2): 230. doi:10.1086/297842. https://doi.org/10.1086/297842.
- Mizuno, Elda Lorena Becerra. 2012. “Does Everyone Have a Price? The Demand Side of Clientelism and Vote-Buying in an Emerging Democracy.” PhD diss., Duke University.
- Mosteller, Frederick, and Leonard William Doob. 1949. The Pre-Election Polls of 1948. Social Science Research Council.
- Mosteller, F. 1949. “Measuring the Error.” In The Pre-election Polls of 1948, (eds) F. Mosteller, H. Hyman, P. J. McCarthy, E. S. Marks, and D. B. Truman, 54–80. New York, Social Science Research Council.
- Nichter, Simeon. 2008. “Vote Buying Or Turnout Buying? Machine Politics and the Secret Ballot.” American Political Science Review 102 (01): 19–31. doi:10.1017/ s0003055408080106. https://doi.org/10.1017/s0003055408080106.
- Panagopoulos, Costas. 2009. “Polls and Elections: Preelection Poll Accuracy in the 2008 General Elections.” Presidential Studies Quarterly 39 (4): 896–907. doi:10. 1111/j.1741-5705.2009.03713.x. https://doi.org/10.1111/j.1741-5705.2009.03713.x.
- Pedersen, Mogens. 1979. “The Dynamics of European Party Systems: Changing Patterns of Electoral Volatility.” European Journal of Political Research 7 (1): 1–26. doi:10.1111/j.1475-6765.1979.tb01267.x. https://doi.org/10.1111/j.1475-6765.1979.tb01267.x.
- Persson, Mikael, Maria Solevid, and Richard Öhrvall. 2013. “Voter Turnout and Political Equality: Testing the ’law of Dispersion’ in a Swedish Natural Experiment.” Politics 33 (3): 172–184. doi:10.1111/1467-9256.12012. https://doi.org/10.1111/1467-9256.12012.
- Philpot, Tasha, Daron Shaw, and Ernest McGowen. 2009. “Winning the Race: Black Voter Turnout in the 2008 Presidential Election.” Public Opinion Quarterly 73 (5): 995– 1022. doi:10.1093/poq/nfp083. https://doi.org/10.1093/poq/nfp083.
- Pickup, Mark, J. Scott Matthews, Will Jennings, Robert Ford, and Stephen D. Fisher. 2011. “Why Did the Polls Overestimate Liberal Democrat Support? Sources of Polling Error in the 2010 British General Election.” Journal of Elections, Public Opinion & Parties 21 (2): 179–209. doi:10.1080/17457289.2011.563309. https://doi.org/10.1080/17457289.2011.563309.
- Schaffer, Frederic Charles. 2006. Elections For Sale : The Causes and Consequences of Vote Buying. Rienner. isbn: 978-1-58826-434-3. http://www.worldcat.org/oclc/218961847.
- Shamir, Jacob. 1986. “Preelection Polls in Israel: Structural Constraints on Accuracy.” Public Opinion Quarterly 50 (1): 62. doi:10.1086/268959. https://doi.org/10.1086/268959.
- Silver, Nate. 2014. “Here’s Proof Some Pollsters Are Putting a Thumb on the Scale.” November. https://fivethirtyeight.com/features/heres-proof-some-pollsters-are-putting-a-thumb-on-the-scale/.
- Sohlberg, Jacob, Mikael Gilljam, and Johan Martinsson. 2017. “Determinants of Polling Accuracy: the Effect of Opt-In Internet Surveys.” Journal of Elections, Public Opinion and Parties. doi:10.1080/17457289.2017.1300588. https://doi.org/10.1080/17457289.2017.1300588.
- Sturgis, Patrick, Nick Baker, Mario Callegaro, Stephen Fisher, Jane Green, Will Jennings, Jouni Kuha, Ben Lauderdale, and Patten Smith. 2016. Report of Inquiry into the 2015 British General Election Opinion Polls. Technical report. Market Research Society and British Polling Council.
- Tingsten, Herbert. 1937. Political behavior: Studies in election statistics. 7. PS King.
- Traugott, Michael. 2001. “Assessing Poll Performance in the 2000 Campaign.” Public Opinion Quarterly 65 (3): 389–419. doi:10.1086/322850. https://doi.org/10.1086/322850.
- Traugott, Michael. 2005. “The Accuracy of the National Preelection Polls in the 2004 Presidential Election.” Public Opinion Quarterly 69 (5): 642–654. doi:10.1093/poq/nfi061. https://doi.org/10.1093/poq/nfi061.
- Vreese, Claes de, Susan Banducci, Holli Semetko, and Hajo Boomgaarden. 2006. “The News Coverage of the 2004 European Parliamentary Election Campaign in 25 Countries.” European Union Politics 7 (4): 477–504. doi:10.1177/146511650606 9440. https://doi.org/10.1177/1465116506069440.
- Wang, Wei, David Rothschild, Sharad Goel, and Andrew Gelman. 2015. “Forecasting Elections With Non-Representative Polls.” International Journal of Forecasting 31 (3): 980–991. doi:10.1016/j.ijforecast.2014.06.001. https://doi.org/10.1016/j.ijforecast.2014.06.001.
- Wlezien, Christopher, and Robert Erikson. 2002. “The Timeline of Presidential Election Campaigns.” Journal of Politics 64 (4): 969–993. doi:10.1111/1468-2508.00159. http://dx.doi.org/10.1111/1468-2508.00159.
- Wlezien, Christopher, Will Jennings, and Robert Erikson. 2017. “The “Timeline” Method of Studying Electoral Dynamics.” Electoral Studies. doi:10.1016/j.electstud. 2017.03.003. https://doi.org/10.1016/j.electstud.2017.03.003.
-
Keywords
calibration CATI coverage coverage bias cross-national surveys data linkage data quality European Social Survey experiment face-to-face face-to-face survey Facebook hard to reach populations incentives item nonresponse measurement measurement error mixed-mode surveys multitasking non-probability samples Nonresponse nonresponse bias nonresponse rates paradata PIAAC Probability sample probability samples QR codes rare populations response rate Satisficing social desirability Social media survey survey-taking climate survey data survey management survey methods Telephone survey telephone surveys total survey error unit nonresponse validity web survey Web surveys weighting
