

Shaking hands in a busy waiting room. The effects of the surveyor’s introduction and people present in the waiting room on the response rate
Ongena,Y. P., Haan, M., Kwee, T.C. & Yakar, D. (2021). Shaking hands in a busy waiting room. The effects of the surveyor’s introduction and people present in the waiting room on the response rate. Survey Methods: Insights from the Field. Retrieved from https://surveyinsights.org/?p=14494
© the authors 2021. This work is licensed under a Creative Commons Attribution 4.0 International License (CC BY 4.0) 
Abstract
Although waiting room surveys are frequently conducted, methodological studies on this topic are scarce. Behaviour of surveyors in waiting rooms can easily be controlled, and these surveys also allow for collection of paradata; relevant information on the circumstances of a request to participate in survey research. In this paper, we present the results of an experiment systematically manipulating surveyor’s handshakes and verbal introduction of their names. Patients scheduled for radiological examinations were approached to take part in a survey. An observer noted circumstances in the waiting room (CT or MRI) such as the number of people present. In the CT waiting room, willingness to participate was higher when no other people were filling out the survey than when there were other people filling out the survey. Thus, scarcity effects seemed to play a major role in the decision to participate. In addition, a patient waiting alone was more likely to fully complete the questionnaire, than patients accompanied by one or more caregivers. There was no effect of the surveyor’s handshake or verbal name introduction on survey participation, which is a fortunate outcome in light of social distances measures fighting COVID-19.
Keywords
intercept surveys, persuasion strategies, unit nonresponse, waiting room surveys
Acknowledgement
The authors would like to thank Anke Bleeker, Sara de Leeuw, Allard de Vries, Coqo Hendriks, Iris Kailola, Marloes Kochi, Frank ter Steege, Jorien Treurniet, Timara van den Hurk, Levi van der Heijden, and Julia van der Zee for their help in collecting the data.
Copyright
© the authors 2021. This work is licensed under a Creative Commons Attribution 4.0 International License (CC BY 4.0)
1. Introduction
Waiting room surveys, i.e., requesting patients waiting for their appointment in the hospital or health care centre to self-complete a questionnaire on health care topics are a practical research tool for studying patients’ attitudes, knowledge, behaviours and other characteristics. From a review of Australian waiting room surveys, it appears that in many studies the methodology is not explained, and specifically, response rates are not always mentioned (Pirotta, Gunn & Harrison, 2002). Guiding literature on waiting room surveys for practitioners is scarce and outdated (Pirotta et al. 2002, Hogg, Johnston, Russel et al., 2010). In this paper, we present the results of an experiment in which contacting behaviour of surveyors was manipulated, and circumstances of the waiting rooms were monitored.
1.1 Background
Conducting survey research in a hospital by approaching patients in waiting rooms can be considered an intermediate form of a public intercept survey (Cowan, 1989) and a drop-off-pick-up survey (DOPU; Trentelman, Irwin. Petersen et al. 2016). A public intercept survey entails selecting a public place such as a shopping mall or a public park, and approaching people who happen to be present. In DOPU surveys, surveyors hand deliver a self-administered paper-and-pencil questionnaire at the sampling members’ homes. Thus, a waiting room survey is similar to a public intercept survey in the sense that people who happen to be present at the selected location and time are approached, and it is similar to a DOPU survey in the sense that a questionnaire is handed over to respondents and picked-up when ready.
Although the kind of convenience sampling methods as used in waiting room surveys have been criticized (Cowan, 1989; Jackson-Smith, Flint, Dolan et al. 2016), when assessing patients’ attitudes towards procedures in hospitals it could be argued that in a waiting room it yields a useful sample. Since this type of survey is conducted in the environment where care is provided, different aspects of the consultation can easily be measured (Hogg et al. 2010). Waiting room surveys usually have high response rates, and when staff is specifically trained there are increased possibilities in verbally persuading reluctant respondents (Dijkstra & Smit 2002, Ongena& Haan 2016), which can increase response rates (Bowling, 2005). However, surveyors may differ in their impact on the representativeness of the achieved sample (e.g., Blom, de Leeuw & Hox 2011, Jäckle, Lynn, Sinibaldi & Tipping 2013, Durrant, Groves, Staetsky & Steele, 2010).
Since the time allotted to complete the survey in a waiting room is usually the time available until the patients are called for their appointment, it makes sense to study both willingness to participate (i.e., the number of approached patients who comply with participation) and completion rate (i.e., the number of approached patients that complete the survey, with a pre-defined minimum number of the questions answered). Unless a waiting room is too crowded for the available surveyors to approach all patients before they are called for their appointment, contact rates are 100 percent. This means that usually in waiting room surveys there is no difference between the response rate and the cooperation rate (AAPOR 2016).
1.2 Influence of people present in the waiting room on participation
When all persons, or at least patients, present in the waiting room are eligible for participation, multiple sample members are usually present at the same time. This can increase response rates, due to social validation; one is more willing to comply with a request when one believes similar others would comply (Groves, Cialdini & Couper, 1992). While generally, the principle of social validation is based on beliefs, in the waiting room patients can actually see others participating. This may on the other hand increase the chances of a limiting factor: when patients see many others participating, they may perceive their contribution as less useful. Additionally, when only patients are eligible for participation, people accompanying patients may distract them when filling out the survey, which can have a negative effect on completion of the survey within the allotted time.
From this literature we derived the following hypotheses:
H1 The number of people present in the waiting room who are already filling out the survey, is associated with the willingness to participate and the completion rate.
H2 The number of people accompanying the respondent is negatively associated with willingness to participate, and even more so with the completion rate.
1.3 Influence of the introduction of the surveyor on participation
In waiting room surveys the surveyor plays a significant role in gaining cooperation. Both non-verbal and verbal behaviours can play a role. Nonverbal techniques such as touching and gazing at potential respondents by surveyors have shown to increase compliance rates in shopping mall intercept surveys, especially in case of female surveyors approaching male respondents (Hornik & Ellis, 1988). In the current study, rather than the more general approach of touching potential respondents, we will focus on handshakes. Handshakes are a common greeting behaviour in Western cultures (Katsumi, Kim, Sung et al., 2017), and have a positive influence on first impressions and interaction in different contexts, including business interactions (Dolcos, Sung, Argo et al. 2012), employment interviews (Stewart, Dustin, Barrick & Darnold, 2008), and negotiations (Schroeder, Risen, Gino & Norton, 2014). However, in the context of surveys, it is not clear whether handshakes will depend on respondent gender and age. In addition, the anonymous nature of surveys does not necessarily fare well with the common habit of introducing each other with names while handshaking.
From this literature we derived the following hypotheses:
H3 Surveyors who give a handshake prior to requesting potential respondents to participate are expected to generate higher willingness rates than surveyors who do not give a handshake.
H4 Surveyors who give a handshake and verbally introduce their name are expected to generate higher willingness rates than surveyors who do not introduce their name with the handshake.
H5 Willingness rates of surveyors who give a handshake are expected to depend on surveyor’s gender and respondent’s gender and age.
2.Data and methods
2.1 Data
The study was performed at the Radiology department of the University Medical Center Groningen, a tertiary care hospital that provides both primary and specialty care to approximately 2.2 million inhabitants in the north-east of the Netherlands. Two waiting rooms were selected for the study. The CT waiting room (with a capacity of 15 seats) and the MRI waiting room (with a capacity of 20 seats). The study was approved by the local institutional review board (IRB number: 201900643), and all patients that completed the survey provided written informed consent.
2.2 Experimental Design
Using a scheme with random order, the students distributed the questionnaires and alternated every three hours in approaching patients in one of three conditions:
– No handshake and introduction without name: The surveyor approached a participant and started the conversation without introducing themselves and without shaking the participant’s hand.
– Handshake, and introduction without name: The surveyor approached the participant and shook the participant’s hand prior to the conversation.
– Handshake and introduction with name: The surveyor approached the participant and shook the participant’s hand, while introducing him or herself by name, prior to the conversation.
2.3 Procedure
Data was collected in November and December 2019 among patients that were scheduled for CT or MRI and were already seated in the waiting area. Only outpatients were included. As per hospital surveying standards, hospitalized patients and emergency patients (those laying in a hospital bed or carrying an IV pole) were not approached to participate. The patients were approached by one of ten (three male and seven female) students in communication sciences of the University of Groningen. As per hospital requirements, staff needs to be clearly identifiable. Therefore, all students were wearing a white coat and an employee badge. All patients who were in the waiting room for CT or MRI were approached, and requested to fill out the questionnaire on their attitude towards the implementation of artificial intelligence in general medicine. The students worked in pairs, where one of them filled out an observation sheet, noting the waiting room (CT or MRI), the date, time, name of surveyor, gender of the approached person, the number of people present in the waiting room, how many of those were busy filling out the survey, and the number of caregivers accompanying the respondent. Prior to the request to participate, a foot-in-the-door (FITD) strategy was used, asking the patient whether today’s visit was their first visit to the radiology department. The FITD technique, based on the idea that willingness to comply with a small request (i.e., answering one question) will increase likelihood of compliance with a large request (i.e., answering a complete survey), can be effective in intercept surveys (Sperry, Siler & Mull, 2018). After the request to participate, both respondents and non-respondents were asked their year of birth, and this was noted on the observation sheet. When respondents were called for their appointment but had not finished filling out the survey, they were asked to continue after their appointment. The average completion time of the questionnaire was 12 minutes.
2.4 Data transformation and analysis
To test the hypotheses, two mixed binary logistic regression models were conducted, taking variance at the surveyor level (based on the name noted on the observation sheet) into account All analyses were conducted in R version 3.6.1. In the analyses we make a distinction between willingness to respond, using AAPOR Response rate 2 (AAPOR 2016), and completion of questionnaires, using AAPOR Response rate 1. While the completed surveys (AAPOR RR1) include complete questionnaires only, the willing responders (AAPOR RR2) also include patients who were willing to fill out the questionnaire but were called for their appointment before completing the full questionnaire. A case was coded as complete when at least 75% of the questions were answered.
For predicting variables, the information from the observation sheet could be used mostly as recorded. Thus, no transformations were used for the waiting room (CT or MRI), gender of the approached person, and whether today’s visit was their first visit to the radiology department. For ease of interpretation, the respondent’s year of birth was transformed to their age. The time of approach, noted down in date, hour and minute, was converted to Unix time stamps (in seconds) and was also converted into a dichotomous variable, i.e., morning (am) or afternoon (pm). The surveyor’s gender was derived from the names noted on the observation sheet.
To test H1, the number of people present in the waiting room who are already filling out the survey was transformed to a dichotomous variable (none filling out or at least one person filling out), because a greater number than two other people filling out was rare to occur (i.e., the cases were one (n=88), two (n=36), three (n=4), four (n=2), five (n=1) and six other respondents (n=1) there were no cases with more than six other respondents). Because of this distribution, and also because of theoretical meaning the pure distinction of having other respondents as an example, this dichotomous variable was deemed more useful. As a result, the first hypothesis was rephrased as: H1 The fact that there are other people present in the waiting room who are already filling out the survey, is associated with the willingness to participate and the completion rate.
In order to test H2, the number of caregivers accompanying the respondent was transformed into three categories (no companions, one companion or two or more companions), because a greater number than two companions was rare to occur (i.e., in only three cases there were three companions, in only one case there were four companions and there were no cases with more than four companions). In addition, the distinction between no companion, one companion and two or more was most meaningful in theoretical sense. As a result, the second hypothesis was rephrased as: H2 The fact that one or two persons are accompanying the respondent is negatively associated with willingness to participate, and even more so with the completion rate.
To test H3, H4, and H5, the treatment as noted on the observation sheet was used. In case the respondent took initiative to shake hands instead of the surveyor, this was noted in the observation sheet, along with the observation of the surveyor mentioning their name, retroactively assigning them in the handshake condition. This means that we performed treatment analysis. An intention-to-treat analysis (ITT, including all patients in the groups that they were originally assigned to, see Gupta 2011, Ranganathan, Pramesh & Aggarwal, 2016) is less preferable since it requires outcome data of all cases. In our study data, we could only infer missing data based on completed questionnaires with no matching observation sheet, thus, solutions like the last observation carried forward method (LOCF, Gupta, 2011, p. 110), retaining the last available measurement for each individual before withdrawal from the study, are not possible. The number of cases of changed experimental conditions was nine; this occurred with female surveyors with male respondents (n=4), and female surveyors with female respondents (n=3) and with male surveyors with male respondents (n=2).
3. Results
3.1 General response rates and success of randomization
In total, data were available for 249 approached patients. Out of these, 208 patients (AAPOR RR2: 83.5%) were willing to fill out the questionnaire, and for 189 patients (AAPOR RR1: 75.9%) a complete questionnaire was available. Observation sheets were missing for two respondents, whereas details such as respondents’ birthyear or gender were missing for 11 cases. Those cases were excluded from the analysis listwise. In nine cases the experimental condition was changed due to the respondents taking initiative to shake hands.
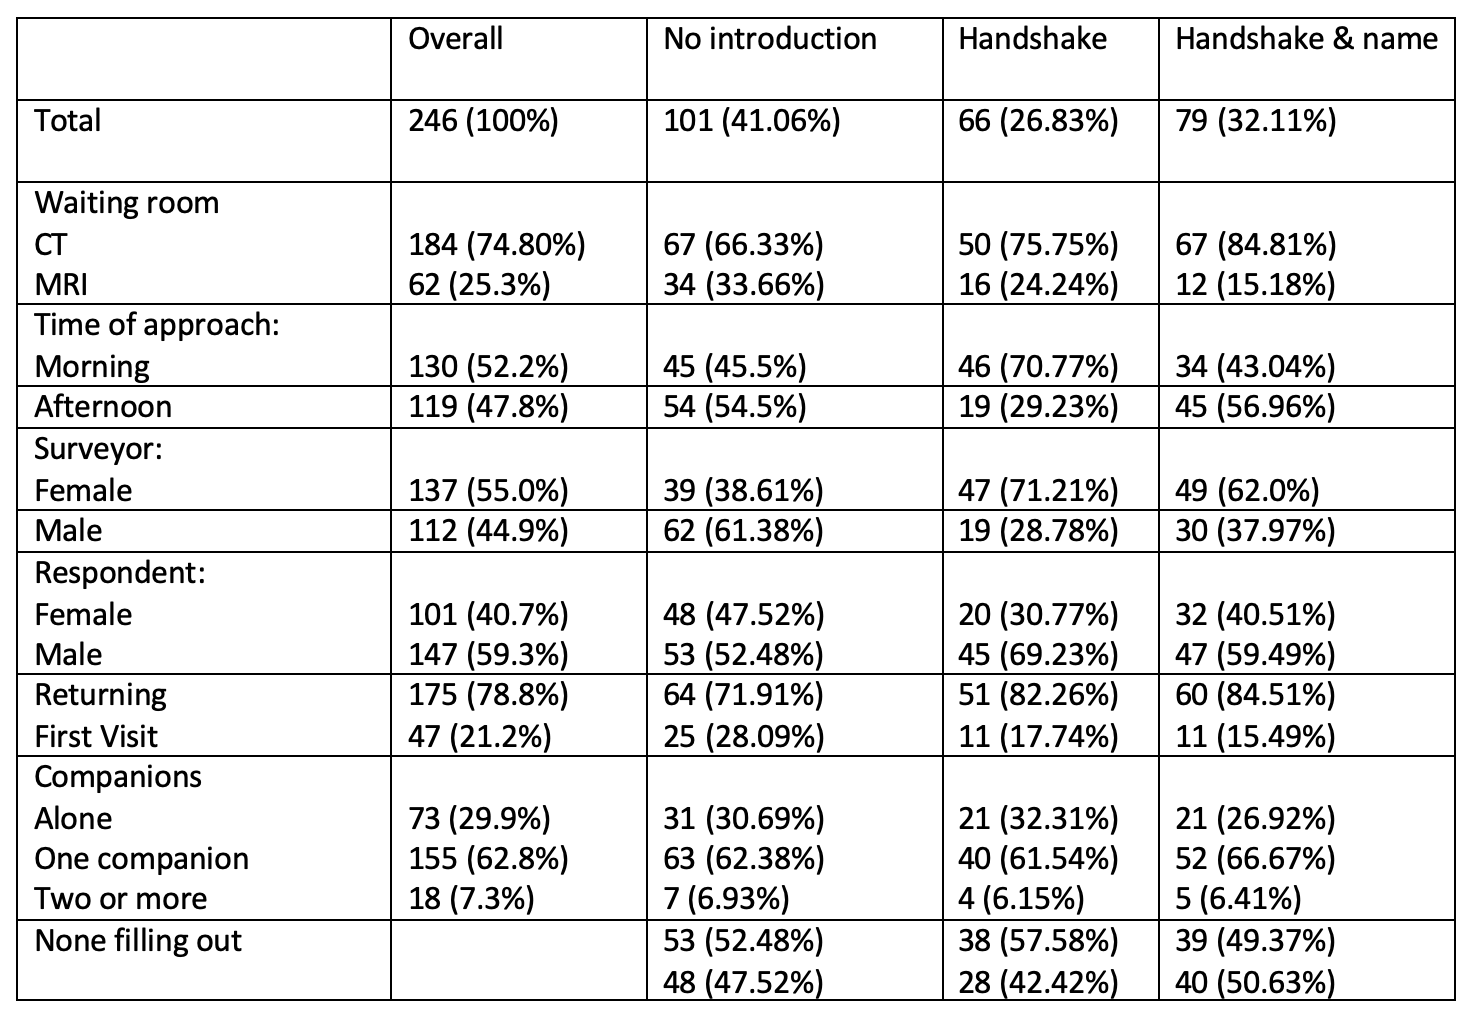
Table 1 provides the descriptive statistics for relevant variables per condition. A significant difference per experimental condition was found for the waiting room (Χ2 (2)= 8.069, p = .017,Cramer’s V = 0.181), timing (morning or afternoon) approach (Χ2 (2)= 13.375, p = .0012, Cramer’s V = 0.235) and gender of the surveyor (Χ2 (2) = 19.53, p < .001, Cramer’s V = 0.282). Randomization was successful for the two numerical predictors age and number of people in the waiting room. The mean age did not differ in the no handshake condition (M = 58.2, SD = 15.8), handshake only (M=61.8, SD = 15.0) and handshake and name (M=59.5, SD = 14.7, F(2, 230) = 1.042, p = .355). The number of people in the waiting room did not differ in the no handshake condition (M = 6.01, SD = 3.11), handshake only (M=6.65, SD = 2.98) and handshake & name (M=5.82, SD = 3.13, F(2, 243) = 1.415, p = .245).
Table 1 Number and percentage of approached patients per situational, surveyor and respondents’ characteristics per experimental condition
3.2 Response rates per situational, surveyor and respondents’ characteristics per experimental condition
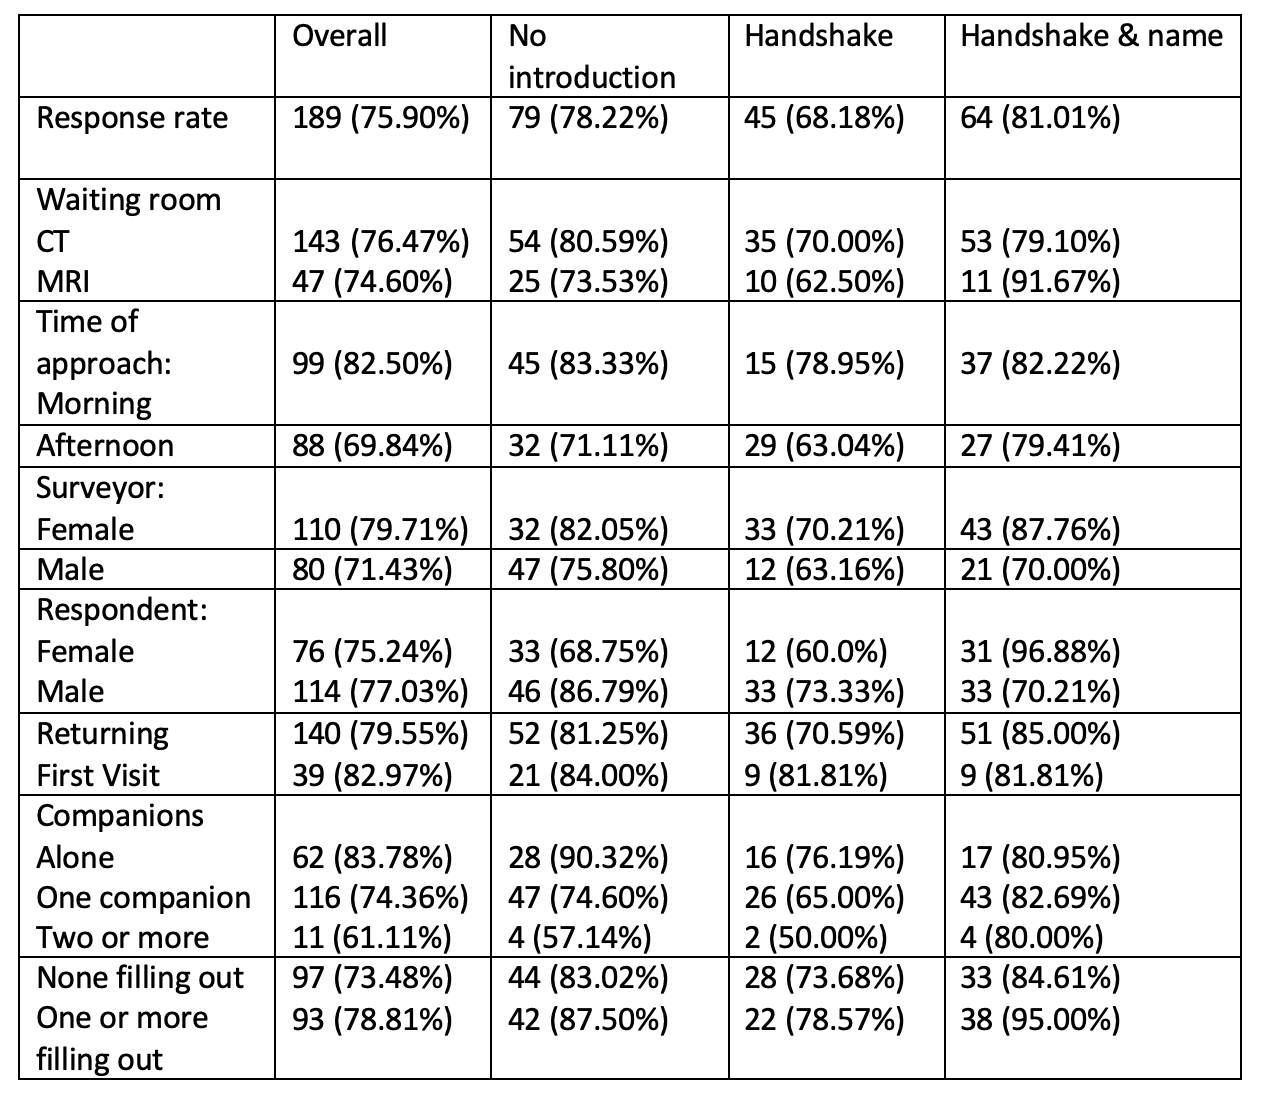
Tables 2a and 2b show the response rates for willingness to fill out the questionnaire and completion of questionnaires for situational, surveyor and respondents’ characteristics per experimental condition. For willingness to fill out, a significant difference in response rates was found within female surveyors for experimental conditions. Female surveyors had a higher response rate for the condition of shaking hands and mentioning their name (96.9% response) than not shaking hands (77.1%) and especially higher than shaking hands without mentioning their name (70.0% response rate, c2 (2) = 7.53, p = .023). This effect also holds for response in terms of complete questionnaires (c2 (2) = 11.835, p = .003). In addition, for complete questionnaires, a significant difference in response rates was found for timing of the approach: in the morning the response rate was higher (82.5%) than in the afternoon (69.8%, (70.0% response rate, c2 (1) = 5.4, p = .020). This effect was similar, but non-significant, within the three surveyor conditions.
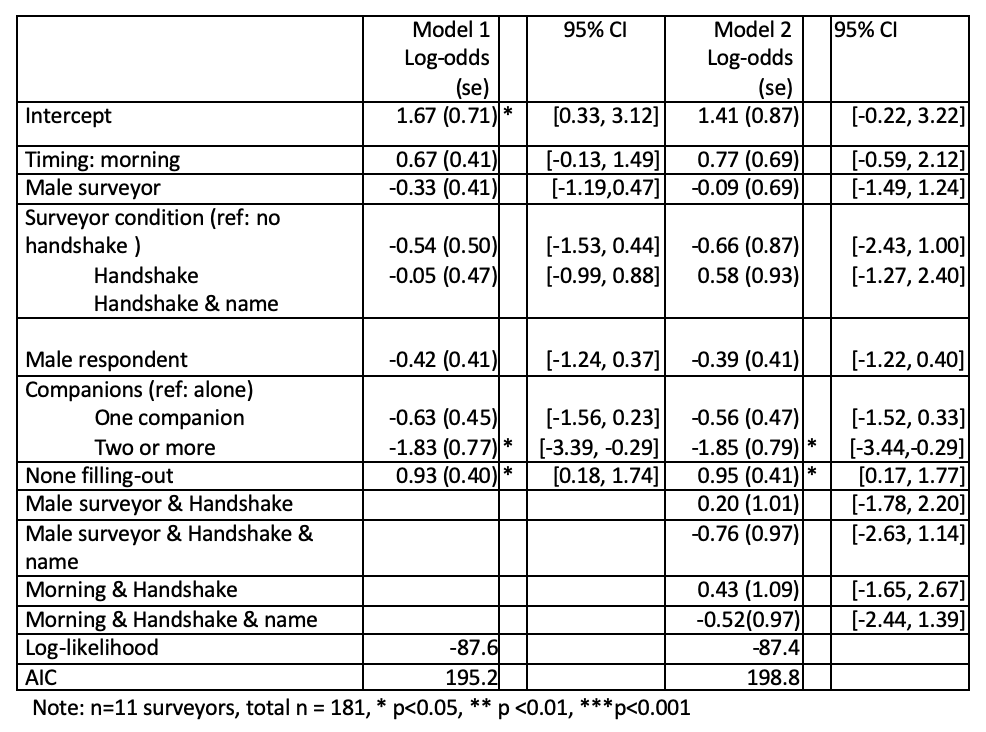
In a mixed binary logistic regression model (Tables 3a and 3b), effects of the handshaking, gender of the surveyors and respondents and the number of people in the waiting room on willingness to participate and completion rate were tested, taking variance at the surveyor level into account. Since randomization was not successful for timing and gender of the surveyor, an interaction term in the binary logistic regression model was taken into account for timing and gender of surveyor. Due to convergence problems while taking waiting room as interaction term in the models, we choose to compensate lack of randomisation across waiting rooms by running models on the CT waiting room only, thus the observations for the MRI department were not included in the models. The variance at surveyor level in the model, not taking any predictor variables into account, was low (0.14, SD = 0.38). This variance was significantly reduced (0.05, SD = 0.23) when taking the predictor variables into account and reduced to zero when also taking interaction effects into account.
Table 2a Response rates (willingness) per situational, surveyor and respondents’ characteristics per experimental condition
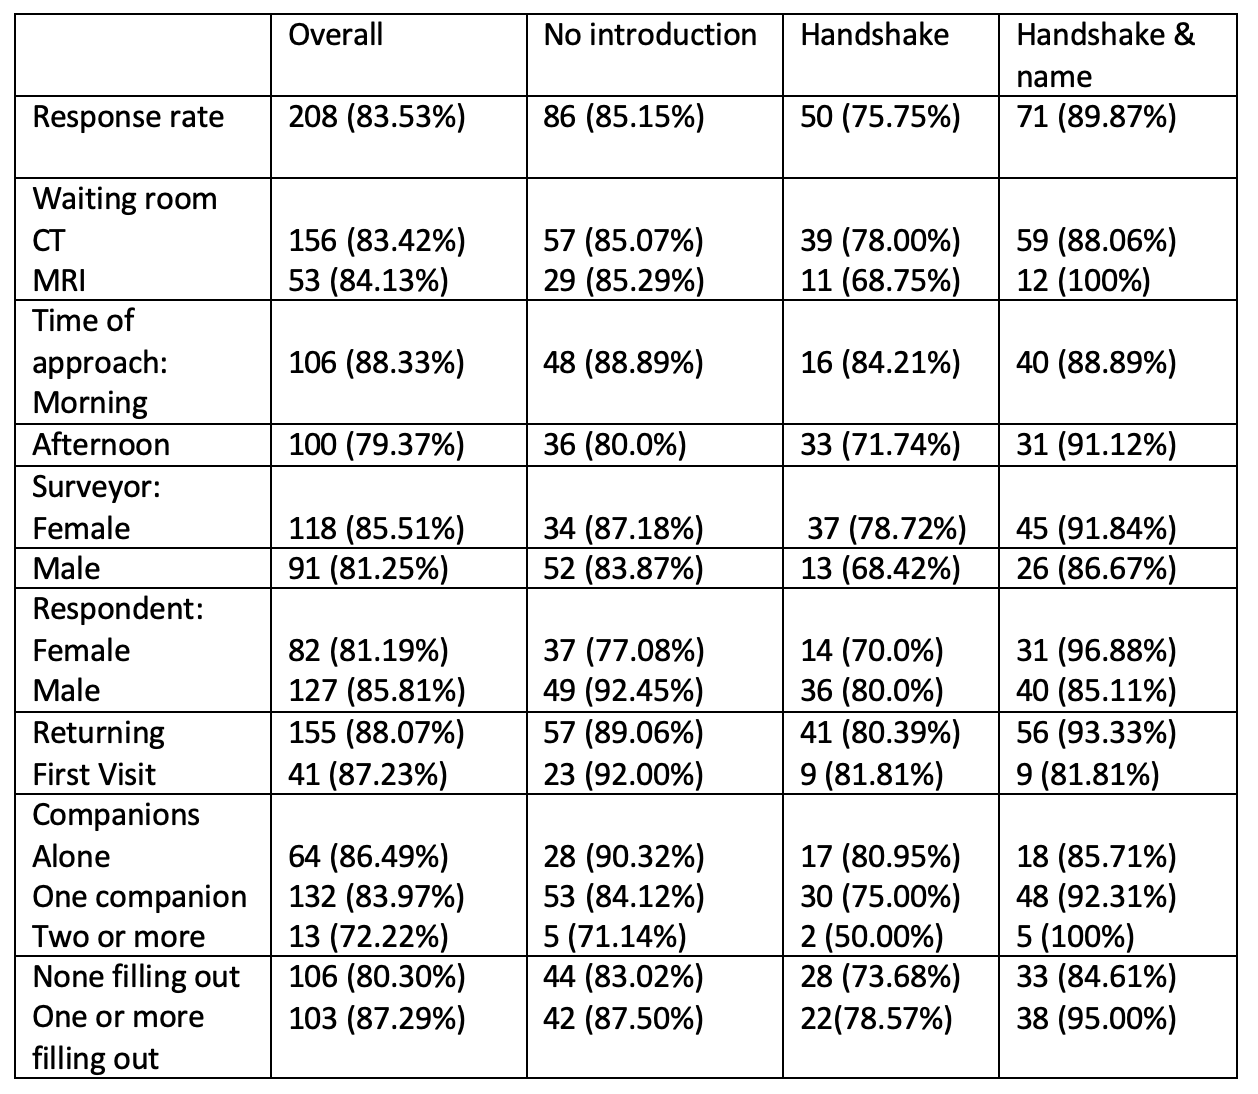
Table 2b Response rates (complete questionnaires) per situational, surveyor and respondents’ characteristics per experimental condition
3.3 Effects of the number of people in the waiting room
For the willingness to participate, a significant effect of the absence of other patients filling out the survey was found (table 3a). When no other patients in the waiting room were filling out the survey, willingness to participate was higher (OR = 3.32, p =.003) than when there were other patients filling out the survey. Including interaction effects in model 2 reduced the fit of the model, but did not change the effect of no other patients filling out the survey. The same effects were found for actual completion of the questionnaire (none filling out OR= 2.53). Thus, this finding corroborates H1..
In addition, for completed questionnaires (table 3b) a significant effect was found for the number of people accompanying the patient. In contrast to the situation where a patient was waiting alone, when two or more people were accompanying the patient, a significant effect was found, showing decreased odds (OR 0.16) of a completed questionnaire. Thus, this finding corroborates H2.
3.4 Influence of the introduction of the surveyor on participation
No significant effects were found for the surveyors’ conditions handshake, handshake with verbal introduction of name, and no handshake. Thus, H3 and H4 could not be corroborated.
Since no effects of the experimental conditions for the surveyor could be found, H5 could not be corroborated either.
Table 3a Log-odds, standard error (SE) and 95% Confidence interval of situational, surveyor and respondents’ characteristics predicting response in terms of willingness
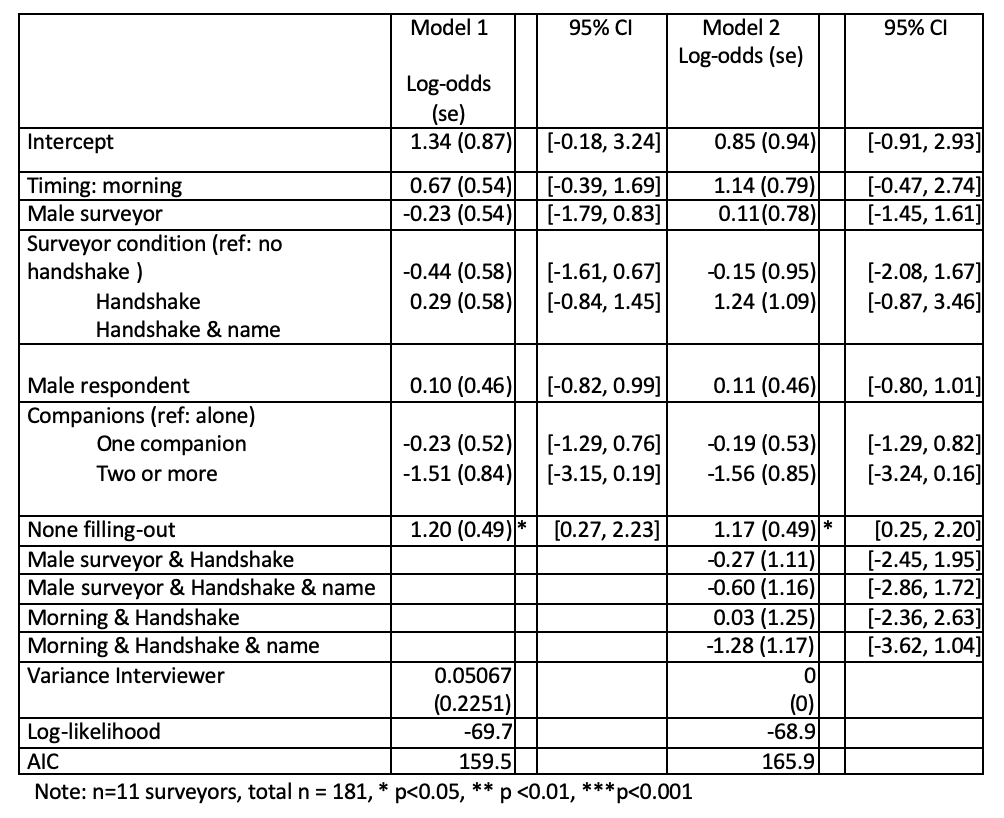
Table 3b Log-odds, standard error (SE) and 95% Confidence interval of situational, surveyor and respondents’ characteristics predicting response in terms of complete questionnaires
4. Conclusion/Discussion
Waiting room surveys, though limited to patients and their caregivers, can provide useful information on patients’ perspective on health care topics. These surveys also allow for collection of paradata; i.e., relevant information in the circumstances of a request to participate in survey research (Kreuter, 2013), and behaviour of surveyors can easily be controlled, or investigated in an experimental design. Response rates in waiting rooms surveys are usually high, but often not even reported.
In this paper, we presented the results of an experiment approaching patients in CT and MRI waiting rooms, investigating the effects of a surveyor’s handshake, with or without introducing their name, and circumstances in the waiting room such as the number of people present.
As we included several measures to increase the overall response rate (such as motivating the surveyors, who were identifiable as hospital professionals by wearing a white coat and the FITD-strategy high), additional effects in increase of the response rates via our predicting variables and experimental conditions were small. We found that willingness to participate was higher when no other people present were filling out the survey than when there were other patients filling out the survey. This effect can be explained in terms of the principle of scarcity (Groves, Cialdini & Couper 1992). If other people present in the waiting room are already filling out the survey, participation is not perceived as a rare occasion, and thus as a less valuable contribution.
As soon as patients are accompanied by caregivers, the likelihood of participation decreases. One possible reason for this finding could be that patients accompanied by caregivers are more anxious or ill, and their anxiety may both cause them to desire to be accompanied and not to be disturbed. In addition, patients not accompanied may also be more willing to cooperate due to boredom while waiting. Since the effect of accompanying caregivers was strongest for the completion rate, it is also possible that patients filling out the survey are less able to complete the survey before their appointment would start, and also less likely to continue completion after their appointment.
For female surveyors we found higher response rates when they approached the patients with a handshake and mentioning their name, than when they did not mention their name, and (to a smaller extent) also when not shaking hands at all. However, this finding did not hold in a multivariate analysis taking into account confounding factors, such as uneven distribution of gender of surveyors across conditions. It is very well likely that not mentioning their names was deemed awkward also by the surveyors. Some surveyors may have compensated for the expected negative consequences while others were not as good in hiding their uncertainty. In future studies, i.e., if shaking hands becomes possible again, measures of surveyors’ attitudes and personalities (see West and Blom, 2017 for an overview) should be included. Overall, there was no effect of the surveyor’s handshake on survey participation. In light of social distances measures fighting COVID-19, this outcome fortunately shows that also without handshake greetings which are very common among health care professionals and patients (Jain, Aqsa & Malhotra, 2020), participation in waiting rooms surveys is likely not to be affected.
References
- AAPOR (2016) Standard Definitions, Final Dispositions of Case Codes and Outcome Rates for Surveys. Retrieved July 2020 (https://www.aapor.org/AAPOR_Main/media/publications/Standard-Definitions20169theditionfinal.pdf)
- Blom, A.G., de Leeuw, E.D., & Hox, J.J. (2011) Interviewer effects on nonresponse in the European Social Survey. Journal of Official Statistics. 27(2), 359–377
- Bowling, A. (2005). Mode of questionnaire administration can have serious effects on data quality. Journal of public health 2005; 27: 281-291
- Cowan, C.D. (1989). Mall Intercepts and Clinical Trials: The Philosophy of Inference From Different Types of Research Designs. Marketing Research. 1 (1), 15-22
- Dijkstra, W, & Smit J. (2002) Persuading reluctant recipients in telephone surveys. In: (R. Groves, D. Dillman, J. Eltinge & R. Little, eds.) Survey nonresponse; New York: John Wiley & Sons, Inc.
- Dolcos, S., Sung, K., Argo, J.J., Flor-Henry. S., & Dolcos. F. (2012). The power of a handshake: Neural correlates of evaluative judgments in observed social interactions. Journal of Cognitive Neuroscience. 24 (12), 2292–2305
- Durrant, G.B., Groves, R.M., Staetsky, L., & Steele F. (2010). Effects of interviewer attitudes and behaviors on refusal in household surveys. Public Opinion Quarterly. 74(1),1–36
- Groves, R.M., Cialdini, R.B., & Couper, M.P. (1992) Understanding the decision to participate in a survey. Public Opinion Quarterly. 56 (4), 475-495
- Gupta, S. K. (2011). Intention-to-treat concept: A review. Perspectives in Clinical Research, 2(3), 109
- Hogg, W., Johnston, S., Russell, G., Dahrouge, S., Gyorfi-Dyke, E. & Kristjanssonn, E. (2010). Conducting waiting room surveys in practice-based primary care research: A user’s guide. Canadian Family Physician. 56 (1), 1375-1376
- Hornik, J., Ellis, S., (1988). Strategies to secure compliance for a mall intercept interview. Public Opinion Quarterly. 52 (4), 539-551
- Jäckle, A., Lynn, P., Sinibaldi, J., & Tipping S. (2013). The effect of interviewer experience, attitudes, personality and skills on respondent co-operation with face-to-face surveys. Survey Research Methods7(1), 1–15
- Jackson-Smith, D., Flint, C.G., Dolan M., Trentelman C.K., Holyoak, G., Thomas, B, & G. Ma (2016). Effectiveness of the drop-off/pick-up survey methodology in different neighborhood types. Journal of Rural Social Sciences. 31 (3), 55-67
- Jain, A., Aqsa, S., Malhotra, K. (2020). Handshake habit amongst medical practitioners, need to abandon and embrace an alternative: analytical study in view of COVID-19 pandemic. International Journal of Community Medicine and Public Health. 7 (6), 2352-2356
- Katsumi, Y., Kim, S., Sung, K., Dolcos, F., & Dolcos, S. When nonverbal greetings “make it or break it”: the role of ethnicity and gender in the effect of handshake on social appraisals. Journal of Nonverbal Behavior. 41(4), 345-365
- Kreuter, F. (2013). Improving surveys with paradata: Analytic uses of process information. New York: John Wiley & Sons
- Ongena, Y.P., & Haan, M. (2016). Using Interviewer-respondent Interaction Coding as a Manipulation Check on Interviewer Behavior in Persuading CATI Respondents. Survey Practice 9 (2)
- Pirotta, M., Gunn, J. & Harrison, D. (2002). Measuring Prevalence: Accurate sampling in general practice waiting room surveys: methodological issues. Australian and New Zealand journal of public health.26(2), 152-155
- Ranganathan, P., Pramesh, C. S., & Aggarwal, R. (2016). Common pitfalls in statistical analysis: Intention-to-treat versus per-protocol analysis. Perspectives in clinical research, 7(3) 144-146
- Sperry, B.R., Siler, E., Mull, T. (2018). Application of the “Foot-in-the-Door” Compliance Technique for Traveler Intercept Surveys. Transportation Research Record: Journal of the Transportation Research Board. 2672 (42), 23-32
- Schroeder, J., Risen, J., Gino, F., Norton, M.I. (2014). Handshaking promotes cooperative dealmaking. Harvard Business School NOM Unit Working Paper No. 14
- Stewart, G.L., Dustin, S.L., Barrick, M.R., Darnold, T.C. (2008). Exploring the handshake in employment interviews. Journal of Applied Psychology. 93 (5), 1139–1146
- Trentelman, C.K., Irwin J., Petersen K.A., Ruiz, N. & Szalay, C.S. (2016). The case for personal interaction: Drop-off/pick-up methodology for survey research. Journal of Rural Social Sciences. 31 (3)., 31-34
- West, B. T., & Blom, A. G. (2017). Explaining interviewer effects: A research synthesis. Journal of Survey Statistics and Methodology, 5(2), 175-211.
-
Keywords
calibration CATI coverage coverage bias cross-national surveys data linkage data quality European Social Survey experiment face-to-face face-to-face survey Facebook hard to reach populations incentives item nonresponse measurement measurement error mixed-mode surveys multitasking non-probability samples Nonresponse nonresponse bias nonresponse rates paradata PIAAC Probability sample probability samples QR codes rare populations response rate Satisficing social desirability Social media survey survey-taking climate survey data survey management survey methods Telephone survey telephone surveys total survey error unit nonresponse validity web survey Web surveys weighting
