

Sequentially mixing modes in an election survey
Lipps, O. & Pekari, N. (2021). Sequentially mixing modes in an election survey. Survey Methods: Insights from the Field. Retrieved from https://surveyinsights.org/?p=15281
© the authors 2021. This work is licensed under a Creative Commons Attribution 4.0 International License (CC BY 4.0) 
Abstract
In a sequential mixed mode survey, instead of offering different modes from the onset, the data collection usually starts with an inexpensive mode for the whole sample, followed by more expensive modes to attract non-respondents. In this paper, we analyze to what extent this type of design, consisting in this case of web, telephone and mail-paper modes, is able to improve representativeness in terms of socio-demographic variables and reduce bias in terms of voting behavior compared to a single mode survey. In addition, we study whether changes in mode lead to measurement error issues by focusing on income. We find that adding the telephone mode improves sample representation in terms of socio-demographic variables, while adding the paper mode does not show further improvements in this respect. However, adding the telephone, and in particular the paper mode, turn out to reduce bias in terms of voting behavior. As for measuring income, the web and the telephone mode perform similarly well. Finally, we find little evidence of measurement differences of income when the same respondents are interviewed first by web or telephone and subsequently by paper questionnaire.
Keywords
election survey, mail-paper follow-up, push to web survey, representation bias, telephone follow-up, voting behavior bias, web survey
Copyright
© the authors 2021. This work is licensed under a Creative Commons Attribution 4.0 International License (CC BY 4.0)
1. Representativeness and measurement when adding modes to the web
There is ample evidence of an increased response rate by sequentially mixing modes (de Leeuw 2005, Tourangeau 2017). For instance, using the web as the first mode, Dillman and colleagues (2009) showed that the response rate can be substantially improved by adding the telephone mode, and Dillman (2017) by adding the mail-paper mode to the web. However, it remains unclear whether this leads to an improved representativeness or less biased substantive variables and in which context (population, topic, Internet penetration rate, etc.) this is the case. One of the major issues in answering this question is disentangling sample selection effects, as individuals who answer using different modes are different, for instance by virtue of having different access to the mode. Another issue is mode measurement effects, where different modes have different stimuli to answer a question (e.g., interviewer-based modes tend to produce more socially desired answers). Measurement differences can even sometimes offset response rate gains (Dillman et al. 2009). For example, if the telephone produces more positive responses to scale questions than the web (Dillman and Christian 2005), mixing the telephone with the web mode creates other issues that make the higher response rate less valuable. Previous research about the use of mixing survey modes has not been conclusive. Roberts and Vandenplas (2017), for example, found that while total bias was reduced as a result of mixing modes, the effect of the approach on the bias components varied depending on the survey design and the type of variables analyzed. The authors generally found that bias on socio-demographic variables was the result of selection error and that bias in substantive variables was rather the result of measurement error.
From these findings, we expect a better representation in terms of socio-demographic variables by adding modes to the initial web mode, while the expected direction of change of measurement error regarding substantive variables is not clear. The problem regarding the latter is that answers to the substantive (political)variables cannot be validated at the individual level. Indeed, vote secrecy means that it is not possible to compare the party choice stated in a survey with an official register. For turnout, this is not possible at the national level in Switzerland, although some regions can provide this information in exceptional cases (see e.g. Sciarini and Goldberg 2015). In this paper, we use data from a Swiss election survey where first the web, then the telephone and finally the paper mode was used. The gross sample is a nationally representative sample of Swiss citizens with the right to vote. It was drawn from an individual register, which includes basic socio-demographic variables of targeted persons and all household members. This makes it possible to compare respondents of the mixed mode survey (respondents to web, web and telephone, or web, telephone and paper modes) not only regarding univariate target distributions, but multivariate distributions of all frame variables as well. Unlike common address-based surveys (Dillman 2017), this design allows for the identification of factors, which improve, or worsens representativeness of the sample, while controlling for the other variables. Of course, the frame information is not error free either and some variables, such as household size, are based on different concepts in registers and in surveys or may have changed between the drawing of the sample and survey responses (the lag is typically around 3 to 6 months). Nevertheless, we assume that the frame variables are a reliable indicator for the situation at the time of the interview.
To analyze measurement issues, we examine substantive variables that are typically overestimated (political interest, voting turnout, vote frequency) and underestimated (vote for right-wing parties). For two of these variables, voting turnout and vote for right-wing parties, we know the true population values and canassess the aggregate bias with and without the added modes. For the other two substantive variables, political interest and vote frequency, we do not know the true population values. However, given there is strong evidence that they are consistently overestimated both due to selection and reporting bias (e.g. Lipps and Pekari 2016), we interpret decreasing political interest and vote frequency as an indication of decreased bias. In addition, we use a test-retest design to detect changes in response behavior: For the subsample that was reinterviewed using the mail-paper mode, we analyze differences between reports in the first (web or telephone) and the second (paper) survey.
We investigate four research questions linked to the effects of adding the telephone and the paper mode to a web survey: 1) the impact on socio-demographic sample representativeness, 2) the impact on bias in substantive variables, 3) in which mode reported socio-demographic variables and income are more in line with the information from the register data, and 4) which mode provides the least measurement error among reinterviewed sample members.
2. Study design
Data come from the Swiss Electoral Study (Selects) 2015, which was conducted after the national elections. The gross sample (N=10’391) was drawn by the Swiss Federal Statistical Office (SFSO) from a population register SRPH (Stichprobenrahmen für Personen- und Haushaltserhebungen, accessed November 2, 2020) with practically full coverage and up-to-date information on the Swiss population. The sample a nationally representative sample of Swiss citizens who are 18 or older.
The sequential mixed mode design started with an online self-administered web questionnaire, followed by a telephone interviewer-administered telephone questionnaire and finally a self-administered paper questionnaire. The response rate for the web survey was 35.8 percent, this increased to 44.9 percent when including the telephone mode, and to 53.1 percent when including the paper mode (AAPOR RR1).
The questionnaire of the 2015 Selects survey was adapted for use in the different modes, including small devices such as smartphones. The question formulations were harmonized as much as possible across modes, following the idea of the “unified mode design” (Dillman, Smith and Christian 2014). Questions on the web were presented one per screen to keep the focus on one question at a time, as is the case in the telephone survey. However, it was not deemed reasonable to mimic this aspect in the paper questionnaire due to the number of pages necessary for a short questionnaire (a one-sided page per question). Special care was taken that interviewers always read out options that were visible in the web mode. This is important for instance in the case of offering a “don’t know” option (de Leeuw 2005). Both the telephone and web versions of the questionnaire were programmed by the survey institute.
The first contact was a pre-notification letter explaining the aim of the survey, received by sample members about ten days before the start of the survey. The letter included a flyer as well as a mention that the second (main) letter would include a prepaid incentive. Sample members then received this second letter the day after the election, on October 19, 2015, with a link to access the online questionnaire and a prepaid incentive of 10 Swiss Francs (CHF) in the form of a postal check. Postal checks can be cashed at no cost at any post office in Switzerland and are valid two months after the date of issuing. The first reminder was sent 9 days after the start of the survey. For those for whom a telephone number was available directly from the frame or from additional search efforts, a mention was made that they would be called starting on the Monday of the third week of the field period to further push people to answer online. A second reminder was sent another 9 days later to all of those who had not yet responded using either mode. The field period for the main survey ended on November 29. The mail-paper survey, which included a subset of the central questions from the main survey, started on December 3 and the field period extended to January 5. All sample members with a valid mailing address who had not responded during the main field period and were not unable to respond due to health reasons were sent the mail-paper follow-up. In addition, a random subsample of 530 respondents from the main survey (81 percent Web and 19 percent telephone) was recontacted for a test-retest questionnaire that was identical to the one sent to nonrespondents. Of the 530 recontacted respondents from the main survey, 66 percent responded to the test-retest questionnaire.
3. Results
3.1 Representativeness of frame variables
To analyze sample representativeness of the variables provided with the sampling frame, we use the variables age (18-30, 31-44, 45-58, 59-72, 73+ years), marital status (married, widowed, divorced), household size (1, 2, 3, 4+ persons), language region (Swiss-German, French, Italian), the Swiss seven large regions (NUTS-2), gender, availability of a landline phone listed in the published telephone directory (e.g., Sala and Lillini 2014), availability of a landline phone (i.e. the SFSO can match a landline with its own telephone register CASTEM, which includes unlisted numbers but which could not be used for the purposes of this study), municipality size (>100k inhabitants, 50k-<100k inhabitants, 20k-<50k inhabitants, 10k-<20k inhabitants, 5k-<10k inhabitants, 2k-<50k inhabitants, 1k-<2k inhabitants, <1k inhabitants), urbanity (city vs. others), whether a foreigner lives in the household, whether the sample member was born abroad and monthly income. Register income was delivered by the Swiss Compensation Office and matched with the gross sample by the SFSO. Because the register income included only taxed income, we imputed missing values using a linear regression, with the logarithm of income as dependent variable and the aforementioned frame variables as predictor variables. The model fitted with an R2=.22 (F(41,6912)=46.4, Prob>F<.001). This imputation concerned 3’437 members (33.1 percent), of whom in particular older people (retired, widowed), small households, Italian speakers, and consequently more telephone (56 percent missing income) and mail-paper (40 percent) respondents compared to web (26 percent) respondents. We tested if imputing missing income from the register changes the probability to respond by including a flag variable for imputed income. While the flag variable had a significant effect (1 percent level) in the web only design (the imputed had a 4.5 percentage points lower response probability), the effects lost significance (5 percent level) once telephone and paper modes were added.
Table A.1 in the appendix shows the descriptive statistics of the frame variables and Table A.2 the mean predicted probabilities to respond calculated from multivariate linear regressions of these frame variables across the modes, starting with the web respondents, then adding the telephone respondents and finally the paper respondents. For example, Best and Wolf (2012) show that logistic and linear regressions of binary variables with an expected probability of close to 50% (we have between 36 and 53% here) provide similar results. As a robustness check, we run a multivariate logistic regression. The corresponding mean predicted probabilities to respond are very close to those from the linear regression models. Due to an easier interpretation (Mood 2010), we give priority to the linear probability model.
To aid the interpretation of under- or overrepresented categories in the different mode designs, we graph the predicted response probabilities in figure 1 (with the exception of the continuous variable income) together with their 95 percent confidence intervals and for each sample the mean response rate represented by the vertical line.
Figure 1: Predicted response probabilities by categories of frame variables. Web_tel=web plus telephone, Web_tel_PandP=web plus telephone plus paper. Data: Selects 2015 PES, design weighted. N=10’391.
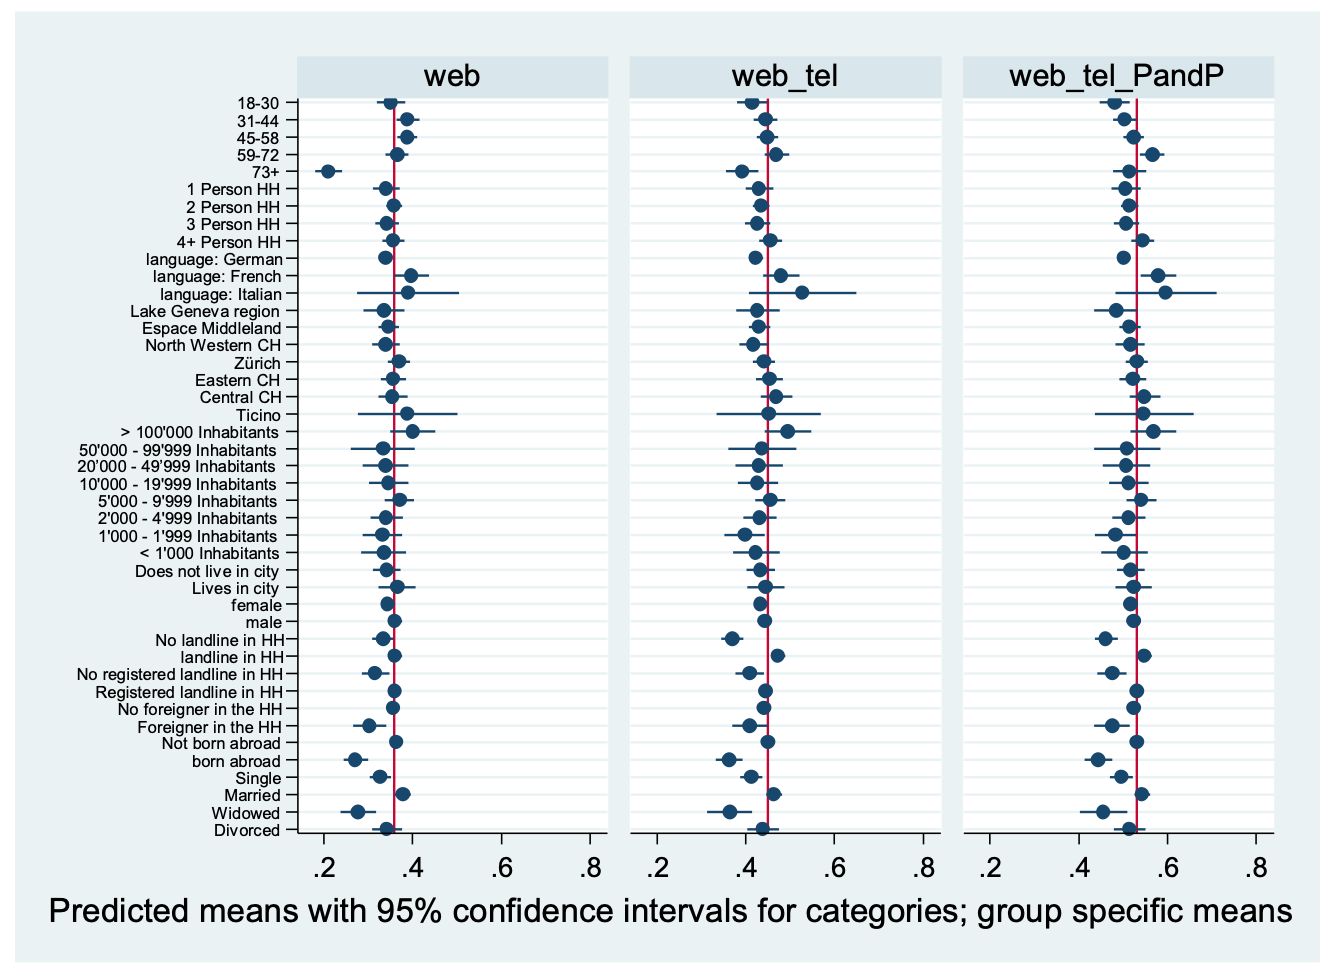
We briefly describe the main representation bias of the frame variables and how this changes when adding modes in the following.
For age, older people (73+ years) are strongly underrepresented among web respondents. Adding the telephone and the paper modes cause an over-representation of people aged 59-72, while older people are increasingly better represented. In turn, we find no particular bias for household size. As for language, French speakers are slightly overrepresented in the web sample and strongly so after adding the telephone and paper. In terms of region, municipality size, and urbanity, there is a strong underrepresentation of municipalities between 10k and 50k inhabitants among web and web plus telephone respondents and a slight one of the municipalities between 20k and 50k inhabitants in the final sample. We find no systematic bias regarding gender, whereas people with a landline telephone at home are strongly overrepresented in the web plus telephone sample and this remains true after adding the paper mode. Those with a listed landline are slightly overrepresented in the web sample and strongly in the final sample. People living with a non-Swiss national in the household are strongly underrepresented in the web sample and slightly so after adding the telephone and the paper mode. In turn, those born abroad are strongly underrepresented in all samples. In terms of civil status, married people are strongly overrepresented in all samples and widowed people slightly underrepresented among web respondents. Finally, the effect of income on response (see Table A.2) is essentially positive and linear; however, the borderline significant negative quadratic term in the final sample shows that, in addition to linearity, low and very high-income groups tend to respond less.
To get a clearer picture of representativeness of the three samples using these frame variables simultaneously, we calculate the r-indicator (Schouten et al. 2009). This indicator assesses the similarity between the response in the three samples regarding these frame variables. The r-indicator is defined as:
r(ρ)= 1-2S(ρ)
With ρ the predicted response probabilities and S(ρ) their standard deviation. The r-indicator has a range between 0 and 1 with the value 1 being perfectly representative and the value 0 being the maximum deviation from representativeness. The r-indicators of the three samples are listed in table 1, together with the Pearson R2 and the F values.
Table 1: r-indicators, Pearson R2 and F values of linear models with frame variables as predictors. Data: Selects 2015 PES, design weighted, N=10’391.
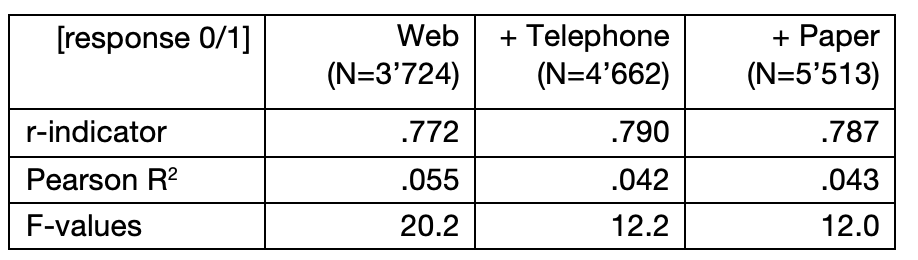
The r-indicators are comparable to those found for the Dutch Labor Force Survey 2005, which use similar demographic auxiliary variables (Schouten et al. 2009). We find a slightly improved representativeness when the telephone respondents are included but no further representativeness improvement with the inclusion of the paper respondents. This is also in line with the development of the F and the R2 values, which decrease between the first and the second model, but essentially stay the same thereafter. From the Pearson R2, we find that the available frame variables explain only a small part of the response variation. The model F values are significant overall and decreasing, which shows, together with the decreasing R2 that the frame variables are decreasingly able to distinguish response. Taken together, this indicates an increasing representativeness of the survey with regards to the frame variables when adding the CATI mode.
To summarize, representativeness of socio-demographic variables from mixing modes improved only after including the telephone mode. While the older age group is the only one to clearly improve, those with a landline at home are slightly overrepresented after adding the telephone and the paper mode. This finding is supported by a slightly improved r-indicator and a decreased R2 when the telephone respondents are added to the web respondents. Adding paper respondents does not change the r- or the model fit indicator.
3.2 Bias in substantive variables
Surveys typically overestimate political interest (Stoop 2005) and turnout (Sciarini and Goldberg 2015, Selb and Munzert 2013), and underestimate right-wing populist party voting (Hooghe and Reeskens 2007, Lubbers et al. 2002). In Switzerland, the Swiss People’s Party has been underrepresented since the start of the Selects surveys in 1995. This is also true for the Selects 2015 web survey. Table 2 lists the distribution of voting in the 2015 election and the reported yearly participation in popular votes, vote for the populist right-wing Swiss People’s Party, and political interest.
Table 2: Distribution of substantive variables across (cumulated) modes. Data: Selects 2015 PES, design weighted.
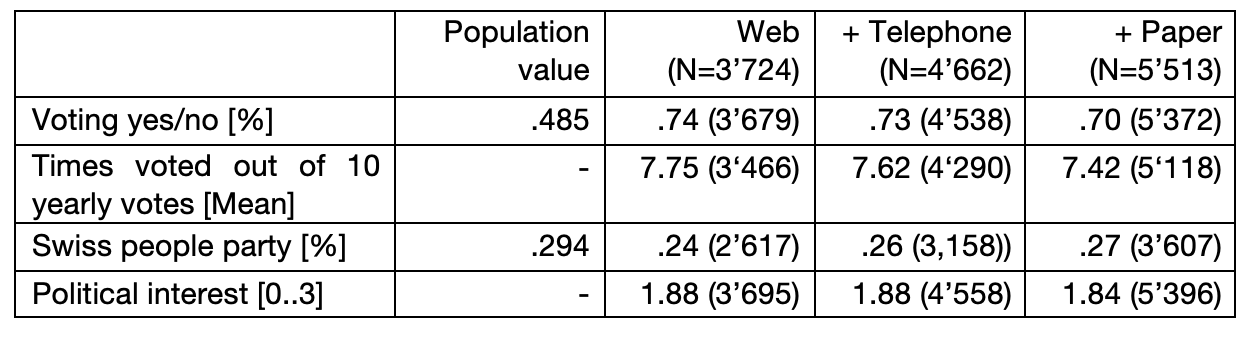
Note: Due to missing items, we list the number of valid answers to each question. Only those who participated in the election were asked about their party choice.
We see that adding modes decreases the overestimation of turnout and participation, especially when adding the mail-paper mode: Turnout decreases insignificantly (5% level; confidence intervals overlap) when adding telephone, and significantly when adding mail-paper. Participation decreases insignificantly when adding telephone, and significantly when adding mail-paper. The representation of voters of the Swiss People’s Partyimproves insignificantly. In addition, we find a (insignificant) reduction in the mean of political interest by adding the paper mode. To summarize, adding the telephone, and especially the paper mode, turns out to reduce bias in key substantive variables in this mixed mode election survey. It is likely that – compared to telephone respondents – adding mail-paper respondents leads to improvements in the estimates of the substantive variables not only because of the sample characteristics, but also because the absence of an interviewer leads to less socially desired answers (Holbrook and Krosnick 2008).
3.3. Which mode is more accurate in terms of socio-demographic variables and income?
We then turn to the third research question, i.e. in which mode are reported socio-demographic variables and income more in line with the information from the sampling frame. In table 3, we analyze the variables year of birth and gender, which were asked for in all three designs. We consider any difference between reported values and frame variable values as “error”. Contrary to the tables above, we do not consider cumulated samples here, but only the people interviewed in the specific mode. To measure the similarity between the reported birth year and gender with that from the sampling frame, we list the Pearson correlation coefficient.
Table 3: Wrongly reported birth year and gender (compared with frame variables) and Pearson correlation. Data: Selects 2015 PES.

There are some suggestions that telephone respondents report their birth year more accurately than respondents to the two non-interviewer-based modes, or, perhaps more likely, there are fewer substitutions (other members of the household responding in lieu of the target person). However, the correlation between the reported and the frame year is higher in the mail-paper mode. Gender misreporting in turn is higher in the telephone mode compared with the paper mode. This is surprising, since, ignoring sample characteristics, one would have expected gender in the telephone interview to contain only little misreporting since gender of the conversational partner can be accurately guessed in a telephone conversation (Callegaro et al. 2005) and respondents may be aware of this. However, we don’t find patterns such as for example a substantive number of sampled older people who report to have the opposite sex in the web mode and who actually live together with a younger person in the household which may suggest that people with a higher computer literacy respond instead of older household members. Overall, we do not find strong evidence of a systematically differently reported gender or birth year by mode.
In addition to the birth year and gender, we analyze the accuracy of reported income in the web and telephone surveys (not measured in the paper mode) compared to the information from the register. After recoding the continuous frame income into the 15 categories asked in the web and the telephone survey, we calculated Kendall’s tau-b and the Spearman rank correlation coefficients as measures of similarity between two ordinal-scaled variables (web/frame and telephone/frame income). As it turns out, both measures provide similar values for the modes (Spearman’s rho=.625 for web/frame and .626 for telephone/frame, Kendall’s tau-b=.510 for web/frame and .510 for telephone/frame). From this general trend, we can conclude that the web mode and the telephone mode measure income similarly well and that the presence of the interviewer does not seem to bias the results.
For a finer analysis, in a final step, we graph income from the register (x-axes) against mean reported income (y-axes) for each register class for web respondents and telephone respondents in figure 2. We add the “true” income as a diagonal line. As it turns out, in both groups, low-income individuals report a higher income and high-income individuals report a lower income. In the web and the telephone survey, income was measured in the same way, such that both modes should be comparable once sample differences are controlled for (which should be the case within register income categories). Low-income respondents from the web survey tend to report an even lower income, whereas this is less the case for telephone respondents. While mean income seems to be slightly more accurately reported by web respondents, this is true for telephone respondents for high income. A Kolmogorov-Simonov test shows that the two income lines are not statistically (5 percent) different.
Figure 2: Reported income versus income from register. Data: Selects 2015 PES, design weighted.
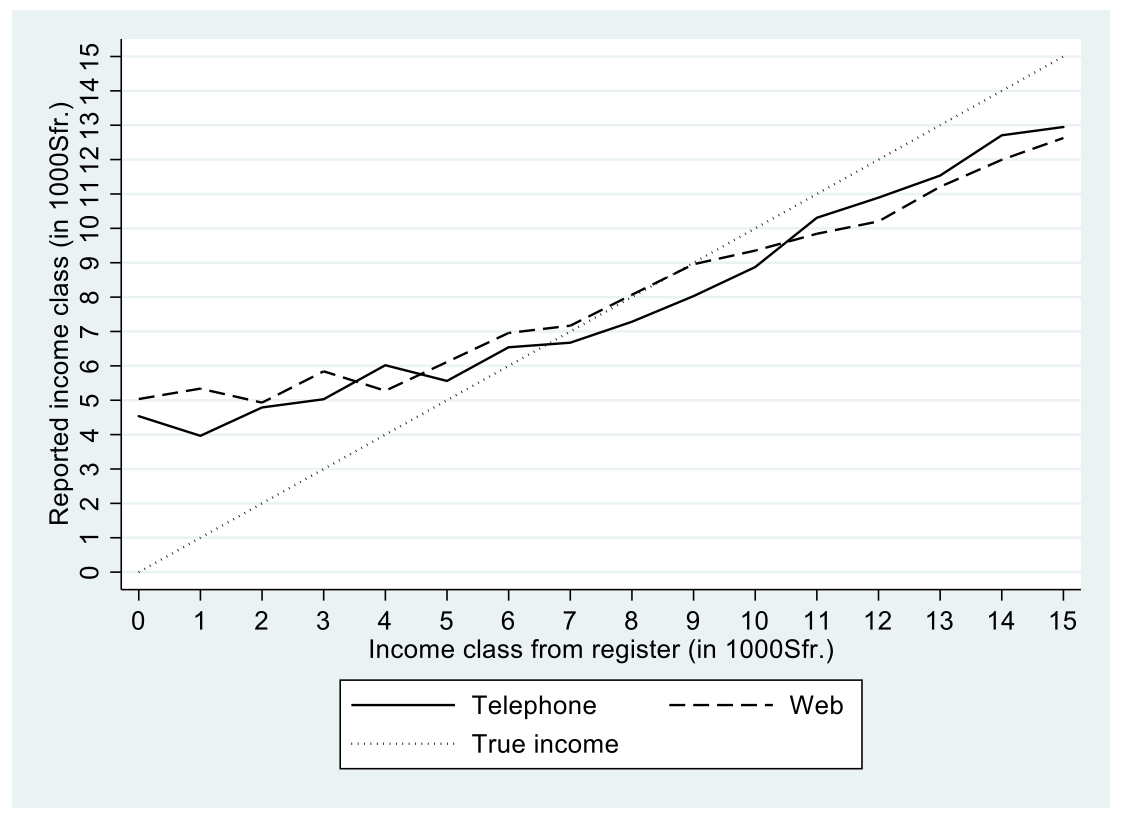
That low-income web respondents report a slightly higher income than low-income telephone respondents is unexpected, since the tendency to give socially desirable answers to an interviewer would lead us to expect the contrary (Tourangeau and Smith 1996, Braunsberger et al. 2007). It might also be that the fast rhythm dictated by the interviewer on the telephone increases the cognitive burden of questions on household income and thus leads to incomplete answers,where not all sources of income are considered (Fricker et al. 2005). Finally, both “flattened” curves may result from a regression to the mean effect (Campbell and Kenny 1999) due to imputing missing incomes or when measurement errors occur.
3.4 Re-interviews: which mode is more accurate?
The fourth research question concerned reporting differences among the reinterviewed sample members and which mode (web vs. paper or telephone vs. paper) provides less measurement error compared with the frame information. We check if the reported birth year and gender equal the respective frame variables in the main (“Main=frame”) and in the paper reinterview survey in table 4.
Table 4: Reported birth year and gender (compared with frame variables) for reinterviewed members. Data: Selects 2015 PES. Main denotes web in web/paper and telephone in tel/paper.

There are only few cases of differences between the frame variables and the surveys in terms of age and gender. We can thus conclude that birth year and gender are accurately reported by respondents and that the number of substitutions is low.
Next, we analyze the substantive variables reported participation in the election (yes/no) and voting for the Swiss people’s party (yes/no) among the reinterviewed sample members in Table 5. We report absolute numbers only since the size of the cells are relatively small in particular if the main and the paper mode do not coincide.
Table 5: Reported voting and vote for Swiss people party (SVP) for reinterviewed members. Data: Selects 2015 PES. Main denotes web in web/paper and telephone in tel/paper.
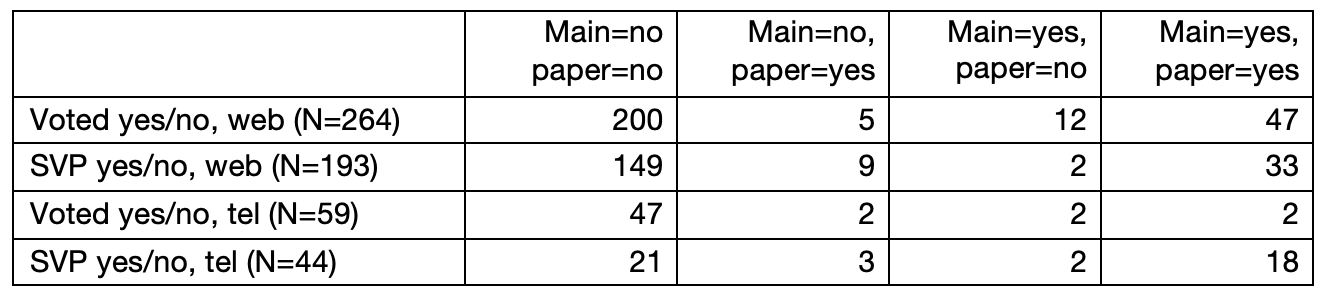
For substantive variables too, we find little evidence for a different reporting in the different modes. There is a slightly higher reported participation and fewer votes for the SVP in the web survey when compared with the paper mode. This is consistent: both a higher participation and fewer SVP votes suggest more socially desirableresponding. Because of the low numbers of cases, a definitive conclusion cannot be drawn, however.
4. Summary and conclusion
We find some evidence of improved socio-demographic sample representativeness by adding the telephone mode to a survey where web is the main data collection mode in the context of a Swiss election study. Adding the mail-paper mode does not show further improvements, mainly due to the small size of the additional sample. A clear message from our results is that failing to offer additional modes to a web survey will lead to a dramatic underrepresentation of the oldest age group (73+ in our analyses). This is bound to improve with time but remains an issue today. Our results suggest that bias in substantive political variables reduce significantly with additional modes, especially when adding the paper mode this time. This is particularly relevant for a political survey, where some groups, such as non-voters and voters of the populist right, are generally underrepresented, which can affect the accuracy of the conclusions drawn from the data. It has to be noted that this improvement results from a mix of selection effects and mode effects. Since we are lacking variables from electoral registers to validate reported participation or votes, it is impossible to disentangle these two effects. To be able to do so would require surveys with validated votes (e.g., Sciarini and Goldberg 2015). Election surveys are unique in this respect because in no other domain are substantive (dependent) variables in principle available. To learn more about selection effects and mode effects, more research with validated votes is necessary.
Second, our findings suggest that increasing the sample by adding sample members who are likely to be more reluctant to participate and less interested and knowledgeable in the topic does not increase measurement error on age, gender, income, or substantive variables. Overall, adding the more expensive telephone mode to the initial web mode seems to improve sample representativeness, whereas adding an inexpensive paper mode seems to improve the accuracy of substantive variables in particular. With a different sequence of modes offered, the paper mode could likely have a different effect, especially in terms of sociodemographic variables.
This improvement does come at a cost, however. Compared to an equivalent survey ran in parallel as a web-only survey in the context of the Selects 2015 project, the unit cost is more than double: it was about 60 Swiss Francs for the mixed mode survey, whereas it was under 30 Swiss Francs for the web-only survey. The latter amount includes the cost of an additional junior person hired for one year at a work rate of 80% to cover the increased needs for personnel when running the survey in-house. Part of the added cost is due to the mixed mode survey being externalized as FORS lacks the infrastructure to conduct telephone interviews. However, especially in Switzerland, which has high labor costs, paying for interviewers and supervisors for the telephone interviews is an important cost: the survey institute calculates a unit cost that is over six times higher for a telephone interview compared to a web interview.
It was planned to check possible substitution particularly in the web survey, meaning that for instance a possibly heavier Internet user fills out the questionnaire for another possibly reluctant person living in the same household. Since a number of socio-demographic variables for all household members are available from the sampling frame, differences between reported and frame characteristics could provide evidence for substitution. For example, if a sampled older woman is substituted by a middle-aged man, and a man with the corresponding profile lives in the household, this would be strong evidence for substitution. However, our sample size is too small to be able to find enough cases such as this. In larger web surveys with a sample drawn from a population register, which contains similar characteristics as the SRPH, checking for substitution with possibly more variables and a more complex design may be an avenue for future research and development of survey practice. Nevertheless, even by risking a few substitutions within households, our research shows that mixing a web survey with additional modes can improve both the representativeness of the respondent sample and bring in more of the groups of persons that could be underrepresented in terms of substantive variables, such as those less politically active.
There are a number of parameters that affect the success of adding modes to a web survey such as the type of survey and its design, the sample population, Internet and also landline penetration in case of using the landline as a follow-up mode, and the general survey climate in the country considered. And, of course, surveys are extremely heterogenous with respect to parameters and countries develop with different speeds in particular with respect to Internet and landline penetration, but also availability of data from population registers and other auxiliary information. Altogether, we believe that this paper contributes to the discussion about adding modes and possibilities to evaluate results, for example by comparing them with aggregated or individually matched information from registers.
Appendix
References
- The American Association for Public Opinion Research (AAPOR) (2016). Standard Definitions: Final Dispositions of Case Codes and Outcome Rates for Surveys. 9th edition. AAPOR.
- Best, H., & Wolf, C. (2012). Modellvergleich und Ergebnisinterpretation in Logit-und Probit-Regressionen. KZfSS Kölner Zeitschrift für Soziologie und Sozialpsychologie, 64(2), 377-395.
- Braunsberger, K., Wybenga, H., & Gates, R. (2007). A comparison of reliability between telephone and web-based surveys. Journal of Business Research, 60(7), 758-764.
- Callegaro, M., De Keulenaer, F. Krosnick, J.A., & Daves, R.P. (2005). Interviewer effects in a RDD telephone pre-election poll in Minneapolis 2001. An analysis of the effects of interviewer race and gender. Proceedings of the American Statistical Association, 60th Annual Conference of the American Association for Public Opinion Research, 3815-3821.
- Campbell, D. T., & Kenny, D. A. (1999). A primer on regression artifacts. London: Guilford Press.
- de Leeuw, E. D. (2005). To mix or not to mix data collection modes in surveys. Journal of Official Statistics, 21, 233–255.
- Dillman, D. A., Smith, J. D., & Christian, L. M. (2014). Testing questions and questionnaires. In: Internet, Mail and Mixed-mode Surveys: The Tailored Design Method (pp. 241-249). New York: John Wiley and Sons.
- Dillman, D. A. (2017). The promise and challenge of pushing respondents to the web in mixed-mode surveys. Survey Methodology 43(1), 3-30.
- Dillman, D.A., & Christian, L.M. (2005). Survey mode as a source of instability in responses across surveys. Field Methods, 17 (1), 30-51.
- Dillman, D. A., Phelps, G., Tortora, R., Swift, K., Kohrell, J., Berck, J., & Messer, B. L. (2009). Response rate and measurement differences in mixed-mode surveys using mail, telephone, interactive voice response (IVR) and the Internet. Social science research 38(1), 1-18.
- Fricker, S., Galesic, M., Tourangeau, R., & Yan, T. (2005). An experimental comparison of web and telephone surveys. Public Opinion Quarterly, 69(3), 370-392.
- Holbrook, A. L., & Krosnick, J. A. (2009). Social desirability bias in voter turnout reports: Tests using the item count technique. Public Opinion Quarterly 74(1), 37-67.
- Hooghe, M. & Reeskens T. (2007). Are cross-national surveys the best way to study the extreme-right vote in Europe? Patterns of Prejudice, 41:2, 177-196.
- Lipps, O., & Pekari, N. (2016). Sample representation and substantive outcomes using web with and without incentives compared to telephone in an election survey. Journal of Official Statistics 32(1), 165-186.
- Lipps, O., Pekari, N., & Roberts, C. (2015). Undercoverage and nonresponse in a list-sampled telephone election survey. Survey Research Methods 9(2), 71-82.
- Lubbers, M., Gijsberts, M. and Scheepers, P. (2002). Extreme right-wing voting in Western Europe. European Journal of Political Research, 41: 345–378.
- Mood, C. (2010). Logistic regression: Why we cannot do what we think we can do, and what we can do about it. European Sociological Review, 26(1), 67-82.
- Olson, K. (2013). Do non‐response follow‐ups improve or reduce data quality? A review of the existing literature. Journal of the Royal Statistical Society: Series A (Statistics in Society), 176(1), 129-145.
- Roberts, C., & Vandenplas, C. (2017). Estimating Components of Mean Squared Error to Evaluate the Benefits of Mixing Data Collection Modes. Journal of Official Statistics 33(2), 303-334.
- Sala, E. and Lillini, R. (2014): The impact of unlisted and no-landline respondents on non-coverage bias: The Italian case, ISER Working Paper Series, No. 2014-16, University of Essex, Institute for Social and Economic Research (ISER), Colchester.
- Schouten, B., Cobben, F. and Bethlehem, J. (2009). Indicators for the representativeness of survey response. Survey Methodology 35(1), 101-113.
- Sciarini, P., & Goldberg, A. C. (2015). Lost on the way: Nonresponse and its influence on turnout bias in postelection surveys. International Journal of Public Opinion Research, 29(2), 291-315.
- Selb, P., & Munzert, S. (2013). Voter over-representation, vote misreporting, and turnout bias in postelection surveys. Electoral Studies 32, 186–196.
- Stoop, I. A. (2005). The hunt for the last respondent: Nonresponse in sample surveys. Doctoral dissertation, Social and Cultural Planning Office, The Hague.
- Tourangeau, R. (2017). Mixing Modes. In: Paul P. Biemer, Edith de Leeuw, Stephanie Eckman, Brad Edwards, Frauke Kreuter, Lars E. Lyberg, N. Clyde Tucker, Brady T. West (eds.): Total Survey Error in Practice, Wiley, 115-132.
- Tourangeau, R., & Smith, T. W. (1996). Asking sensitive questions: The impact of data collection mode, question format, and question context. Public opinion quarterly, 60(2), 275-304.
-
Keywords
calibration CATI coverage coverage bias cross-national surveys data linkage data quality European Social Survey experiment face-to-face face-to-face survey Facebook hard to reach populations incentives item nonresponse measurement measurement error mixed-mode surveys multitasking non-probability samples Nonresponse nonresponse bias nonresponse rates paradata PIAAC Probability sample probability samples QR codes rare populations response rate Satisficing social desirability Social media survey survey-taking climate survey data survey management survey methods Telephone survey telephone surveys total survey error unit nonresponse validity web survey Web surveys weighting
