

The Interviewer Performance Profile (IPP): A Paradata-Driven Tool for Monitoring and Managing Interviewer Performance
Research note
Guyer, H.M., West B.T. & Chang W. The Interviewer Performance Profile (IPP): A Paradata-Driven Tool for Monitoring and Managing Interviewer Performance. Survey Methods: Insights from the Field. Retrieved from https://surveyinsights.org/?p=15306
© the authors 2021. This work is licensed under a Creative Commons Attribution 4.0 International License (CC BY 4.0) 
Abstract
Monitoring interviewer performance during data collection is essential for ensuring optimal performance at the interviewer level, thereby leading to improved data collection parameters in areas such as effort and efficiency. Paradata are widely utilized to enhance typical measures of performance, such as response rates, and provide a more nuanced view of interviewer performance characteristics. We describe a paradata tool developed to monitor interviewer performance in real time: the Interviewer Performance Profile (IPP). Daily data updates allow for ongoing monitoring to detect areas of performance concern as well as areas of improvement over time. Additionally, the flexible nature of the IPP facilitates adaptation by other projects. An overview of the tool is provided in addition to several examples of implementation and usage in a national field project.
Keywords
Dashboard, Field studies, Interviewer performance, paradata, Quality control
Acknowledgement
The National Survey of Family Growth (NSFG) is conducted by the Centers for Disease Control and Prevention's (CDC’s) National Center for Health Statistics (NCHS). The data collection included in this paper was performed under contract #200-2010-33976 with University of Michigan’s Institute for Social Research with funding from several agencies of the U.S. Department of Health and Human Services, including CDC/NCHS, the National Institute of Child Health and Human Development (NICHD), the Office of Population Affairs (OPA), and others listed on the NSFG webpage (see http://www.cdc.gov/nchs/nsfg/). The views expressed here do not represent those of NCHS or the other funding agencies. The authors acknowledge the contributions of Alexa Zmich for assisting with the literature review.
Copyright
© the authors 2021. This work is licensed under a Creative Commons Attribution 4.0 International License (CC BY 4.0)
Introduction
The use of paradata to monitor data collection outcomes has become a norm in survey research. Paradata have been used to monitor interviewer performance during interviewer training as well as during data collection. Paradata are also frequently used in static reports and production monitoring dashboards to quickly determine whether data collection parameters are on track or in need of intervention (Groves and Heeringa, 2006). There are many benefits and goals of these types of dashboards, including improving efficiency, identifying areas of concern and improvement, identifying poor performers, minimizing non-response error, reducing or controlling costs, and achieving the study outcomes. Paradata monitoring tools can be utilized by field managers as well as research staff and clients, providing the same information to all team members to ensure productive discussions, prompt decision-making, and improvement of data collection outcomes. The use of paradata dashboards is considered a best practice by many survey methodologists (Mohadjer and Edwards, 2018).
The focus of this report is on paradata-driven tools for monitoring and improving interviewer performance. Such tools have evolved over the past several decades and have been utilized to assess various types of performance. Groves and McGonagle (2001) utilized interviewer training data to develop a tool to predict future cooperation rates of individual interviewers. Durand (2005, 2008) developed the “Net Contribution to Performance Index (NCPI)”, in which interviewers received a score that took the difficulty of the task being measured into consideration. Laflamme and St-Jean (2011) further developed the NCPI by including “objective interviewer performance indicator that takes into account the complexity of the survey data process.” This progression demonstrated the need to account for project and task difficulty when measuring interviewer performance. West and Groves (2013) continued this line of work and developed a novel measure of interviewer performance taking into account the difficulty of the assigned sample or achieving the outcome itself to compute an interviewer-specific Propensity-Adjusted Interviewer Performance (PAIP) Score. PAIP scores can be used to evaluate their difficulty-adjusted effectiveness in terms of various key parameters, including contact rates, response rates, and eligibility rates.
The progression of tools for monitoring interviewer performance has been accompanied by an increase in the number of variables being measured. Early on, Sudman (1967) found that simpler reporting approaches worked best. Field supervisors are the first in line to assess interviewer performance and tend to be the most accurate people when evaluating interviewers’ quality over time. The EPIC-German study evaluated interviewer performance using in-depth qualitative and quantitative measurements of quality control from direct observations which were then coded into performance scores (Kroke, Bergmann, Lotze, Jerckel, Klipstein-Grobusch, and Boeing, 1999). Guyer and Wagner (Guyer 2004; Wagner and Guyer, 2005) found that statistical processing reports with highlighting to indicate poor performers versus good performers were useful visual tools for managers. Work conducted by Olson and Bilgen (2011) suggests that many typical indicators of good interviewer performance, such as faster interview pace, may lead to higher levels of acquiescence from respondents than the pace typically exhibited in a less experienced interviewer, or one that has longer-running interviews.
In this paper, we describe a robust and dynamic tool for monitoring interviewer performance over time that builds on these prior efforts and provide specific examples of its use on a national field study.
Methods
The National Survey of Family Growth’s Interviewer Performance Profile (IPP)
The IPP was developed for a national survey of reproductive health, the National Survey of Family Growth (NSFG). The NSFG is a cross-sectional population-based survey on factors affecting pregnancy and childbearing including contraception, sexual activity, marriage, divorce and cohabitation, as well as services relating to pregnancy, infertility and reproductive health in the United States. A national probability sample frame is used to select approximately 5,200 addresses on a quarterly basis. Sampled households are screened and an age-eligible (15-49 years old) household member is selected and invited to complete an interview. All interviews are conducted in-person by female interviewers. Given the continuous nature of the data collection (2006-2010, 2011-2019), data exists to compare current performance to previous quarters, years and cycles of data collection. Approximately 45 interviewers are employed on the study each year. Annual trainings take place for newly hired interviewers whereas existing interviewers simply continue from one year to the next if their geographic area is in the study in sequential years. Each year, approximately 40-45% of the interviewers are new to the project and to the survey organization. The IPP allows the project team to monitor interviewer performance on a daily basis among both new and experienced interviewers and identify specific areas where additional training or guidance may be necessary in order to improve performance. Additionally, post-training changes in performance can be tracked in the IPP.
A birds-eye view of the IPP is provided in Figure 1. The four main areas of performance are indicated, with one column for each parameter evaluated and one row per interviewer. This visual display allows for both a quick visual evaluation of interviewers that are performing well or performing poorly for any given indicator (e.g., main interview response rates, conditional on completed screening interviews) as well as to evaluate interviewers that are performing well in numerous areas versus those that are struggling in numerous areas. In addition to quickly evaluating interviewer or parameter performance, an overall indication of the key areas where additional reinforcement may be needed are easily identified. The IPP is a dynamic Excel file with data displayed to assess performance in four main areas: key performance indicators, Propensity-Adjusted Interviewer Performance (PAIP) scores, data quality indicators and data set balance.
Key Content Areas of the IPP
Four areas of performance are assessed in the IPP:
- Key Performance Indicators (KPIs) evaluate the criteria necessary for the success of the project and provide a means of evaluating individual interviewers as well as the overall project. KPIs included in the IPP to evaluate interviewer effort are: total hours worked to date, hours worked by work type (travel, administrative), hours per completed interview (HPI), interview yield, response rates and eligibility rates. These indicators represent the cumulative performance in the current quarter, as they are calculated based on the cumulative measures from the start date of current quarter to the day before the report was populated. However, the time reference could be adapted to fit the study’s objectives (e.g., a full year of data collection).
- Propensity-Adjusted Interviewer Performance (PAIP) Scores evaluate the effectiveness of the interviewer by incorporating model-based expectations of the difficulty of the tasks (West and Groves, 2013). PAIP scores are generated for each interviewer and displayed for interview completion, eligibility and contact.
- Data Quality Indicators evaluate the quality of the data collected by the interviewer. CAPI was employed by NSFG using Blaise data collection software. Audit trail data captured each key stroke made by the interviewer during each interview, and the time spent between fields. These data was stored and used to create indicators to monitor data quality. Raw indicators include the average time spent on survey questions, the frequency of using help screens, recording remarks, checking errors, backing up during the interview, and the frequency of “don’t know” and “refuse” responses. Principle component analysis (PCA) was used to identify common correlations of these measures and reduce the dimensionality of the data, and three factors were identified as data quality indicators: questions being read too quickly, a high proportion of error checks, and a high proportion of refused or don’t know responses (Gu et al., 2013).
- Data Set Balance Indicators provide proxy indicators of non-response bias by examining differences between respondents and non-respondents in terms of key study characteristics.
The data within each performance area is displayed in a heat map format, with gradient coloring (shades of bright green to bright red) to identify positive versus negative performance at a quick glance (Figure 1). Yellow-shaded cells indicate the median value among all interviewers for that specific indicator, whereas green shading indicates positive performance and red shading indicates poor performance. If a larger value of an indicator means better performance (e.g. response rates), then the cell that holds maximum value is highlighted in green and the cells that hold a minimum value are highlighted in red. All other cells are colored proportionally. For indicators in which a smaller value indicates better performance, green and red are coded in reverse while still providing an indicator of poor performance versus good performance. A more extensive review and discussion of each of these components is described in the supplemental materials and in recent conference proceedings (West, Guyer, Chang AAPOR 2020).
Figure 1. Interviewer Performance Profile (IPP)

Statistical Processing Steps
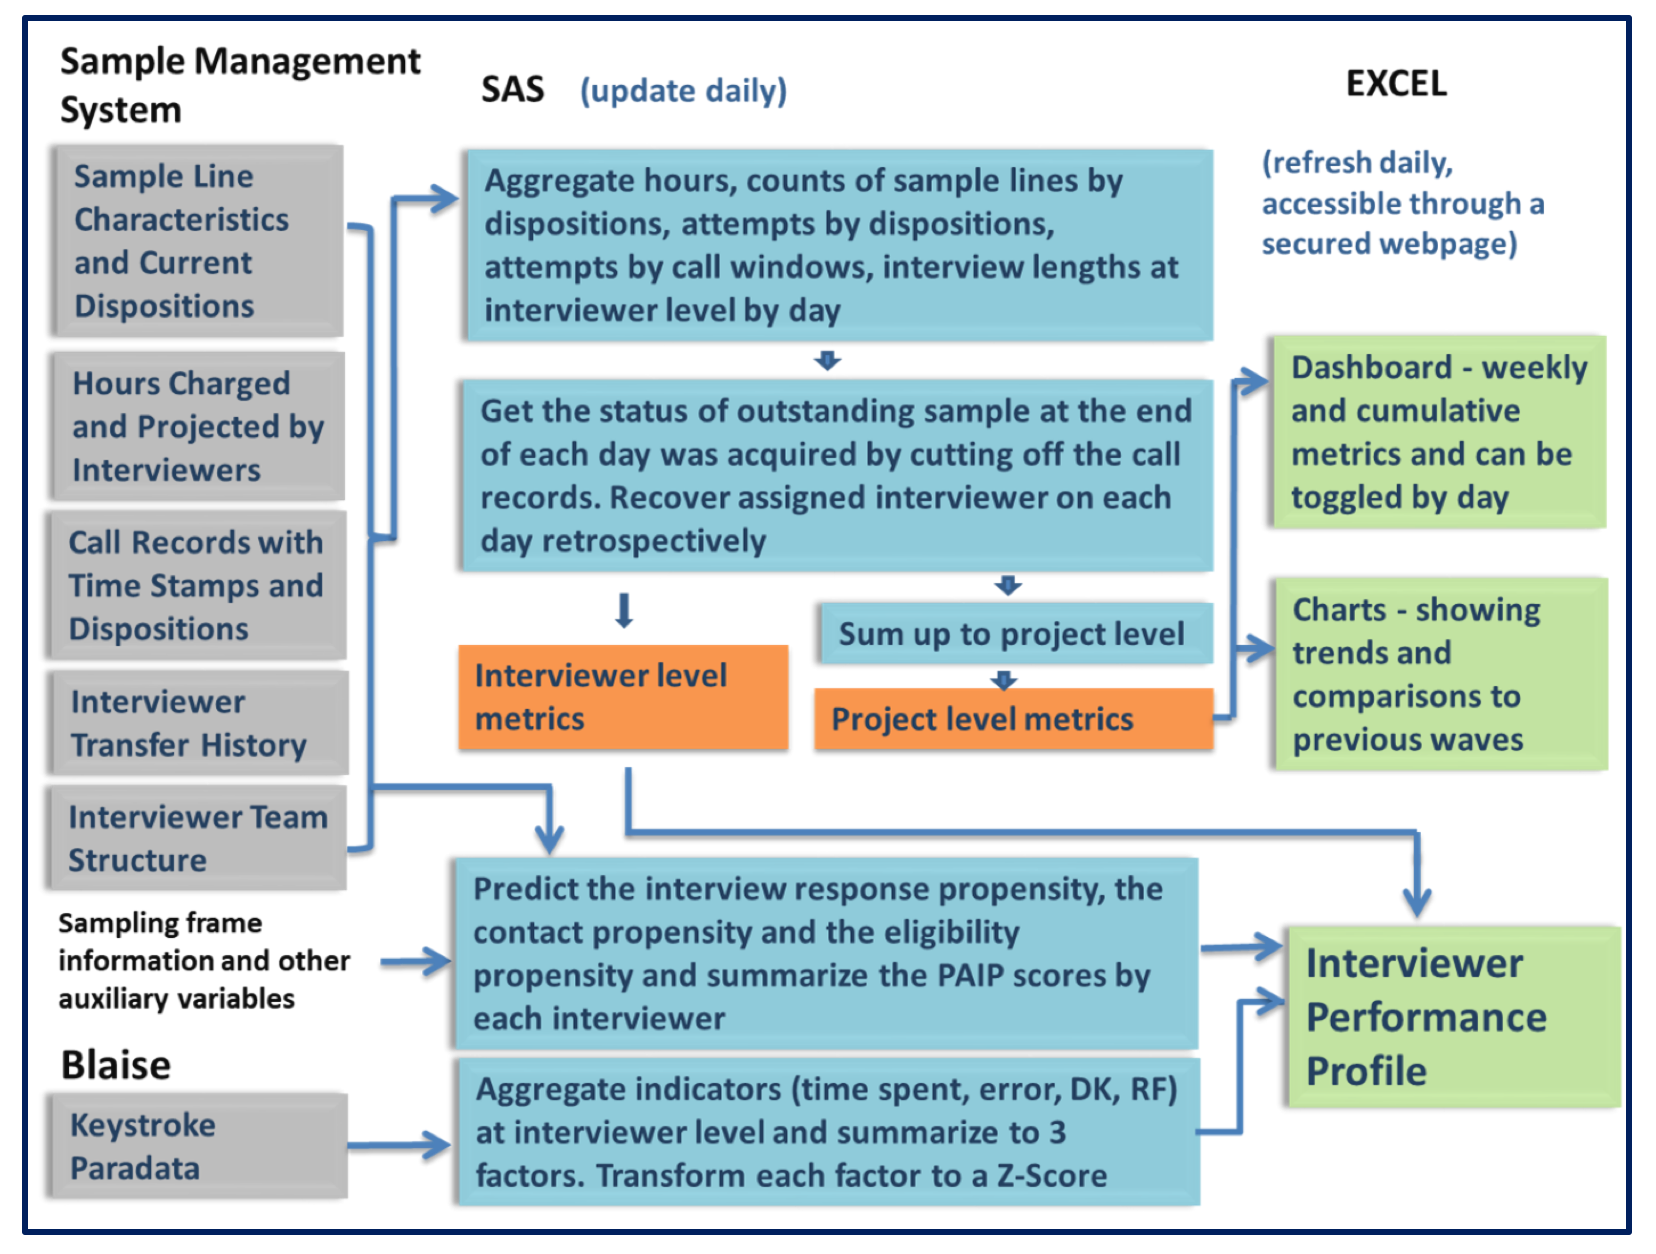
The statistical processing steps are shown in Figure 2. Data was extracted from several data tables derived from the sample management system including a sample table, an effort table, and a table with sample outcomes as measures of productivity. Once each of the data sets are compiled, they were then combined into a single file and the daily and cumulative metrics are calculated for each interviewer as described above. For comparison purposes, the data are also summed at the project level to determine the proportion or average of each indicator at the project level by day. The variables were then placed in the order needed for the charts to evaluate the four performance areas. The statistical software package SAS v9.4 (Cary, NC) was used to process the data utilized in the IPP and to export the IPP data to Excel.
Figure 2. IPP Data Flow
IPP Case Studies
The IPP can be used to evaluate performance at a single point in time as well as to track improvements in performance after interventions occur. Interventions may include covering topics on team calls or in emails to the full study team if performance issues seem widespread, such as low response rates with specific subgroups of cases, high hours per complete for the quarter, or increased resistance rates. We now provide examples of performance indicators that led to concerns, the interventions that occurred, and the performance following the intervention as compared to the initial performance indicators observed.
Table 1 displays results for six interviewers, A-F, at three different points in time as indicated in the second column “Week” (week of the quarter). The total hours worked through that week are displayed as well as the number of completed screener and main interviews, the cumulative hours per interview (HPI) at that point in time, the eligibility rate, the screener response rate (Screen RR) and the main interview response rate (Main RR). Areas of concern for each interviewer are highlighted in red, whereas areas of positive performance are highlighted in green. It should be noted that the data displayed in the table are fictitious in order to preserve interviewer anonymity. The case studies illustrate similar scenarios that have occurred while using the IPP yet merely serve as examples of the various ways in which the IPP can be used.
Table 1. Case Study Examples
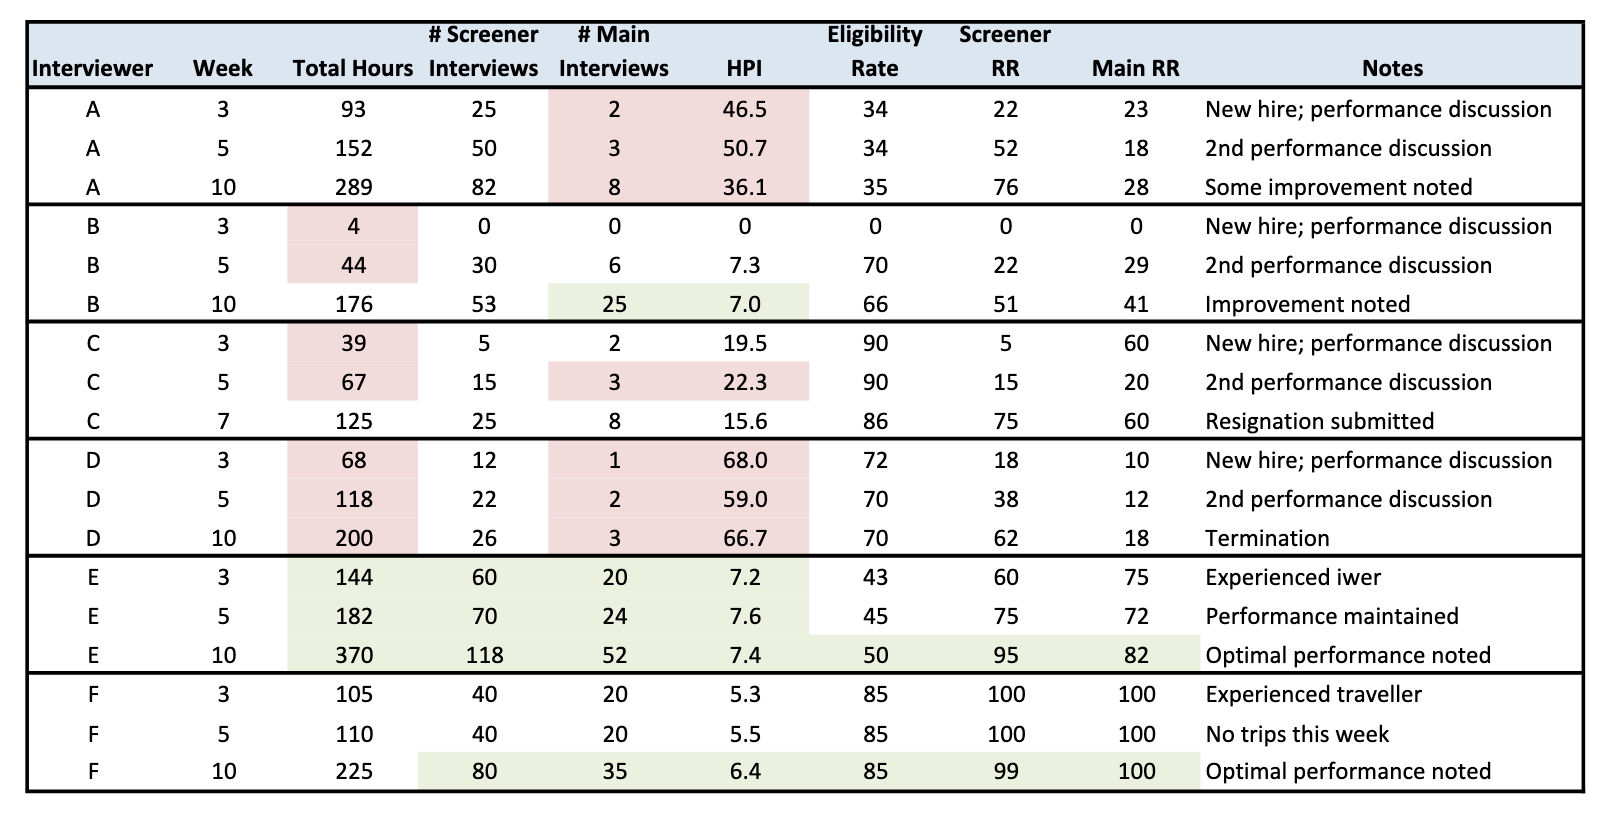
HPI: Hours per Interview; RR: Response rate
Interviewer A
This was a new interviewer who started on the NSFG for the first time in this quarter. By the third week of the quarter, the interviewer had worked 93 hours. NSFG interviewers are required to work 30 hours per week, so the level of effort, in terms of hours charged, was appropriate. The number of completed screening interviews was 25. At a 34% eligibility rate, nine eligible main respondents would have been identified. However, main interviews had only been completed with two of the nine, thus her HPI was extremely high (46.5 compared to project average of 10.6). A performance discussion with this interviewer took place at the end of week 3. No improvement was observed two weeks later in week 5. This interviewer appeared to be focusing on screening rather than conducting main interviews. A second performance discussion took place in week 5. By week 10, some improvement was observed: six additional main interviews had been completed, thus lowering her HPI, and she continued to focus on interviewing. This interviewer showed some improvement with additional coaching in the first quarter and was retained on the project. Her supervisor continued to monitor her performance.
Interviewer B
This was also a new interviewer who started on the NSFG this quarter. By week three, the interviewer had only worked four hours and had not conducted any field work. A performance discussion took place with this interviewer during week 3. By week 5, she had started working, although still not at the level required. However, her effort and productivity was on track and her HPI was quite good. Despite these outcomes, a performance discussion was held with the interviewer in week 5 as she was not yet working the required number of hours. This interviewer’s performance had improved significantly in all areas by week 10. In fact, she showed strong potential in completing main interviews and maintaining a low HPI. With some additional coaching in the first quarter, this new interviewer is now well on her way to a successful new career.
Interviewer C
This was a new interviewer who started on the NSFG this quarter as well. A performance discussion was held in week 3 as she was not meeting the requirement of working thirty hours per week and her production outcomes were low for this point in time. By week 5, her productivity had declined further. She was not working the required number of hours and was thus unable to achieve an acceptable level of productivity. A second performance discussion took place in week 5. This interviewer resigned in week 7.
Interviewer D
This was also a new interviewer who had performance discussions with her supervisor in weeks 3 and 5 due to low performance and working an insufficient number of hours. Her performance did not improve over the ten week period despite receiving additional coaching and performance improvement notifications. This interviewer was terminated from the project in week 10. Although she did complete some work, she would be a risk to the project were she to continue and would incur increased project costs related to monitoring and coaching without showing the improvements (no/low return on investment).
Interviewer E
This experienced interviewer was a high-performing interviewer who had worked on the project for more than five years prior to the current year of data collection. She had consistently high performance in completing the screener and main interviews, maintained her hourly commitment, and consistently had a lower than average HPI. This interviewer did not require additional coaching or performance discussions, nor did she introduce increased cost to the project. Instead, she was able to provide guidance to new, less experienced interviewers and her efficiency led to decreased project costs.
Interviewer F
This experienced interviewer had inconsistent performance in the first five weeks of the quarter as she did not have any sample in her area. Instead, she travelled to other areas to conduct interviews in situations where the local interviewer was on leave or was unable to work their full sample load, as well as to unstaffed areas (e.g., due to interviewer attrition) and always completed her assigned sample while traveling. However, only interviewers with historically good performance indicators are eligible to work as “travelers”. The primary goal of the traveler is to be as efficient as possible in the weeks that they are traveling. This interviewer maintained high levels of productivity and a low HPI and maintained her status as a high performer by the end of the quarter.
Conclusion/Discussion
As these examples show, the IPP is a useful tool for both the interviewer as well as the project team. The IPP is a management tool, enabling the evaluation of numerous performance metrics across multiple interviewers simultaneously. It allows managers to identify areas of concern, intervene, and monitor outcomes, contributing to the overall success of the project. The IPP allows interviewers who are struggling to receive additional coaching and to improve their performance, thus providing employment stability. Additionally, the IPP highlights interviewers with exceptional performance and allows those interviewers to be recognized and to contribute to the coaching of new interviewers to ensure their long-term success as well.
The dynamic nature of the IPP has allowed for the integration of new measures over time. While there is an initial investment at the start of a project in defining the elements to monitor and the paradata needed to develop the IPP, this investment can lead to cost reductions in key areas of production over the course of the study. For example, identifying and intervening with interviewers with low response rates or high HPIs can lead to reduced costs and improved production parameters, if detected early enough and if the interventions are successful. The IPP can aid in early detection and tracking of intervention outcomes. Additionally, once the tool is developed, it can be further refined and adapted for other studies as well. As in previous reports, the use of heat maps allows for the identification of positive versus negative performance at a quick glance. The reviewer can then dig deeper to determine the cause of the poor performance and develop an action plan. We have found the dynamic IPP to be incredibly useful in monitoring interviewer performance, identifying areas for improvement, and tracking changes over time.
The IPP is a useful tool for studies that are smaller or more narrow in size and scope—such as the number of interviewers, cases, or parameters measured– as well as those that are larger in size or scope. A minimum number of cases is not required in order for the tool to be useful. Instead, the key is providing the sample sizes for which the indicators are based to allow the managers to make decisions as to whether to put weight on the values of the indicators. The indicators are meant to be reviewed together with other indicators on the report. Instead of voiding the indicators due to a small number of cases, we suggest reporting the denominators of the rates that tend to have a smaller sample size on the report and allowing managers to use the information accordingly. The indicators are color-coded based on the standard deviation of the mean of all interviewers to help identify the outliers of each indicator. Thus, the IPP helps to provide a quick glance at all perspectives of each interviewer compared to other interviewers. This approach can be used for larger studies as well where the performance of all interviewers can be assessed in comparison to the full team, or subgroups of interviewers or cases can be assessed separately. For example, the performance of a regional teams of interviewers could be compared to the other interviewers within the team to determine those who are excelling in that specific geographic region and those who may need additional training or guidance. Additionally, subsets of cases could be evaluated, such as by sample release or other indicators of key sample characteristics such as cohort, age, or sample source.
Our work as survey researchers must continue to adapt to both changes in technology and provide new views of the available data to ensure efficient data collection and successful outcomes. The utility of paradata to measure and monitor these trends, and the visual display of data, will continue to expand over time. The IPP is an easy tool for both methodologists and managers to use to increase productivity and efficiency while also decreasing costs, measurement error and non-response error.
Appendix
References
- Biemer, P., Herget, D., Morton, J., and Willis, G. (2000). The feasibility of monitoring field interview performance using computer audio recorded interviewing (CARI). Proceedings of the American Statistical Association’s Section on Survey Research Methods, pp. 1068-1073.
- Durand, C. (2005). Measuring Interviewer Performance in Telephone Surveys. Quality and Quantity. 39. 763-778. 10.1007/s11135-004-6781-0.
- Durand, C. (2008). Assessing the Usefulness of a New Measure of Interviewer Performance in Telephone Surveys. Public Opinion Quarterly. 72(4)741-752.
- Groves, R.M. and Heeringa, S.G. (2006). Responsive design for household surveys: tools for actively controlling survey errors and costs. Journal of the Royal Statistical Society: Series A (Statistics in Society), Vol. 169 No. 3, pp. 439-457.
- Groves, R.M., and McGonagle, K. (2001). A Theory-Guided Interviewer Training Protocol Regarding Survey Participation. Journal of Official Statistics, 17(2): 249-266.
- Gu H., Couper M., Kirgis N., Parker S., and Buageila S. (2013). Using Audit Trail Data for Interviewer Data Quality Management. AAPOR 2013 Annual Meeting Proceedings.
- Guyer, H. (2004). How can we predict and plan for successful contact attempts? International Field Directors and Technologies Conference (IFDTC 2004). Scottsdale, AZ.
- Kroke A., Bergmann M.M., Lotze G., Jeckel A., Klipstein-Grobusch K., Boeing H. (1999). Measures of Quality control in the German component of the EPIC study. Annals of Nutrition and Metabolism 43:216–224.
- Laflamme, F. and St. Jean, H. (2011). Proposed indicators to assess interviewer performance in CATI surveys. Proceedings of the Survey Research Methods of the American Statistical Association, Joint Statistical Meetings, Miami, Florida, August 2011.
- Mockovak, W., Yu, A., Earp, M. (2015). Using Calibration Training to Assess the Quality of Interviewer Performance. Bureau of Labor Statistics (BLS).
- Mohadjer, L. and Edwards, B. (2018). Paradata and dashboards in PIAAC. Quality Assurance in Education, 26(2), 263-277.
- Olson, K. M., & Bilgen, I. (2011). The role of interviewer experience on acquiescence. Public Opinion Quarterly, 75(1), 99-114.
- Powell, M.B., Cavezza, C., Hughes-Scholes, C., and Stoove, M. (2010). Examination of the consistency of interviewer performance across three distinct interview contexts. Psychology, Crime & Law, 16:7, 585-600
- Sudman, S. (1967). Quantifying interviewer quality. Public Opinion Quarterly. 30(4), 1967. 664-667.
- Wagner, J., & Guyer, H. (2005). Statistical propensity models to predict likelihood of survey response compared to interviewer judgments of likelihood of response. Midwest Association for Public Opinion Research. Chicago, IL.
- Wagner, J., West, B. T., Kirgis, N., Lepkowski, J. M., Axinn, W. G., Ndiaye, S. (2012). Use of paradata in a responsive design framework to manage a field data collection. Journal of Official Statistics 28:477–99.
- West, B.T., Groves, R.M. (2013). A Propensity-Adjusted Interviewer Performance Indicator. Public Opinion Quarterly. 77(1), 2013. 352-374.
- West, B. T., Kreuter, F. A practical technique for improving the accuracy of interviewer observations: Evidence from the National Survey of Family Growth. 2015. Field Methods 27(2) 144-162.
- West, B. T., Guyer, H.M., Chang, W. Using Paradata to Develop and Implement an Interviewer Performance Profile for Monitoring and Evaluating Interviewer Performance. AAPOR 2020 (Virtual Conference Presentation).
-
Keywords
calibration CATI coverage coverage bias cross-national surveys data linkage data quality European Social Survey experiment face-to-face face-to-face survey Facebook hard to reach populations incentives item nonresponse measurement measurement error mixed-mode surveys multitasking non-probability samples Nonresponse nonresponse bias nonresponse rates paradata PIAAC Probability sample probability samples QR codes rare populations response rate Satisficing social desirability Social media survey survey-taking climate survey data survey management survey methods Telephone survey telephone surveys total survey error unit nonresponse validity web survey Web surveys weighting
