

The Randomized Overclaiming Method (ROME): A paradigm for assessing the validity of social desirability reduction techniques using objective measures
Schnapp, P. (2023). The Randomized Overclaiming Method (ROME): A paradigm for assessing the validity of social desirability reduction techniques using objective measures. Survey Methods: Insights from the Field. Retrieved from https://surveyinsights.org/?p=15753 The preregistration, data set, syntax (code), and replication materials for the empirical analyses are available at https://doi.org/10.3886/E122741V2.
© the authors 2023. This work is licensed under a Creative Commons Attribution 4.0 International License (CC BY 4.0) 
Abstract
The reduction of socially desirable responding (SDR) is a central aim of methodological research. Researchers have hence spent considerable energy trying to find techniques which reduce socially desirable responding. Advances in this field are hampered by the fact that the effectiveness of such techniques is hard to assess because measures of the true values for the variables in question are often unavailable. The present paper presents a method that helps overcome this obstacle, the Randomized Overclaiming Method (ROME). It employs a knowledge questionnaire, measures SDR as the number of non-existent items claimed as known and randomizes respondents into a control group or at least one treatment group in which an SDR reduction technique is used. The use of the ROME is demonstrated with a small preregistered study that finds no significant effect of a combination of appeals to honesty and forgiving wording on respondents’ claims to know non-existent English words. Perspectives for using the ROME are discussed.
Keywords
appeals to honesty, counterbiasing, forgiving wording, Randomized Overclaiming Method, social desirability, socially desirable responding
Acknowledgement
I am grateful to Alicia Bude and Sven Seibold for help regarding the narcissism scale, Kristin Lemhöfer and Tatsuya Nakata for providing in-depth information about their uses of the LexTale test, and associate editor Bernd Weiss and an anonymous reviewer for valuable comments on earlier drafts of this article. Opinions expressed in this article are solely my own and do not express the views or opinions of my employer.
Copyright
© the authors 2023. This work is licensed under a Creative Commons Attribution 4.0 International License (CC BY 4.0)
1. Introduction
When answering survey questions, respondents often exhibit socially desirable responding (SDR), “the tendency to give overly positive self-descriptions” (Paulhus, 2002, p. 50). This phenomenon threatens the validity of both univariate statistics and measures of association (Wolter & Preisendörfer, 2013, p. 322). Consequently, researchers have long used questions that employ SDR reduction techniques such as suggesting that the characteristic in question is exhibited by many people (Barton, 1958). So far, these attempts have been met with limited success, and SDR reduction remains an active area of research (e.g., Harling et al., 2021; Hibben et al., 2022; Wolter & Preisendörfer, 2020).
Part of the reason for this limited success may be that the effectiveness of SDR reduction techniques is hard to study. Ideally, researchers would be able to compare a respondent’s answer regarding a characteristic to a criterion measure displaying the true value of this characteristic (Höglinger & Jann, 2018; Preisendörfer & Wolter, 2014, p. 127). While studies of this type exist, their number is limited, as true values for the characteristic in question are often unavailable. When they are available, the criterion measures themselves may be measured with error (e.g., Boon et al., 2010, pp. 744-745; Cassel, 2004; Lu et al., 2008, p. 86), which makes the comparison with questionnaire-derived values less informative.
Hence researchers studying social desirability bias have usually relied on the more-is-better/less-is-better assumption. It states that when two approaches to asking about an undesirable (desirable) characteristic are compared, the one that results in higher (lower) estimates for the characteristic is to be preferred (Krumpal, 2013, p. 2033). While this assumption is “often plausible, it is still just an assumption” (Tourangeau & Yan, 2007, p. 863) and any conclusions drawn on its basis hence come with considerable uncertainty attached (Höglinger & Jann, 2018, p. 3). Even if we were to believe the assumption and prefer one estimate of a characteristic over another, we still would not know how far the preferred estimate is from the truth. Moreover, if an SDR reduction technique is successful in moving carriers of an undesirable characteristic from not reporting this characteristic to reporting it, the technique may also move some non-carriers from not reporting to reporting (Diekmann, 1996, pp. 384-385). This is not implausible given that some studies found that noteworthy proportions of respondents underreported desirable or overreported undesirable characteristics (Kreuter et al., 2008; Wyner, 1980).
Recognizing this, Höglinger & Diekmann (2017) recently argued that researchers “must stop relying blindly on the more-is-better assumption and explicitly consider the possibility of false positives” (p. 136). To this end, they suggested the use of “zero-prevalence items” in the study of SDR. These are items that no truthful respondent can answer in the affirmative and which hence can be used to detect overreporting without the need for the researcher to obtain measures of the true values. However, finding feasible zero-prevalence items is not trivial. Items used so far include having received a donated organ and suffering from rare diseases (Höglinger & Diekmann, 2017; Schnapp, 2019; Wolter & Diekmann, 2021). The true prevalence of these items is not exactly zero and they are not obviously socially undesirable or desirable.
This article hence presents a method which allows researchers to assess the effectiveness of SDR reduction techniques by including a large number of credible but non-existent zero-prevalence items in a survey. The Randomized Overclaiming Method (ROME) uses a questionnaire that tests respondents’ knowledge of a number of items and mixes existing items, called reals, with non-existing items, called foils. Respondents are randomly assigned either to a control condition or a treatment condition which uses some SDR reduction technique. The number of foils claimed serves as a measure of SDR. If the treatment condition yields significantly fewer foils claimed than the control condition, it may be concluded that the SDR reduction technique was effective. Also, in contrast to studies using the more-is-better/less-is-better assumption, the amount of SDR in all conditions can be quantified precisely and without the need to collect additional data.
The number of foils claimed can serve as a valid measure of SDR under two assumptions: First, the respondents cannot truly know the foils; second, it is desirable for respondents to claim knowledge of the foils. The second assumption may often be debatable. In a discussion of overclaiming, Paulhus (2011) argued that “people do not invest their egos in knowledge about topics that are irrelevant (or in opposition) to their identities” (p. 156). This jibes well with a perspective on desirable responding which interprets “normative behavior overreporting […] as the enactment of a salient identity” (Brenner, 2012, p. 422). If these views are right, we should expect desirability effects on overclaiming primarily when being knowledgeable about the topic of the questionnaire is important to a respondent’s identity (or the respondent has an extrinsic incentive to overclaim). Hence, the ROME attempts to ascertain that respondents are selected such that they deem claiming knowledge of the items in question desirable.
The method builds on previous research. The use of overclaiming questionnaires as measures of socially desirable responding was popularized in psychology by Paulhus et al. (2003), who drew on earlier work (Phillips & Clancy, 1972; Randall & Fernandes, 1991; Stanovich & Cunningham, 1992). This line of research studies the association of overclaiming measures with measures of personality. However, following Paulhus et al. (2003), the majority of such studies has measured “overclaiming” as the general tendency to claim knowledge of any items (reals and foils), while only a minority has used measures of genuine overclaiming based on foils only. The latter body of research has found that genuine overclaiming is often positively associated with extraversion and openness to experience (Dunlop, Bourdage, de Vries, Hilbig et al., 2017; Dunlop, Bourdage, de Vries, McNeill et al., 2020, Study 1). Evidence on associations with other dimensions of personality is more scant, less consistent, or shows null results (Barber et al., 2013; Bertsch, 2009; Bing et al., 2011; Calsyn et al., 2001; Dunlop et al., 2017; Dunlop et al., 2020; Franzen & Mader, 2019; Ludeke & Makransky, 2016; Mesmer & Magnus, 2006; Schoderbek & Deschpande, 2011).
A previous study by Calsyn et al. (2001) used a design quite similar to the ROME. These researchers studied respondents’ tendencies to claim knowledge of social services agencies that did not exist and randomly assigned participants, drawn from the general population, to conditions. It was found that warning respondents that the list of agencies presented would contain foils significantly reduced overclaiming, while providing them with a memory retrieval strategy did not.
The Calsyn et al. (2001) design differs from the ROME in that it was not ensured that respondents were matched to the topic such that they would deem claiming knowledge of the items desirable. Had this been done, one might have expected larger treatment effects. Perhaps more importantly, judging from citations, this paper has made no impact on survey methodology research – which is unsurprising given that it was published in a journal not typically read by survey methodologists (Evaluation Review) at a time well before the recent increase in interest in objective criterion measures of undesirable behaviours.
The present paper hence demonstrates the use of the ROME by means of a small study of an SDR reduction technique. An overclaiming questionnaire was used which mixed real and fake English words and asked respondents whether they knew them. Respondents were selected such that they were not native speakers of English but proficiency in English was important to them. They were randomized into a control or a treatment group. Measures of traits that have been shown or seemed likely to correlate with overclaiming were also collected to control for remaining imbalances between the treatment and the control group in multiple regressions.
The SDR reduction technique used for this demonstration is a combination of forgiving wording and appeals to honesty. Most previous studies of appeals to honesty and forgiving wording using the more-is-better-assumption have found mostly null or mixed results (Brener et al., 2004; Catania et al., 1996; Contzen et al., 2015; Holtgraves et al., 1997; Näher & Krumpal, 2012; Ong & Weiss, 2000; Persson & Solevid, 2014). However, in the single randomized study of the effect of appeals to honesty (Brener et al., 2004), the appeal may have been overlooked by many respondents (p. 99) as it was placed on the cover page of a paper questionnaire (p. 94). If not overlooked, it may have caused reactance in some of the adolescent respondents, given that it was printed in italics and the wording was bordering on the impolite (“It is extremely important that you tell the truth when answering the questions”, Brener et al., 2004, p. 94). Hence, it may have caused some respondents to report more honestly (as intended) and others to report less honestly (due to reactance), with the effects cancelling each other out. As for forgiving wording, there are also studies reporting the expected effect (Acquisti et al., 2012, Study 1; Raghubir & Menon, 1996, Study 1). It hence seems premature to declare either technique ineffective.
Moreover, it was reasoned that the combination of the two techniques might be particularly effective. Appeals to honesty aim to instil in respondents a positive motivation to tell the truth. Forgiving wording aims to remove a barrier to telling the truth. It hence seemed probable that the combination of the two techniques would lead to more honest answers. Note that the study’s design does not allow for distinguishing between main and interaction effects of forgiving wording and appeals to honesty, but only allows for assessing the combination of the two. Readers are also asked to keep in mind that the main motivation for the present article was not the study of this combination of techniques but rather to demonstrate how the ROME may be used to study the efficacy of a given SDR reduction technique. The value of this demonstration is independent of the specific results regarding the effectiveness of the specific SDR reduction technique studied.
2 Data and methods
2.1 Preregistration
Data collection stopping rules, inclusion/exclusion criteria, hypotheses and data analyses were preregistered. Deviations from the preregistration are noted in section 2.6 below.
2.2 Participants and Procedure
A German-language online survey was programmed in SoSci Survey (Lehner, 2019a). All questions had to be answered to proceed to the next page of the questionnaire. Data were collected via SurveyCircle, a German language online platform where participants can collect points by filling in surveys. The more points a participant collects, the more points others will collect when filling in a survey this participant posts. The sample thus drawn is not representative of an identifiable population. As no invitations were sent, no response rate can be calculated.
The survey was posted under the description “Recognition of English words” and users were invited to participate if they had at least “good” knowledge of English, were native speakers of German but not English and were aged 18-49.[1] Respondents could continue from the first page only if they confirmed that they fulfilled the inclusion criteria and agreed to the use of their data for the stated research purposes.
The first pages of the questionnaire asked respondents about sociodemographics and proficiency in German and English. Respondents who did not meet the eligibility criteria, according to their answers, were redirected to an exclusion page which stated they did not fulfil these criteria and thanked them for their interest.
The next five pages comprised of an introductory page and 4 pages with 5 items each measuring how important it was for respondents to speak English well and 5 personality constructs.
The following page introduced the section on English vocabulary in general and the practice section in particular. It informed respondents about the task and the fact that there would be 3 practice items. Invisible to respondents, this page also contained the randomization device.
After the three practice items, participants were taken to another text page introducing the “actual questions on word recognition”. It was followed by 30 items (reals and foils), a text page informing participants they had reached the midpoint of the word list, and 30 more items. One item was presented per page. Respondents were taken to the next page upon indicating whether they knew the word by clicking “yes” or “no”. All pages contained a “back” button.
Another text page informed respondents they had reached the end of the word list and there would be one more question. It was displayed on the next page and asked whether respondents had filled in the questionnaire before. A final page debriefed respondents and contained the code participants needed to collect points.
2.3 Treatment
Respondents were randomly assigned to either the control or the treatmet condition. The treatment consisted of a combination of appeals to honesty and forgiving wording. Four kinds of pages differed between the treatment and control conditions.
Figure 1
Introductory page to the main part of the word recognition task
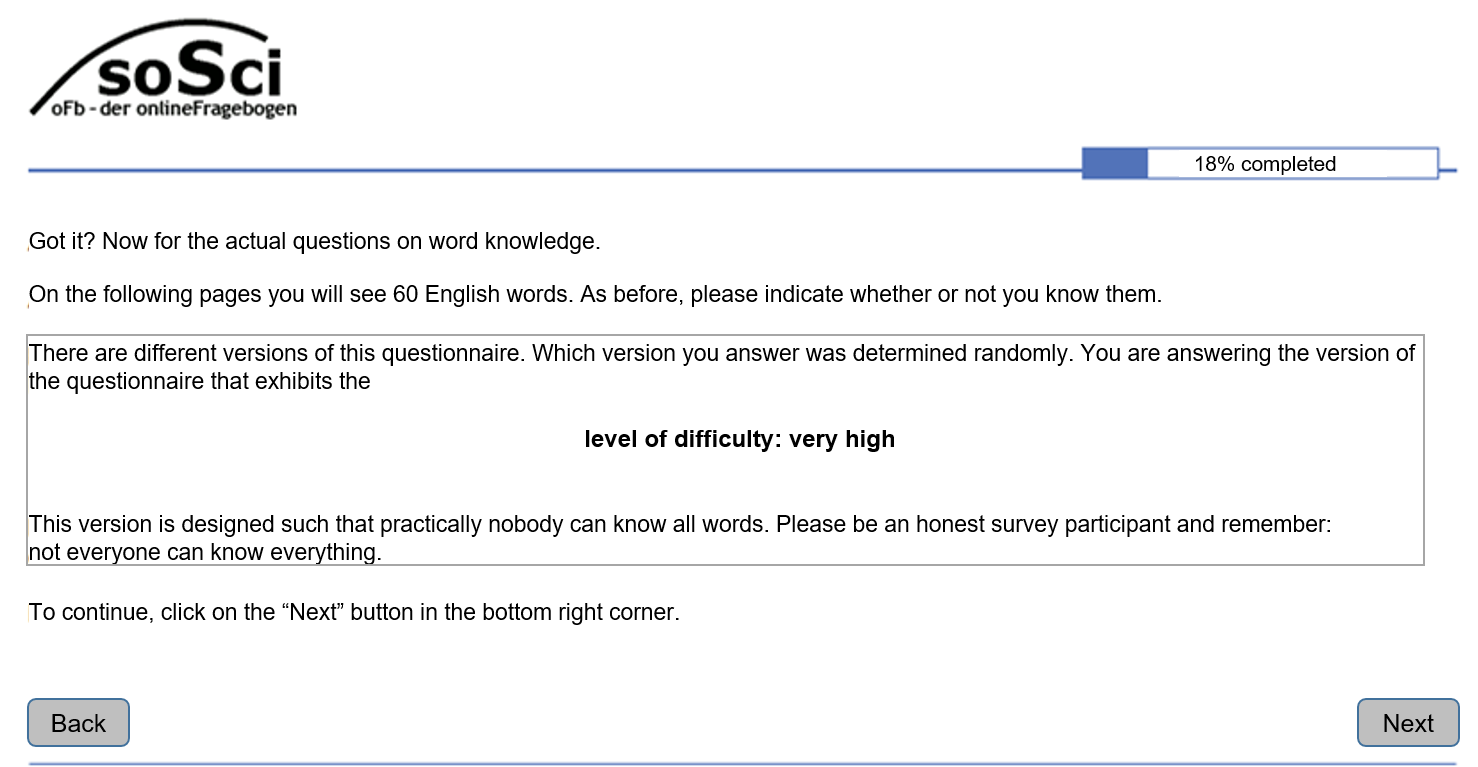
Note. Translated from the original German. Text within the grey box was included only in the treatment condition and missing in the control condition; the screens displayed to respondents did not contain any such boxes.
On the introductory page to the main part of the word recognition task (figure 1), respondents in the treatment condition were informed that they were answering a version of the questionnaire that exhibited the “level of difficulty: very high” (forgiving wording), meaning that practically nobody can identify all words correctly (forgiving wording). They were also asked to be an honest survey participant (appeal to honesty) and “remember: not everyone can know everything” (forgiving wording).
Figure 2
Page displayed at the midpoint of the main part of the word recognition task
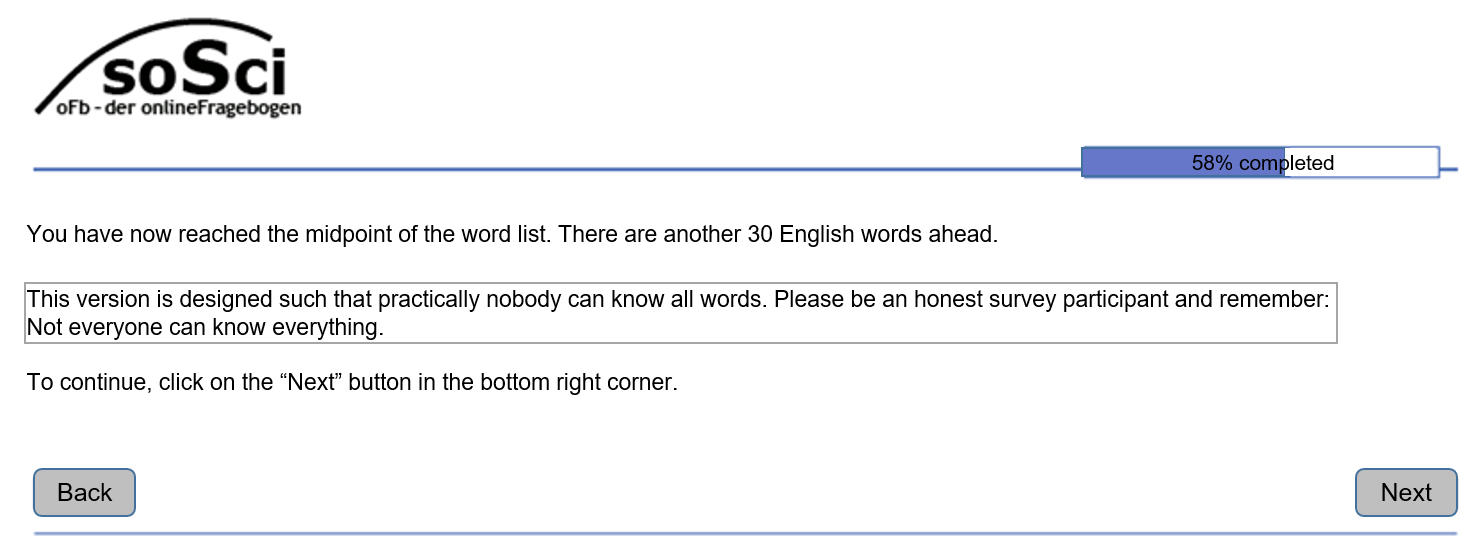
Note. Translated from the original German. Text within the grey box was included only in the treatment condition and missing in the control condition; the screens displayed to respondents did not contain any such boxes.
A short version of this part of the treatment was repeated on the treatment version of the text page displayed after half the items had been answered (figure 2).
Figure 3
Example of a word recognition page from the main part of the questionnaire
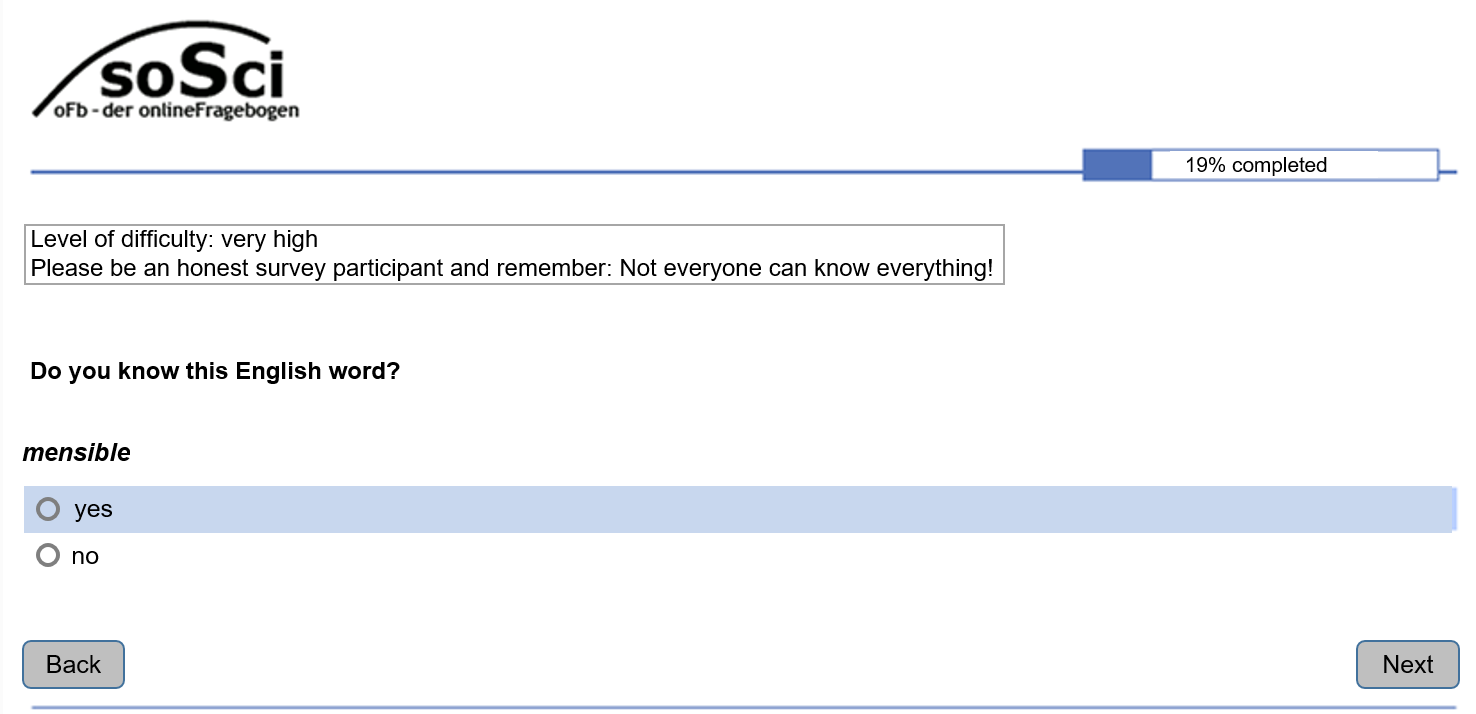
Note. The figure shows a translation; in the version displayed to respondents, all text except for the stimulus word (“mensible”) was German. Text within the grey box was included only in the treatment condition and missing in the control condition; the screens displayed to respondents did not contain any such boxes.
Treatment and control versions of the questionnaire also differed in terms of the texts included on the word recognition pages. In the treatment condition, each page repeated the texts “Level of difficulty: very high” and “Please be an honest survey respondent and remember: not everyone can know everything” (figure 3). The latter phrase was also displayed in the practice section of the treatment version (figure 4). In the control version, these texts were not displayed.
Figure 4
Example of a word recognition page from the practice part of the questionnaire
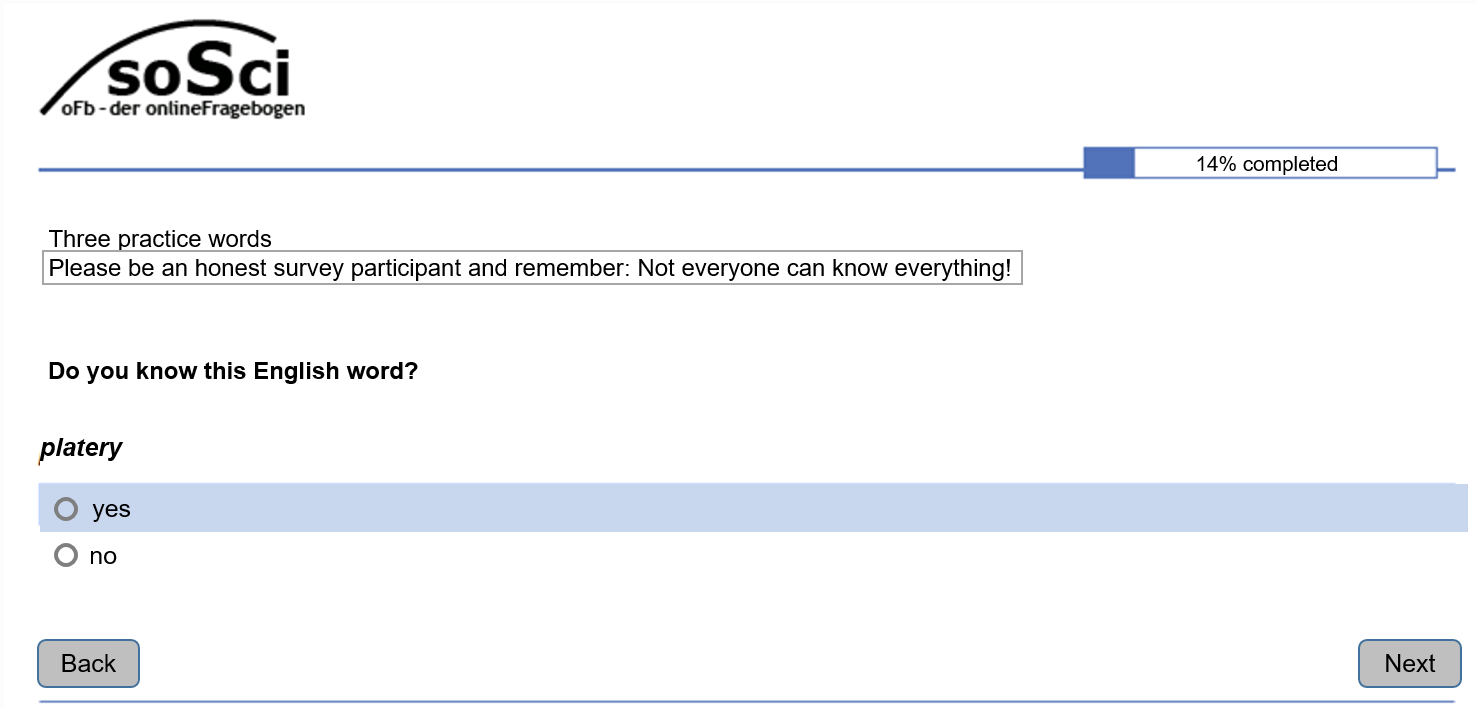
Note. The figure shows a translation; in the version displayed to respondents, all text except for the stimulus word (“platery”) was German. Text within the grey box was included only in the treatment condition and missing in the control condition; the screens displayed to respondents did not contain any such boxes.
2.4 Measures
2.4.1 Dependent variable
The dependent variable is the sum of foils claimed as known, excluding practice items. The list of 40 reals (e.g., “muddy”, “listless”, “wrought”), 20 foils (e.g., “pulsh”, “quirty”, “pudour”) and their order were taken from LexTALE, a validated test of proficiency in English (Lemhöfer & Broersma, 2012; “Word list and instructions for use with other software”, n. d.). Note that the instructions were not taken from the LexTALE and the present study should hence not be considered an application of this test.
2.4.2 Independent variables
Personality and subjective importance of English. Narcissism was measured using the 9-item German scale by Malesza et al. (2019), with punctuation corrected as in Bude (2019). Openness, conscientiousness and extraversion were measured by 2 items each, taken from the German BFI-10 (Rammstedt et al., 2013). A tendency to respond in a socially desirable manner was measured by Schnapp et al.’s (2017) variant of Winkler et al.’s (2006) 3-item German version of Paulhus’s (1991) SDE scale.
Subjective importance of English was measured by an ad-hoc scale comprised of the items “I don’t really care whether my English is good or bad” (reverse scored) and “Being good at speaking English is important to me”. The preregistration stated that the mean of these two variables would be used if and only if they correlated at r = .3 or above; otherwise, two single variables would be used.
Items were rated on a 5-point scale ranging from “is not accurate at all” to “is completely accurate” and the mean of the items was calculated. Higher values indicate higher narcissism, openness, conscientiousness, extraversion, self-enhancement, and importance of English, respectively.
Self-rated knowledge of German and English. Two questions asked participants to rate their knowledge of German and English, respectively. Available categories were “basic”, “advanced basic”, “good”, “fluent”, “business fluent”, and “mother tongue”.
Other items. The question about gender contained the options “male”, “female” and “diverse”. Age was measured in categories, “less than 18 years”, “18-19 years”, “20-24 years”, “25-29 years” etc., up to “45-49 years” and “50 or more years”. Country of residence was measured in the four categories “Germany”, “Austria”, Switzerland” and “other country”. The last question, taken from Schnapp (2019), asked respondents whether they had completed this questionnaire before while informing them their answer would have no effect on their obtaining the code on the last page; response options were “yes”, “no”, and “I am not sure”.
2.5 Exclusion criteria
The remaining respondents were excluded if they (i) did not reach the last but one page of the survey, (ii) filled in any of the pages displaying 5 personality items in fewer than 10 seconds; (iii) filled in these 4 pages at least twice as fast as the median respondent (see Leiner, 2019b); (iv) reported that they had filled in the same survey before or (v) were not sure, or (vi) indicated low subjective importance of English by scoring below 2 on the subjective importance of English scale (possible range: 1-5).
2.6 Hypotheses and statistical analyses
It was expected that treated participants would score significantly lower than respondents in the control condition when counts of foils claimed were compared by a test of mean differences (Hypothesis 1a), a bivariate regression (Hypothesis 1b) or a multiple regression using the full set of controls (Hypothesis 1c). Tests of mean differences do not assume equal variances. The full set of control variables in the multiple regression was preregistered. Given that the choice of the appropriate regression technique depends on the distribution of the data, which could not be known in advance, the preregistration did not specify which regression technique would be used. Given the distribution of the data, bivariate and multiple negative binomial regressions were run. In reaction to a comment by the associate editor, another (not preregistered) regression model was added that contained a limited number of control variables. It was chosen on the basis of minimizing the AICc (a variant of Akaike’s Information Criterion which includes a correction for small sample size; Portet, 2020, p. 123), under the restriction that the treatment indicator must remain in the model.
The preregistration specified that tests of significance would be one-sided unless noted otherwise; it also noted that, in the multiple regressions only, tests would be two-sided for gender and age, but one-sided for all other variables. This combination of tests of significance would introduce inconsistencies between analyses and even within multiple regressions. Moreover, use of one-sided tests may be misleading to cursory readers (who expect the more common two-sided tests) and some authors argue that “[e]xpectation of a difference in a particular direction is not adequate justification” for using one-sided tests (Bland & Altman, 1994, p. 248). Hence, p-values based on the customary two-sided tests are displayed throughout. The original values of the t– and χ2-tests are also presented.
SPSS (versions 20 and 24) was used for all analyses.
3 Results
Data were collected between October 3 and October 16, 2020. In apparent accordance with data collection stopping rules laid down in the preregistration, the survey was closed when it had been taken off the list of surveys at SurveyCircle – which happens when the code has been used 100 times – and no new answers had been collected for four days. Analysis of the data revealed that only 99 respondents had actually completed the questionnaire, presumably because the code had been passed on to 1 person who used it without taking the survey. The survey had been started 170 times, for a completion rate of 58%. Of the 71 respondents that started but did not finish the survey, 59 (83%) were redirected to the exclusion page after having rated their knowledge of German as something other than “mother tongue”. 3 (4%) were excluded after reporting an age out of the admissible range, and 1 (1%) after reporting knowledge of English less than “good”. That is, in 63 of the 170 times the questionnaire was started (37%), participants were excluded because, according to their responses, they did not fulfil the inclusion criteria. In the remaining 8 cases (11%), the questionnaire was simply not finished (drop-out). Of the remaining 99 respondents, 5 were excluded because they stated they had filled in the questionnaire before. Another 6 were excluded because they had filled in at least one of the 4 pages containing personality items in less than 10 seconds; of these, 5 had also filled in the 4 pages at least twice as quickly as the median respondent. The final sample size is n = 88.
The median response time (from starting the questionnaire to finishing it, measured in full seconds) was 284.50 seconds (mean = 287.09, sd = 53.77, min = 182.00, max = 434.00). The two variables measuring subjective importance of English correlated at r(86) = .58 (p < .001) and were hence combined into a single measure by taking their mean.
Table 1: Descriptive statistics for full sample (n = 88)
| Mean | SD | Min | Max | |
| Sum foils claimed (0-20) | 1.66 | 2.02 | 0.00 | 8.00 |
| Narcissism (1-5) | 2.56 | 0.62 | 1.33 | 4.11 |
| Extraversion (1-5) | 3.16 | 1.10 | 1.00 | 5.00 |
| Conscientiousness (1-5) | 3.82 | 0.77 | 2.50 | 5.00 |
| Openness (1-5) | 3.61 | 0.90 | 1.50 | 5.00 |
| SDE (1-5) | 3.38 | 0.59 | 2.00 | 4.67 |
| Subjective importance of English (1-5) | 4.18 | 0.66 | 2.00 | 5.00 |
| English “good” (0-1) | 0.30 | 0.46 | 0.00 | 1.00 |
| English “fluent” (0-1) | 0.41 | 0.49 | 0.00 | 1.00 |
| Age 18-24 (0-1) | 0.41 | 0.49 | 0.00 | 1.00 |
| Age 30-49 (0-1) | 0.15 | 0.36 | 0.00 | 1.00 |
| Male (0-1) | 0.34 | 0.48 | 0.00 | 1.00 |
| Residence not Germany (0-1) | 0.06 | 0.23 | 0.00 | 1.00 |
| Not Student (0-1) | 0.10 | 0.30 | 0.00 | 1.00 |
| Abbreviations. SD: standard deviation; Min: Minimum; Max: Maximum; SDE: Self-deceptive enhancement
Theoretical (maximum possible) range in parentheses |
||||
Table 1 shows descriptives, including for dummy variables on the basis of categorical measures, for the full sample (n = 88). No respondent chose the gender category “diverse”, so that all non-male participants are female. In the cases of the age and country variables, cells with values below 10% were combined.
Table 2: Tests of mean differences between control (n = 44) and treatment group (n = 44)
| Means | Mean diff. | t | p | ||
| control | treatment | ||||
| Sum foils claimed (0-20) | 1.82 | 1.50 | 0.32 | 0.74 | 0.46 |
| Narcissism (1-5) | 2.50 | 2.61 | -0.11 | -0.83 | 0.41 |
| Extraversion (1-5) | 3.08 | 3.24 | -0.16 | -0.68 | 0.50 |
| Conscientiousness (1-5) | 3.66 | 3.99 | -0.33 | -2.05* | 0.04 |
| Openness (1-5) | 3.59 | 3.64 | -0.05 | -0.24 | 0.81 |
| SDE (1-5) | 3.30 | 3.45 | -0.14 | -1.15 | 0.25 |
| Subjective importance of English (1-5) | 4.08 | 4.27 | -0.19 | -1.39 | 0.17 |
| English “good” (0-1) | 0.27 | 0.32 | -0.05 | -0.46 | 0.64 |
| English “fluent” (0-1) | 0.41 | 0.41 | 0.00 | 0.00 | 1.00 |
| Age 18-24 (0-1) | 0.50 | 0.32 | 0.18 | 1.74 | 0.08 |
| Age 30-49 (0-1) | 0.09 | 0.20 | -0.11 | -1.50 | 0.14 |
| Male (0-1) | 0.20 | 0.48 | -0.27 | -2.79** | 0.01 |
| Residence not Germany (0-1) | 0.07 | 0.05 | 0.02 | 0.46 | 0.65 |
| Dummy not Student (0-1) | 0.11 | 0.09 | 0.02 | 0.35 | 0.73 |
| Abbreviations. Mean diff.: mean differences; SDE: Self-deceptive enhancement | |||||
| *: p < .05; ** p < .01, two-sided tests | |||||
| Theoretical (maximum possible) range in parentheses | |||||
Table 2 shows comparisons of means for the two groups. Participants in the control group claimed a mean of 1.82 foils, taking a little less than 10% of the opportunities to show SDR. The value in the treatment group is lower, but this difference is not statistically significant and corresponds to an effect size of d = .15, typically considered “small” (Hyde, 2005, p. 581). Hypothesis 1a is hence not confirmed.
Table 2 also shows that randomization did not lead to balancing on all variables in this small sample. It is hence possible that these differences mask a treatment effect. This suspicion is not confirmed in negative binomial regressions. Neither is a significant effect found in a bivariate model (B = -.19, p = .47) nor in a model controlling for all variables displayed in Table 1 (B = -.13, p = .61) nor in a model containing a reduced set of controls chosen on the basis of minimizing the AICc (B = -.05, p = .84). Hypotheses 1b and 1c are hence not confirmed. Full tables of regression results and a table of correlations are provided in the appendix.
4 Discussion and Conclusion
4.1 Exclusion of careless respondents
In 37% of the cases in which the questionnaire was started, respondents were excluded because their responses indicated they did not fulfil the inclusion criteria. The vast majority of these were excluded after choosing an answer other than “mother tongue” to the question on their knowledge of German. The inclusion criteria were clearly stated on the SurveyCircle main page from which the survey was linked and respondents had confirmed they fulfilled the inclusion criteria, which were explicitly stated, on the questionnaire’s first page. In fairness to respondents, they may have expected a question on their knowledge of English (which was presented only on the next page) rather than German; however, this explanation presupposes that respondents did not read the question carefully. Clearly, the high exclusion rate indicates a noteworthy level of carelessness on part of the respondents when selecting into the survey and/or when reading the question. This result of the present study is not out of the ordinary; Nichols and Edlund (2020, Study 3) found that about two thirds of participants recruited via MTurk did not meet the advertised eligibility criteria, as measured by participants’ answers to questions on sociodemography. While both the present and the Nichols and Edlund (2020) studies recruited participants via online platforms, presumably the mode of administration is not the decisive commonality. Rather, it seems likely that results of the two studies were broadly comparable because on both platforms, participants have an extrinsic incentive to finish many surveys quickly in order to collect money (MTurk) or points (SurveyCircle). Researchers collecting data on such platforms may want to consider including extensive checks for eligibility and careless responding.
4.2 Forced answering and its potential consequences
As noted, the questionnaire used in the present study forced respondents to give substantial answers to all items if they were to continue to the next page. On the one hand, this ensures complete data for all respondents that finished the questionnaire. On the other, one may be concerned that this feature increases drop-out of respondents and reduces the quality of the answers. However, these concerns are not clearly supported by the results of randomized experiments on these potential negative effects of forced answering (relative to allowing leaving items unanswered and/or including a “prefer not to answer” category).
Concerning drop-out, Sischka et al. (2022) found that forcing answers lead to higher drop-out rates, while other studies found mixed (Roster et al., 2014) or null results (Albaum et al., 2010; Mergener et al., 2015). For the present study, possible drop-out caused by this feature is not a major concern, as only 8 out of 170 (5%) of respondents who started the questionnaire voluntarily dropped out and this study did not aim to describe a specific population.
Concerning the effect of forced answering on answer quality, Albaum, Roster, Wiley et al. (2010) and Albaum, Roster, and Smith (2014) found no effect on the means of a number of scales, suggesting no effect of the feature on answers in this respect. In contrast, Mergener et al. (2015, p. 8) report significantly lower self-reported participation in crime measured by a single item when answers were forced, but the publication leaves unclear what the results regarding other items were. To the extent that reduced answer quality is a problem in the present study and may be conceptualized as classical measurement error, the main concern would be that the control variables used in the multiple regressions are measured with inflated error. Such error would lower the expectation of the association of control variables with the dependent variable (though this effect is the less pronounced the smaller the sample; Loken & Gelman, 2017, p. 585). This, in turn, would mean that they are less useful in terms of controlling for remaining imbalances between the treatment and control group. This would be a concern had a significant effect of the treatment indicator on the outcome been found in the multiple regressions. One might then be concerned that such a treatment effect would not have been found had control variables been measured with less error. However, in the present study, no significant effect of the treatment was found in the first place. This renders the possible inflation of measurement error in the control variables due to forcing answers a minor worry at most.
4.3 Socially desirable responding and its reduction via the example treatment
Across conditions, some 8% of foils from the LexTALE word list were claimed in the present study. This result was surprising given that the percentages of foils claimed as known reported for online tests using the same word list with other samples were much higher: 42% in a sample of 87 Korean university students pre-screened for proficiency in English (Lemhöfer & Broersma, 2012), 45% in a sample of 111 Japanese first-year university students of English (Nakata et al., 2020), and 17% in a sample of 72 Dutch respondents drawn from a participant pool that consisted of university students “for the greatest part” (Lemhöfer & Broersma, 2012, p. 328). These differences might be due to a host of factors including actual differences in proficiency in English, different motivations for participation and differences in procedures to exclude careless respondents. However, in hindsight it seems apparent that the results are not directly comparable in the first place due to a crucial methodological difference. The present study took the list of stimuli from the LexTALE, but deliberately did not copy its instructions. In the present study, participants were asked to indicate whether they “know” a word. The studies by Lemhöfer & Broersma (2012) and Nakata et al. (2020) used the LexTALE instructions (K. M. Lemhöfer, personal communication, January 4, 2022; T. Nakata, personal communication, January 3, 2022), which inform participants that they will be presented with “a string of letters” and asked to click “yes” if “you think it is an existing English word” and “no” “if you think it is not an existing English word” (“Word list and instructions for use with other software”, n.d., p. 1). It seems probable that these instructions encourage guessing, and hence indicating “yes”, more than the instructions used in the present study, which asked whether participants “know” a word. The instructions used here seem right for the present purposes as they unequivocally allow for the interpretation of the foils as zero-prevalence items, which would be doubtful if the instructions had asked respondents whether they merely “think” the foils presented are English words. It does, however, help explain the fact that the sum of foils claimed is so low in the present study compared to extant results.
The demonstration used a combination of appeals to honesty and forgiving wording as an example treatment aimed at reducing SDR. It found that the effects of this treatment were in the expected direction, but neither of substantial size nor statistically significant. This result should be interpreted in the light of the study’s small sample size. A related potential limitation is the use of control variables in some of the regression models. These were included to control for any imbalances that might remain between the treatment and control groups despite randomization. However, it is possible that variables which should have been measured and included as controls were not. In particular, one might argue that measures of formal education are crucial in the present context. They were not included due to the assumption that the range of such variables would be restricted in the present sample and that the self-reported proficiency in English would be more relevant. The former assumption is confirmed by the finding that 90% of respondents in the final sample were students (Table 1). Nonetheless, it is possible that the inclusion of fine-grained measures of education would have made a difference in terms of the associations between treatment status and the outcome in the multiple regressions.
While these limitations should be kept in mind, it is worth noting that the findings presented herein are broadly consistent with extant null and mixed results in studies employing the more-is-better/less-is-better assumption which test the effects of appeals to honesty (Brener et al., 2004) and forgiving wording (Catania et al., 1996; Contzen et al., 2015; Holtgraves et al., 1997; Näher & Krumpal, 2012; Ong & Weiss, 2000; Persson & Solevid, 2014; but see Acquisti et al., 2012, Study 1; Raghubir & Menon, 1996, Study 1).
4.4 The ROME: Strengths, limitations, perspectives
More importantly, the study demonstrates how the ROME can be used to assess the impact of SDR reduction techniques. It also shows the advantages of the ROME over other methods for assessing such techniques. In contrast to validations against external measures of constructs, no additional data had to be collected and there is no uncertainty regarding the validity of such data. In contrast to studies based on the more-is-better/less-is-better assumption, the extent to which respondents engaged in desirable responding could be quantified objectively for both groups, making unnecessary any assumptions about the true values and relations between them.
Research on SDR reduction techniques is typically conducted and reported under the assumption that the results found using a specific instrument on a specific sample under specific conditions will generalize to other instruments, samples, and conditions. The ROME can, by design, only be used with knowledge questions. Its utility is bounded by the extent to which results found for such knowledge questions generalize to other types of information, such as attitudes or self-reported behaviour. As pointed out by a reviewer, decisions about whether or not to use the ROME to test the efficacy of SDR reduction techniques will hence depend on the research context. Researchers who are primarily interested in the validity of self-reports in a specific applied context (e.g., voting behaviour) may prefer to spend their limited resources on efforts to improve the validity of their instruments which do not involve the ROME (e.g., obtaining official records of voting behaviour as measures of true values). In contrast, survey methodologists interested in testing SDR reduction techniques that are believed to work generally might want to first test them using the ROME, as it offers an easy way to compare survey results to true values. Findings on the efficacy of SDR reduction techniques obtained using the ROME could then be supplemented with results using other topics and validation methods. If the results are similar, confidence in their generality increases.
Readers wishing to employ this method may wonder how to increase statistical power relative to the present study. The most obvious choice is increasing the sample size. Choice of mode may also have an effect. The present study used a web survey, i.e., a mode without interviewer presence. The weight of the evidence suggests that interviewer presence increases SDR (Krumpal, 2013, p. 2034; Yan & Cantor, 2019, p. 49S). This suggests that modes with interviewer presence have more baseline SDR to work with; it should hence be easier to find effects of SDR reduction techniques in such modes.
A different approach would change the overclaiming instrument. There are multiple aspects to this. First, even respondents in the control condition did not exhibit a lot of overclaiming in the present study. While this may in part be ascribed to the mode, other instruments or other topics may be preferable. Second, the number of foils could be increased, increasing precision of measurement. The present study included 20 foils and 40 reals. The median response time for these items was merely 2.05 seconds each. Such sections could hence be lengthened without increasing respondent burden by much. These short response times were enabled in the present study by programming the pages in question such that the next page displaying the next item automatically loaded once an answer had been given. This probably shortens response times considerably compared to questionnaires in which respondents have to click a “forward” button after giving their answer.
These are minutiae, however. More generally, it is worth pointing out that researchers continue to propose new methods for reducing SDR, yet these are either not validated at all or tested using the more-is-better/less-is-better assumption. As Höglinger & Diekmann (2017, p. 136) have argued convincingly, using zero-prevalence items is a valid and simple method for validating SDR reduction techniques. In contrast to extant studies using zero-prevalence items, the ROME allows for the application of this idea using a large number of items that may be assumed to be sensitive to socially desirable responding. It hence seems to be a valuable addition to the survey methodologist’s toolbox.
Appendix
Appendix Table 1: Bivariate correlations (r) between variables (n = 88)
| 1 | 2 | 3 | 4 | 5 | 6 | 7 | 8 | 9 | 10 | 11 | 12 | 13 | 14 | ||
| 1 | Sum foils claimed | ||||||||||||||
| 2 | Treatment | -0.08 | |||||||||||||
| 3 | Narcissism | 0.05 | 0.09 | ||||||||||||
| 4 | Extraversion | 0.30 | 0.07 | 0.62 | |||||||||||
| 5 | Conscientiousness | 0.25 | 0.22 | -0.04 | 0.17 | ||||||||||
| 6 | Openness | -0.10 | 0.03 | 0.07 | -0.04 | -0.02 | |||||||||
| 7 | SDE | 0.22 | 0.12 | 0.41 | 0.38 | 0.10 | 0.01 | ||||||||
| 8 | Subjective importance of English | -0.16 | 0.15 | 0.12 | 0.07 | 0.12 | 0.16 | 0.13 | |||||||
| 9 | English “good” | 0.01 | 0.05 | -0.10 | -0.05 | -0.11 | 0.02 | -0.06 | -0.33 | ||||||
| 10 | English “fluent” | 0.04 | 0.00 | 0.20 | -0.03 | -0.05 | 0.04 | 0.10 | 0.11 | -0.54 | |||||
| 11 | Age 18-24 | 0.10 | -0.18 | -0.13 | -0.21 | -0.04 | 0.31 | -0.15 | 0.24 | -0.03 | -0.03 | ||||
| 12 | Age 30-49 | -0.04 | 0.16 | 0.02 | -0.03 | 0.01 | 0.00 | -0.03 | -0.19 | 0.15 | -0.09 | -0.35 | |||
| 13 | Male | -0.10 | 0.29 | 0.29 | 0.11 | -0.10 | -0.06 | 0.18 | -0.18 | 0.06 | -0.01 | -0.16 | 0.24 | ||
| 14 | Residence not Germany | -0.10 | -0.05 | -0.25 | -0.26 | -0.14 | -0.03 | -0.10 | 0.08 | -0.05 | 0.10 | 0.00 | -0.10 | -0.18 | |
| 15 | Not student | -0.10 | -0.05 | -0.25 | -0.26 | -0.14 | -0.03 | -0.10 | 0.08 | -0.05 | 0.10 | 0.00 | -0.10 | -0.18 | -0.10 |
| Correlations which are significant (two-sided tests) at p < .05 in bold type; at p < .01 in bold type and italics. | |||||||||||||||
Appendix Table 2: Negative binomial regression on the sum of foils claimed – bivariate model
| B | SE (B) | 95% Wald CI | Significance | ||||
| Upper bound | Lower bound | Wald-χ2 | p | ||||
| Constant | .60 | .19 | .23 | .96 | 10.26** | .00 | |
| Treatment | -.19 | .27 | -.72 | .33 | .51 | .47 | |
| Dispersion | .98 | .28 | .56 | 1.73 | |||
| Pearson’s χ2 | 79.97 | ||||||
| LL | -154.68 | ||||||
| AICc | 315.64 | ||||||
| BIC | 322.79 | ||||||
| n | 88 | ||||||
| ** p < .01; * p < .05 (two-sided tests) | |||||||
Appendix Table 3: Negative binomial regression on the sum of foils claimed – full model
| B | SE (B) | 95% Wald CI | Significance | ||||
| Lower bound | Upper bound | Wald-χ2 | p | ||||
| Constant | -1.75 | 1.40 | -4.49 | 0.99 | 1.57 | 0.21 | |
| Treatment | -0.13 | 0.26 | -0.65 | 0.38 | 0.26 | 0.61 | |
| Narcissism | -0.35 | 0.27 | -0.88 | 0.19 | 1.61 | 0.20 | |
| Extraversion | 0.47 | 0.16 | 0.16 | 0.78 | 8.89** | 0.00 | |
| Conscientiousness | 0.49 | 0.18 | 0.14 | 0.84 | 7.61** | 0.01 | |
| Openness | -0.10 | 0.15 | -0.38 | 0.19 | 0.43 | 0.51 | |
| SDE | 0.39 | 0.23 | -0.05 | 0.84 | 2.97 | 0.08 | |
| Subjective importance of English | -0.46 | 0.22 | -0.89 | -0.03 | 4.46* | 0.03 | |
| English “good” | 0.33 | 0.34 | -0.34 | 1.00 | 0.94 | 0.33 | |
| English “fluent” | 0.53 | 0.32 | -0.10 | 1.17 | 2.74 | 0.10 | |
| Age 18-24 | 0.74 | 0.28 | 0.20 | 1.29 | 7.25** | 0.01 | |
| Age 30-49 | 0.13 | 0.38 | -0.62 | 0.88 | 0.12 | 0.73 | |
| Male | -0.36 | 0.31 | -0.96 | 0.24 | 1.41 | 0.24 | |
| Residence not Germany | -0.10 | 0.64 | -1.37 | 1.16 | 0.03 | 0.87 | |
| Not student | 0.50 | 0.42 | -0.33 | 1.34 | 1.42 | 0.23 | |
| Dispersion | 0.40 | 0.16 | 0.18 | 0.88 | |||
| Pearson’s χ2 | 73.73 | ||||||
| LL | -137.83 | ||||||
| AICc | 315.32 | ||||||
| BIC | 347.29 | ||||||
| n | 88 | ||||||
| ** p < .01; * p < .05 (two-sided tests) | |||||||
Appendix Table 4: Negative binomial regression on the sum of foils claimed – reduced model (best fit)
| B | SE (B) | 95% Wald CI | Significance | ||||
| Lower bound | Upper bound | Wald-χ2 | p | ||||
| Constant | -1.26 | 1.12 | -3.46 | 0.94 | 1.26 | 0.26 | |
| Treatment | -0.05 | 0.26 | -0.56 | 0.46 | 0.04 | 0.84 | |
| Extraversion | 0.32 | 0.12 | 0.09 | 0.55 | 7.21** | 0.01 | |
| Conscientiousness | 0.46 | 0.17 | 0.13 | 0.79 | 7.64** | 0.01 | |
| SDE | 0.36 | 0.22 | -0.07 | 0.79 | 2.63 | 0.10 | |
| Subjective importance of English | -0.59 | 0.20 | -0.98 | -0.20 | 8.72** | 0.00 | |
| Age 18-24 | 0.57 | 0.26 | 0.06 | 1.08 | 4.84* | 0.03 | |
| Male | -0.51 | 0.29 | -1.07 | 0.05 | 3.24 | 0.07 | |
| Dispersion | 0.46 | 0.18 | 0.21 | 1.00 | |||
| Pearson’s χ2 | 80.26 | ||||||
| LL | -140.79 | ||||||
| AICc | 301.89 | ||||||
| BIC | 321.88 | ||||||
| n | 88 | ||||||
| ** p < .01; * p < .05 (two-sided tests) | |||||||
[1] The age restriction was introduced to maintain some homogeneity in terms of age without restricting the population of potential participants too much. Given that SurveyCircle appears to be used mostly for data collection for theses, including PhD theses, it was reasoned that participants aged 50 and above would be unusual in ways that might influence their patterns of answers. Although this potential problem is reduced due to randomization, in small samples in particular, imbalances between the treatment and the control group can remain despite randomization.
References
- Acquisti, A., John, L. K., & Loewenstein, G. (2012). The impact of relative standards on the propensity to disclose. Journal of Marketing Research, 49(2), 160–174. https://doi.org/10.1509/jmr.09.0215
- Albaum, G., A. Roster, C. A., & Smith, S. M. (2014). Topic sensitivity and research design: Effects on internet survey respondents’ motives. Asia Pacific Journal of Marketing and Logistics, 26(1), 147-161. https://doi.org/10.1108/APJML-12-2012-0127
- Albaum, G., Roster, C. A., Wiley, J., Rossiter, J., & Smith, S. M. (2010). Designing web surveys in marketing research: Does use of forced answering affect completion rates? Journal of Marketing Theory and Practice, 18(3), 285-294. https://doi.org/10.2753/MTP1069-6679180306
- Barber, L. K., Barnes, C. M., & Carlson, K. D. (2013). Random and systematic error effects of insomnia on survey behavior. Organizational Research Methods, 16(4), 616–649. https://doi.org/10.1177/1094428113493120
- Barton, A. H: (1958). Asking the embarrassing question. Public Opinion Quarterly, 22(1), 67–68. https://doi.org/10.1086/266761
- Bertsch, S., & Pesta, B. J. (2009). The Wonderlic Personnel Test and elementary cognitive tasks as predictors of religious sectarianism, scriptural acceptance and religious questioning. Intelligence, 37(3), 231–237. https://doi.org/10.1016/j.intell.2008.10.003
- Bing, M. N., Kluemper, D., Davison, H. K., Taylor, S., & Novicevic, M. (2011). Overclaiming as a measure of faking. Organizational Behavior and Human Decision Processes, 116(1), 148–162. https://doi.org/10.1016/j.obhdp.2011.05.006
- Bland, J. M., & Altman, D. G. (1994). One and two sided tests of significance. BMJ, 309(6958), 248. https://doi.org/10.1136/bmj.309.6949.248
- Boon, R. M., Hamlin, M. J., Steel, G. D., & Ross, J. J. (2010). Validation of the New Zealand Physical Activity Questionnaire (NZPAQ-LF) and the International Physical Activity Questionnaire (IPAQ-LF) with accelerometry. British Journal of Sports Medicine, 44(10), 741-746. http://dx.doi.org/10.1136/bjsm.2008.052167
- Brener, N. D., Grunbaum, J. A., Kann, L., McManus, T., & Ross, J. (2004). Assessing health risk behaviors among adolescents: The effect of question wording and appeals for honesty. Journal of Adolescent Health, 35(1), 91-100. https://doi.org/10.1016/j.jadohealth.2003.08.013
- Brenner, P. S. (2012). Overreporting of voting participation as a function of identity. Social Science Journal, 49(4), 421-429. http://dx.doi.org/10.1016/j.soscij.2012.10.003
- Bude, A. (2019). Dunkle Triade und Studienerfolg. Hannover: Hochschule Hannover. https://serwiss.bib.hs-hannover.de/frontdoor/deliver/index/docId/1526/file/Bude_2019_Dunkle_Triade_und_Studienerfolg.pdf
- Calsyn, R. J., Kelemen, W. L., Jones, E. T., & Winter, J. P. (2001) Reducing overclaiming in needs assessment studies: An experimental comparison. Evaluation Review, 25(6), 583-605. https://doi.org/10.1177/0193841X0102500601
- Cassel, C. A. (2004). Voting records and validated voting studies. Public Opinion Quarterly, 68(1), 102–108, https://doi.org/10.1093/poq/nfh007
- Catania, J. A., Binson, D., Canchola, J., Pollack, L. M., Hauck, W., & Coates, T. J. (1996). Effects of interviewer gender, interviewer choice, and item wording on responses to questions concerning sexual behavior. Public Opinion Quarterly, 60(3), 345-375. https://doi.org/10.1086/297758
- Contzen, N., De Pasquale, S., & Mosler H.-J. (2015). Over-reporting in handwashing self-reports: Potential explanatory factors and alternative measurements. PLoS ONE, 10, e0136445. http://doi.org/10.1371/journal.pone.0136445
- Diekmann, A. (1996). Empirische Sozialforschung: Grundlagen, Methoden, Anwendungen [Empirical Social Research: Fundamentals, Methods, Applications] (2nd ed.). Rowohlt.
- Dunlop, P. D., Bourdage, J. S., de Vries, R. E., Hilbig, B. E., Zettler, I., & Ludeke, S. G. (2017). Openness to (reporting) experiences that one never had: Overclaiming as an outcome of the knowledge accumulated through a proclivity for cognitive and aesthetic exploration. Journal of Personality and Social Psychology, 113(5), 810–834. https://doi.org/10.1037/pspp0000110
- Dunlop, P. D., Bourdage, J. S., de Vries, R. E., McNeill, I. M., Jorritsma, K., Orchard, M., Austen, T., Baines, T., & Choe, W.-K. (2020). Liar! Liar! (when stakes are higher): Understanding how the overclaiming technique can be used to measure faking in personnel selection. Journal of Applied Psychology, 105(8), 784–799. https://doi.org/10.1037/apl0000463
- Franzen, A., & Mader, S. (2019). Do phantom questions measure social desirability? Methods, Data, Analyses, 13(1), 37-57. https://doi.org/10.12758/mda.2019.01
- Harling, G., Bountogo, M., Sié, A., Bärninghausen, T., Lindstrom, D. P. (2021). Nonverbal response cards reduce socially desirable reporting of violence among adolescents in rural Burkina Faso: A randomized controlled trial. Journal of Adolescent Health, 68(5), 914-921. https://doi.org/10.1016/j.jadohealth.2020.09.006
- Hibben, K. C., Felderer, B., & Conrad, F. G. (2022). Respondent commitment: Applying techniques from face-to-face interviewing to online collection of employment data. International Journal of Social Research Methodology, 25(1), 15-27. https://doi.org/10.1080/13645579.2020.1826647
- Höglinger, M., & Diekmann, A. (2017). Uncovering a blind spot in sensitive question research: False positives undermine the Crosswise-Model RRT. Political Analysis, 25(1), 131-37. https://doi.org/10.1017/pan.2016.5
- Höglinger, M., Jann, B. (2018). More is not always better: An experimental individual-level validation of the randomized response technique and the Crosswise Model. PLoS ONE, 13(8), e0201770. https://doi.org/10.1371/journal.pone.0201770
- Holtgraves, T., Eck, J., & Lasky, B. (1997). Face management, question wording, and social desirability. Journal of Applied Social Psychology, 27(18), 1650-1671. https://doi.org/10.1111/j.1559-1816.1997.tb01618.x
- Hyde, J. S. (2005). The gender similarities hypothesis. American Psychologist, 60(6), 581-592. http://doi.org/10.1037/0003-066X.60.6.581
- Kreuter, F., Presser, S., & Tourangeau, R. (2008). Social desirability bias in CATI, IVR, and web surveys. Public Opinion Quarterly, 72(5), 847-865. https://doi.org/10.1093/poq/nfn063
- Krumpal, I. (2013). Determinants of social desirability bias in sensitive surveys: A literature review. Quality & Quantity, 47(4), 2025–2047. https://doi.org/10.1007/s11135-011-9640-9
- Leiner, D. J. (2019a). SoSci Survey (Version 3.1.06) [Computer software]. https://www.soscisurvey.de
- Leiner, D. J. (2019b). Too fast, too straight, too weird: Non-reactive indicators for meaningless data in Internet surveys. Survey Research Methods, 13(3), 229-248. https://doi.org/10.18148/srm/2019.v13i3.7403
- Lemhöfer, K., & Broersma, M. (2012). Introducing LexTALE: A quick and valid lexical test for advanced learners of English. Behavior Research Methods, 44(3), 325–343. https://doi.org/10.3758/s13428-011-0146-0
- Loken, E., & Gelman, A. (2017). Measurement error and the replication crisis: The assumption that measurement error always reduces effect size is false. Science, 355(6325), 584-585. https://doi.org/10.1126/science.aal3618
- Lu, M., Safren, S. A., Skolnik, P. R., Rogers, W. H., Coady, W., Hardy, H., & Wilson, I. B. (2008). Optimal recall period and response task for self-reported HIV medication adherence. AIDS & Behavior, 12(1), 86-94. https://doi.org/10.1007/s10461-007-9261-4
- Ludeke, S., & Makransky, G. (2016). Does the Over-Claiming Questionnaire measure over-claiming? Absent convergent validity in a large community sample. Psychological Assessment, 28(6), 765-774. https://doi.org/10.1037/pas0000211
- Malesza, M., Ostaszewski, P., Büchner, S., Kaczmarek, M. C. (2019). The adaptation of the Short Dark Triad personality measure: Psychometric properties of a German sample. Current Psychology, 38(3), 855-864. https://doi.org/10.1007/s12144-017-9662-0
- Mergener, A., Sischka, P., & Décieux, J. P. (2015). “To force or not to force. That is the question!” Die Auswirkungen des Einsatzes von Forced-Response-Fragen auf die Qualität der Befragungsergebnisse [“To force or not to force. That is the question!”: Consequences of the implementation of forced response questions on the quality of survey results]. In S. Lessenich (Ed.), Routinen der Krise – Krise der Routinen: Verhandlungen des 37. Kongresses der Deutschen Gesellschaft für Soziologie in Trier 2014. https://doi.org/10.13140/RG.2.1.2922.0723
- Mesmer-Magnus, J., Viswesvaran, C., Deshpande, S., & Joseph, J. (2006). Social desirability: The role of over-claiming, self-esteem, and emotional intelligence. Psychology Science, 48(3), 336-356.
- Näher, A.-F., & Krumpal, I. (2012). Asking sensitive questions: The impact of forgiving wording and question context on social desirability bias. Quality & Quantity, 46(5), 1601-1616. http://doi.org/10.1007/s11135-011-9469-2
- Nakata, T., Tamura, Y., & Aubrey, S. (2020). Examining the validity of the LexTALE test for Japanese college students. Journal of Asia TEFL, 17(2), 335-348. http://dx.doi.org/10.18823/asiatefl.2020.17.2.2.335
- Nichols, A. L., Edlund, J. E. (2020). Why don’t we care more about carelessness? Understanding the causes and consequences of careless participants. International Journal of Social Research Methodology, 23(6), 625-638, https://dx.doi.org/10.1080/13645579.2020.1719618
- Ong, A. D., & Weiss, D. J. (2000). The impact of anonymity on responses to sensitive questions. Journal of Applied Social Psychology, 30(8), 1691-1708. https://doi.org/10.1111/j.1559-1816.2000.tb02462.x
- Paulhus, D. L. (1991). Measurement and control of response bias. In J. P. Robinson, P. R. Shaver, & L. S. Wrightsman (Eds.), Measures of Personality and Social Psychological Attitudes (pp. 17-59). Academic Press.
- Paulhus, D. L. (2002). Socially desirable responding: The evolution of a construct. In H. I. Braun, D. N. Jackson, & D. E. Wiley (Eds.), The Role of Constructs in Psychological and Educational Measurement (pp. 49-69). Erlbaum.
- Paulhus, D. L. (2011). Overclaiming on personality questionnaires. In M. Ziegler, C. MacCann, & R. D. Roberts (Eds.). New Perspectives on Faking in Personality Assessment (pp. 151-164). Oxford University Press.
- Paulhus, D. L., Harms, P. D., Bruce, N., & Lysy, D. C. (2003). The Over-Claiming Technique: Measuring self-enhancement independent of ability. Journal of Personality and Social Psychology, 84(4), 890-904. https://doi.org/10.1037/0022-3514.84.4.890
- Persson, M., & Solevid, M. (2014). Measuring political participation – testing social desirability bias in a web-survey experiment. International Journal of Public Opinion Research, 26(1), 98-112. http://doi.org/10.1093/ijpor/edt002
- Phillips, D. L., & Clancy, K. J. (1972). Some effects of “social desirability” in survey studies. American Journal of Sociology, 77(5), 921-940. https://doi.org/10.1086/225231
- Portet, S. (2020). A primer on model selection using the Akaike Information Criterion. Infectious Disease Modelling, 5(1), 111-128. https://doi.org/10.1016/j.idm.2019.12.010
- Preisendörfer, P., & Wolter, F. (2014). Who is telling the truth? A validation study on determinants of response behavior in surveys. Public Opinion Quarterly, 78(1), 126–146. https://doi.org/10.1093/poq/nft079
- Raghubir, P., & Menon, G. (1996). Asking sensitive questions: The effects of type of referent and frequency wording in counterbiasing methods. Psychology & Marketing, 13(7), 633-652. https://doi.org/10.1002/(SICI)1520-6793(199610)13:7<633::AID-MAR1>3.0.CO;2-I
- Rammstedt, B., Kemper, C. J., Klein, M. C., Beierlein, C., Kovaleva, A. (2012). Eine kurze Skala zur Messung der fünf Dimensionen der Persönlichkeit: 10 Item Big Five Inventory (BFI-10). Methoden, Daten, Analysen, 7(2), 233-249. https://doi.org/10.12758/mda.2013.013
- Randall, D. M., & Fernandes, M. F. (1991). The social desirability response bias in ethics research. Journal of Business Ethics, 10(11), 805–817. https://doi.org/10.1007/BF00383696
- Roster, C. A., Albaum, G., & Smith, S. M. (2014). Topic sensitivity and internet survey design: A cross-cultural/national study. Journal of Marketing Theory and Practice, 22(1), 91-102. http://dx.doi.org/10.2753/MTP1069-6679220106
- Schnapp, P. (2019). Sensitive question techniques and careless responding: Adjusting the Crosswise Model for random answers. Methods, Data, Analyses, 13(2), 307-320. https://doi.org/10.12758/mda.2019.03
- Schnapp, P., Eggert, S., & Suhr, R. (2017). Comparing continuous and dichotomous scoring of social desirability scales: Effects of different scoring methods on the reliability and validity of the Winkler-Kroh-Spiess BIDR short scale. Survey Methods: Insights from the Field, 5. https://doi.org/10.13094/SMIF-2017-00002
- Schoderbek, P. P., Deshpande, S. P. (2011). Impression management, overclaiming, and perceived unethical conduct: The role of male and female managers. Journal of Business Ethics, 15(4), 409-414. https://doi.org/10.1007/BF00380361
- Sischka, P. E., Décieux, J. P., Mergener, A., Neufang, K. M., & Schmidt, A. F. (2022). The impact of forced answering and reactance on answering behavior in online surveys. Social Science Computer Review, 40(2), 405–425. https://doi.org/10.1177/0894439320907067
- Stanovich, K. E., & Cunningham, A. E. (1992). Studying the consequences of literacy within a literate society: The cognitive correlates of print exposure. Memory & Cognition, 20(1), 51-68. https://doi.org/10.3758/BF03208254
- Tourangeau, R., & Yan, T. (2007). Sensitive questions in surveys. Psychological Bulletin, 133(5), 859-883 https://doi.org/10.1037/0033-2909.133.5.859
- Winkler, N., Kroh, M. & Spiess, M. (2006). Entwicklung einer deutschen Kurzskala zur zweidimensionalen Messung von sozialer Erwünschtheit. Berlin: DIW. https://www.econstor.eu/bitstream/10419/18472/1/dp579.pdf
- Wolter, F., & Diekmann, A. (2021). False positives and the “more-is-better” assumption in sensitive question research: New evidence on the Crosswise Model and the Item Count Technique. Public Opinion Quarterly, 85(3), 836-863. https://doi.org/10.1093/poq/nfab043
- Wolter, F., & Preisendörfer, P. (2013). Asking sensitive questions: An evaluation of the Randomized Response Technique versus direct questioning using individual validation data. Sociological Methods & Research, 43(3), 321-353. http://doi.org/10.1177/0049124113500474
- Wolter, F., & Preisendörfer, P. (2020). Let’s ask about sex: Methodological merits of the sealed envelope technique in face-to-face interviews. In I. Krumpal, & R. Berger (Eds.). Devianz und Subkulturen: Theorien, Methoden und empirische Befunde (pp. 123-149). Springer VS. https://doi.org/10.1007/978-3-658-27228-9_5
- Word list and instructions for use with other software, n.d. http://www.lextale.com/downloads/ExperimenterInstructionsEnglish.pdf
- Wyner, G. A. (1980). Response errors in self-reported number of arrests. Sociological Methods & Research, 9(2), 161-177. https://doi.org/10.1177/004912418000900203
- Yan, T., & Cantor, D. (2019). Asking survey questions about criminal justice involvement. Public Health Reports, 134(Supplement I), 46S-56S. https://doi.org/10.1177/0033354919826566
-
Keywords
calibration CATI coverage coverage bias cross-national surveys data linkage data quality European Social Survey experiment face-to-face face-to-face survey Facebook hard to reach populations incentives item nonresponse measurement measurement error mixed-mode surveys multitasking non-probability samples Nonresponse nonresponse bias nonresponse rates paradata PIAAC Probability sample probability samples QR codes rare populations response rate Satisficing social desirability Social media survey survey-taking climate survey data survey management survey methods Telephone survey telephone surveys total survey error unit nonresponse validity web survey Web surveys weighting
