

Measurement Challenges in Designing and Conducting Surveys on Urban Population: Experience from Bangladesh Urban Health Surveys
Angeles, G., Ahsan, K.Z., Curtis, S.L., Spencer, J., Streatfield, P.K., Chakraborty, N. & Brodish, P. (2022). Measurement Challenges in Designing and Conducting Surveys on Urban Population: Experience from Bangladesh Urban Health Surveys. Survey Methods: Insights from the Field. Retrieved from https://surveyinsights.org/?p=16730
© the authors 2022. This work is licensed under a Creative Commons Attribution 4.0 International License (CC BY 4.0) 
Abstract
Urban populations in low- and middle-income countries are diverse in their health profiles and socioeconomic characteristics, and intra-urban differentials in health are in many cases even larger than those between urban and rural areas. Most existing household sample surveys implemented globally cannot provide required information on health outcomes, health-related behaviors, and health infrastructure specific to cities in regular intervals, particularly for sub-populations within urban areas. In this paper, we discussed some of the challenges for designing and conducting household surveys in urban areas to capture key health outcomes and service utilization indicators. Based on our experience in implementing the 2006 and 2013 rounds of Urban Health Surveys in Bangladesh and knowledge on implementing surveys globally, we identified several options for conducting similar surveys to capture key health outcomes and service utilization indicators in urban areas in the coming years. In light of increased attention to measuring the health of urban populations within the global development agenda, the measurement issues we documented in this paper and the framework we proposed to address them will inform others who are planning to conduct similar surveys.
Keywords
Bangladesh, household survey, intra-urban differentials, slum, urban health
Acknowledgement
We are grateful to the Carolina Population Center and its NIH Center grant (R24 HD050924) for the general support. This publication was produced in part with the support of the United States Agency for International Development (USAID) under the terms of MEASURE Evaluation cooperative agreement AID-OAA-L-14-00004. MEASURE Evaluation is implemented by the Carolina Population Center, the University of North Carolina at Chapel Hill in partnership with ICF International; John Snow, Inc.; Management Sciences for Health; Palladium; and Tulane University. icddr,b gratefully acknowledges its core donors, which include the Government of the People’s Republic of Bangladesh; the Department of Foreign Affairs, Trade and Development (DFATD), Canada; Swedish International Development Cooperation Agency (Sida), and the United Kingdom’s Department for International Development (DFID). We also acknowledge the institutions and individuals who had made the 2006 and 2013 Urban Health Surveys possible. Both surveys were implemented under the authority of the National Institute of Population Research and Training (NIPORT) of the Government of the People’s Republic of Bangladesh with funding by the United States Agency for International Development (USAID)/Bangladesh and DFID. This work could not have been done without the full support of the UHS Core Technical Working Group, which includes representatives from NIPORT, MEASURE Evaluation, icddr,b, and USAID/Bangladesh for designing and implementing the surveys. The data from both surveys were collected and processed by Associates for Community and Population Research (ACPR). The authors’ views expressed in this publication do not necessarily reflect the views of the USAID or the United States Government.
Copyright
© the authors 2022. This work is licensed under a Creative Commons Attribution 4.0 International License (CC BY 4.0)
Introduction
According to the United Nations, 54% of the global population lived in urban areas in 2014, and most of the future demographic growth will occur in cities (United Nations, 2014). By 2050, three-fourths of the world’s population is expected to live in urban areas, with the highest rates of urbanization in developing countries (Ferguson and Navarrete, 2003; Pearson, Newton and Roberts, 2014; Sticzay and Koch, 2015). This process of rapid global urbanization is driving increased attention to measuring the health of urban populations. Furthermore, several of the post-2015 Sustainable Development Goals (SDGs) are at least indirectly related to improving urban health, with Goal 11 (viz., make cities and human settlements inclusive, safe, resilient, and sustainable) focusing specifically on the urban environment as a part of the global development agenda (Simon et al. 2015; Sticzay and Koch, 2015). Urban populations are very diverse in their health profiles and socioeconomic characteristics (Vlahov et al. 2007). Intra-urban differentials in health are in many cases even larger than those between urban and rural areas (WHO and UN-HABITAT, 2010a). As many countries, including Bangladesh, have increased their attention to urban health issues as a part of their health policies, there is a need for information on health outcomes, health-related behaviors, and health infrastructure specific to cities in order to identify priority health needs, plan the provision of health services, monitor progress, and evaluate interventions in urban areas.
Bangladesh is undergoing a rapid urbanization process. Though it is largely a rural country (66% of the population lives in rural areas in 2015), all future population growth in the country is expected to be in urban areas. It is estimated that the urban population in Bangladesh will grow from its 2015 level of 55 million people to 83 million in 2030 (United Nations, 2014). While the country is organized into eight administrative divisions, 64 districts, and 492 upazilas (sub-districts), the urban centers in Bangladesh are organized into three geographically distinct levels, from larger to smaller population size: City Corporations, district municipalities and towns, and upazilla headquarters (Govindaraj et al., 2018). As of 2015, Bangladesh had 532 urban centers, including eleven City Corporations and 318 municipalities run by elected councils (Government of Bangladesh, 2017). With the current rate of urbanization, Bangladesh will be an urban country by 2039, when the majority of people will live in urban areas. Dhaka, the country’s capital, is now the 11th largest mega city (defined as having more than 10 million inhabitants), with 17 million people, up from 24th in the population ranking in 1990. Since Dhaka has one of the highest population growth rates among megacities (3.6% annually for 2010–2015), it is expected to become the world’s 6th largest city in 2030, with 27 million people (United Nations, 2014; Govindaraj et al., 2018).
While many types of health information can be used for planning, monitoring, and decision-making, household surveys have long been a mainstay in the health information infrastructure for providing critical information on health knowledge, behaviors, and outcomes at the population level. Household surveys are regularly conducted in developing countries by multi-national programs like the Demographic and Health Surveys (DHS), Multiple Indicator Cluster Survey (MICS), or national statistical offices. National household surveys typically provide data disaggregated by urban and rural areas, but they are often limited in the information they can provide to examine conditions within urban areas. They are not designed to provide information to examine heterogeneity and inequalities in health within cities. The issue is not only one of insufficient survey sample size—there are design and measurement issues that arise from objectives that are specific to urban health surveys. An example is to contrast slum populations with non-slum groups in the city.
The purpose of this paper is to discuss some of the measurement issues for designing and conducting household surveys in urban areas to capture key health outcomes and service utilization indicators for the major urban subpopulations (for example, slums and non-slums). We identify these issues from our experience in implementing the 2006 and 2013 Urban Health Surveys in the main cities of Bangladesh. We document the challenges faced and how we dealt with them to inform others who might conduct similar surveys in low-resource settings. Based on our field experiences in Bangladesh and reviewed global practices, we also proposed a framework for addressing the major measurement challenges in urban health surveys.
The 2006 and 2013 Bangladesh Urban Health Surveys
The 2006 Urban Health Survey (UHS) was a representative household survey of slums and non-slums within the City Corporations and urban areas within the District Municipalities of Bangladesh. The survey objective was to obtain a profile of health conditions, healthcare-seeking behavior, and socioeconomic characteristics in the main cities of Bangladesh, with explicit attention to examine differences between conditions in slum and non-slum groups within the City Corporations. To ensure the representativeness of the sample, the UHS team conducted a census and mapping of slums (CMS) in 2005 to identify the location and boundaries of slums and estimated population of the slums in the six City Corporations included in the UHS. The 2005 CMS provided the sampling frame for selecting representative slums and non-slums samples of households (Angeles et al. 2009). It documented more than 9,000 slums in Bangladesh, most in Dhaka (CUS, NIPORT and MEASURE Evaluation, 2006). Further details are provided in the Methodology section of the 2006 UHS Final Report (NIPORT et al. 2008).
The 2013 UHS had three main objectives. First, it sought to measure changes in key health outcomes and service utilization indicators in the same three overall domains as the 2006 UHS: slums and non-slums in City Corporations and district municipalities (referred to as “other urban areas” in the 2013 UHS to differentiate from large cities like City Corporations). Second, it examined sources of care for health services in slums and non-slums. Third, it attempted to determine if intra-urban differences in key health outcomes had narrowed between 2006 and 2013. The populations of interest were the slum and non-slum populations living in nine main cities and other urban areas. Again, further details are provided in the 2013 UHS Final Report (NIPORT, ICDDR,B, and MEASURE Evaluation, 2015).
Measurement issues
Several measurement issues need to be considered when designing surveys in urban areas. These issues include the definition/boundary of urban areas, particularly in the view of rapidly changing boundaries over time; identifying populations of interest within urban areas (e.g., slums); complex and diverse health service environments, including large numbers of private providers; lack of sampling frames for urban health providers; defining the relevant choice set/catchment areas for health services for urban populations; defining intervention and comparison groups in urban areas; and finally, non-response as well as missing eligible respondents (for surveys), and loss to follow up (for longitudinal data collection). We discuss each of these issues in turn with particular emphasis on three: the definition/boundary of urban areas; identifying populations of interest within urban areas; and defining the relevant choice set/catchment areas for health services for urban populations.
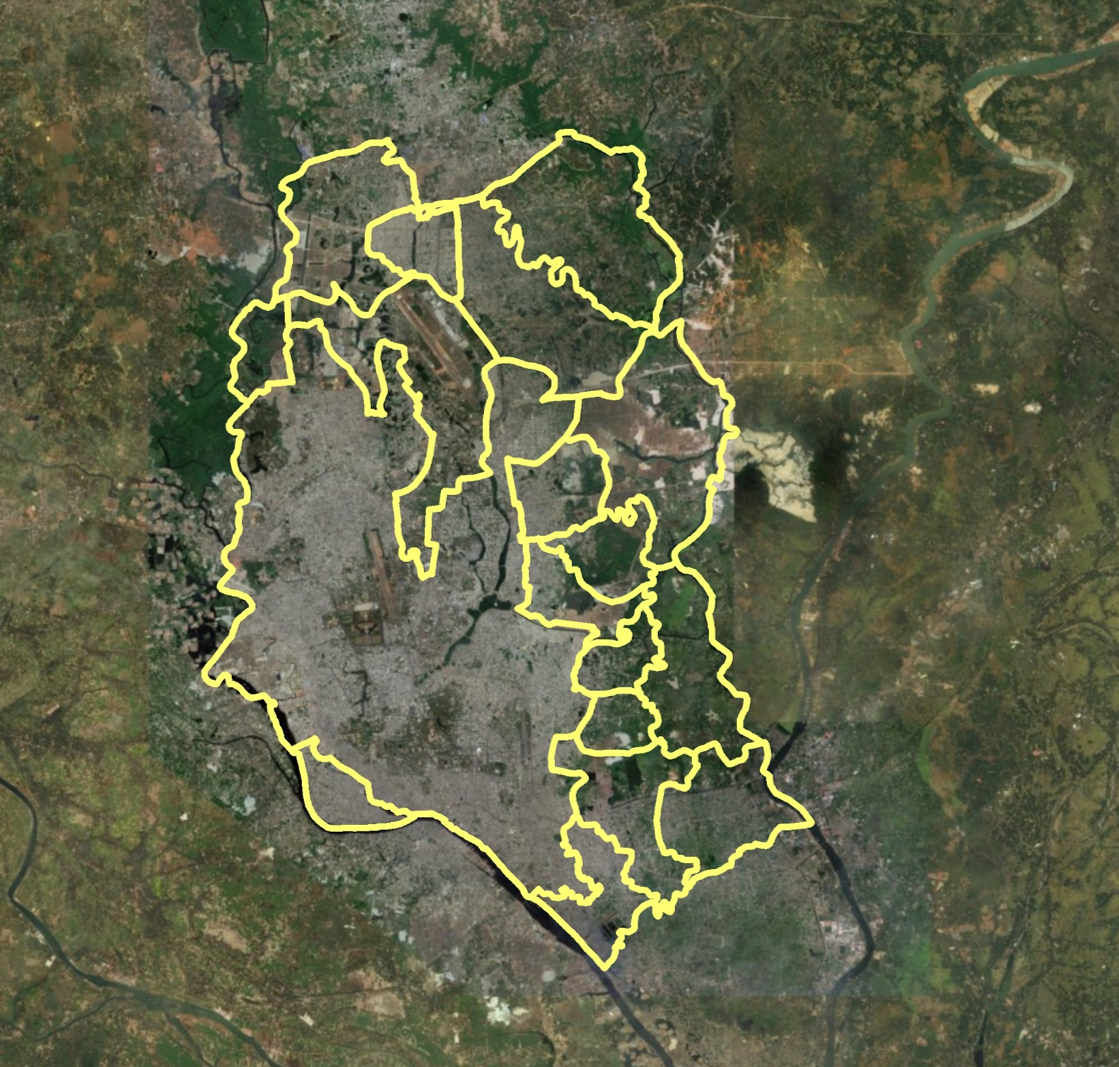
Figure 1. Boundaries of Dhaka Metropolitan Area (DMA)
Defining urban areas
The first step in designing a survey of urban populations is to define what we mean by urban areas. A common way to do that is to use recognized official administrative urban units and boundaries. For example, for the 2005 CMS, we defined urban areas as City Corporations. There were six City Corporations at that time: Dhaka, Chittagong, Khulna, Rajshahi, Sylhet, and Barisal. For Dhaka, the country’s capital, the survey included the City Corporations plus the 17 unions that comprise the Dhaka Metropolitan Area (DMA). The 2013 UHS defined urban areas as the nine current City Corporations and district municipalities with populations larger than 45,000 as determined by the 2011 National Population and Housing Census (BBS, 2014). The three new City Corporations were Rangpur, Narayanganj, and Comilla. The national statistical office, Bangladesh Bureau of Statistics (BBS), also used the concept of statistical metropolitan areas to define urban areas. These included Municipal Corporations and the adjacent localities having urban characteristics (which include: a majority of the male working population being engaged in the non-agricultural sector; availability of amenities like roads, electricity, community centers, water supply, sanitation, sewerage system, etc.; and being densely populated) (BBS, 1994). Figure 1 shows a satellite image with the boundaries of the DMA.
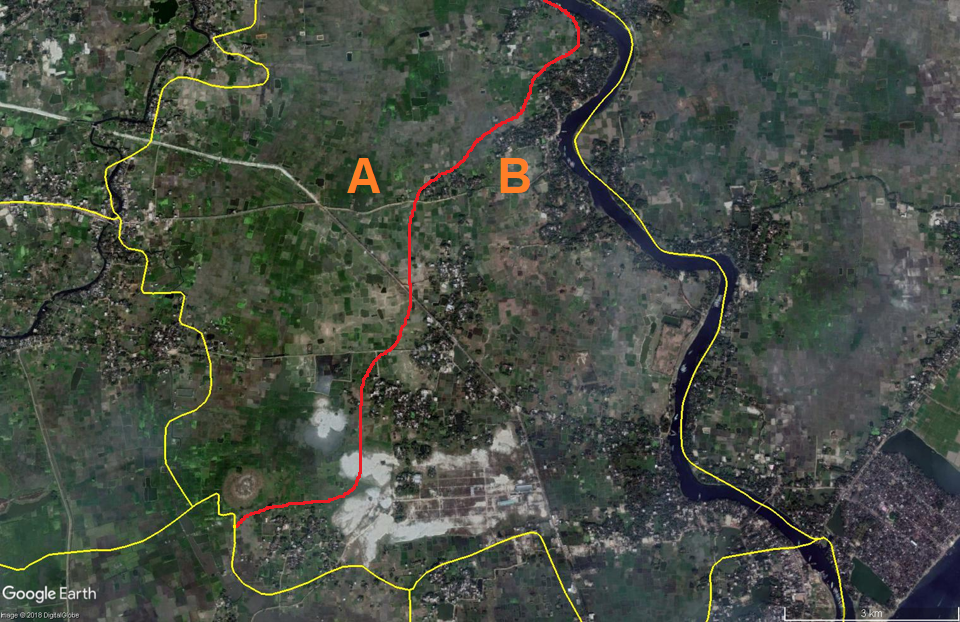
However, our interest is in the population of Dhaka, and the city has extended well beyond its administrative boundaries and has a significant portion of its population in adjacent areas. Figure 2 shows two large and densely populated areas just outside the DMA boundaries. Despite the continuation of the city across the river in the Southwest of Dhaka, the Keraniganj area (circled A) was not included in the sample frame of the UHS. A similar situation occurs in the Northern part of the city (circled B). We can also find administrative areas with the opposite issue—those classified as urban but contain quite large rural tracts. For example, Figure 3 shows a union that is classified as part of the DMA but that has a very dispersed population and cultivation areas—the area on the left in that union (marked A) is predominantly agricultural area, and the right side (marked B) is primarily urban.
Figure 2. Large areas of city expansion outside DMA boundaries
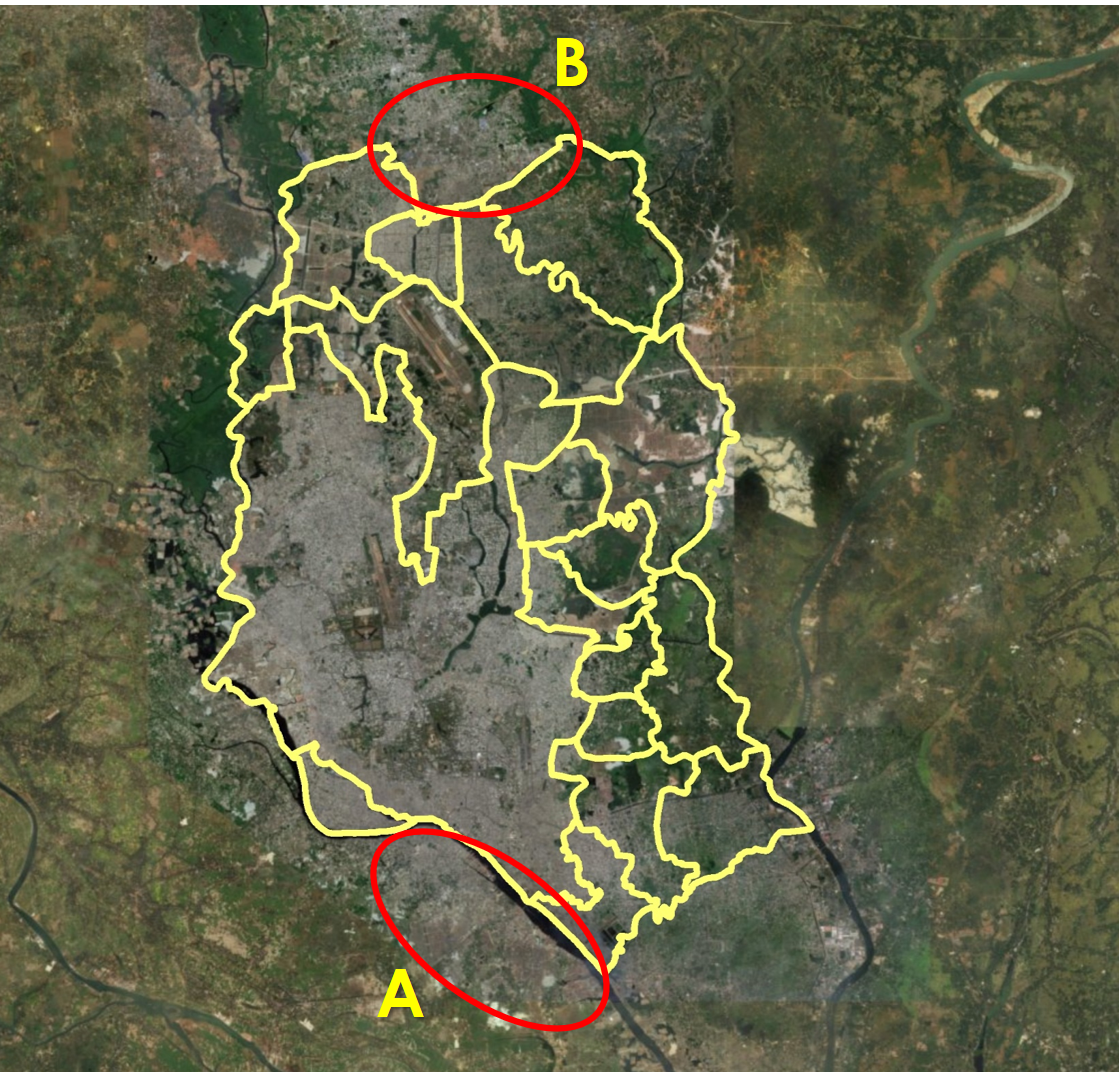
Figure 3. A union of the DMA with dispersed population and agricultural areas
The issue of urban sprawl beyond the recognized administrative boundaries of the city is probably no surprise to most readers, but it has implications for surveys in urban areas, which must cover a clearly defined geographic space. Administrative boundaries offer a number of advantages for defining that urban space because they are standardized, replicable boundaries (i.e., different researchers will not define them differently), and census data on population size are typically available for standardized administrative units, making it easier to calculate sample selection probabilities and certain per capita-type indicators (e.g., for health services). Administrative boundaries are also relatively stable over time, so it is easier to know what you are comparing for trend analysis. Alternative approaches require the researcher to determine the urban boundaries based on some criteria, which may vary from researcher to researcher and lead to non-standard boundaries for which it is difficult to obtain other data, such as population size estimates. Administrative boundaries also often coincide with planning authorities, making the data more policy-relevant and actionable.
However, using administrative boundaries clearly risks missing important urban areas that fall around the edge of the administrative boundaries and likely underestimates the urban population and services in rapidly expanding cities. Similarly, there is the possibility of overestimating urban populations in less dense urban areas, as the urban land area may expand faster than the population grows and urban expansion or sprawl does not necessarily mean a similar level of increase in the population size (Angel et al. 2011; Wolff, Haase, and Haase, 2018). Importantly, the population living just outside of the administrative boundaries is likely different from the population within the boundaries. For example, recent migrants may locate to newer settlements on the city’s outer edges beyond the administrative boundaries, and these migrants may be poorer and have poorer living environments (WEF, 2017; Schiller and Çağlar, 2011). Excluding migrants and other migrant poor can affect the conclusions drawn about the characteristics of the urban population. Rapid population influx and urbanization mean that urban slums are rapidly expanding and changing environments. However, administrative boundaries are usually only modified in response to decennial census data.
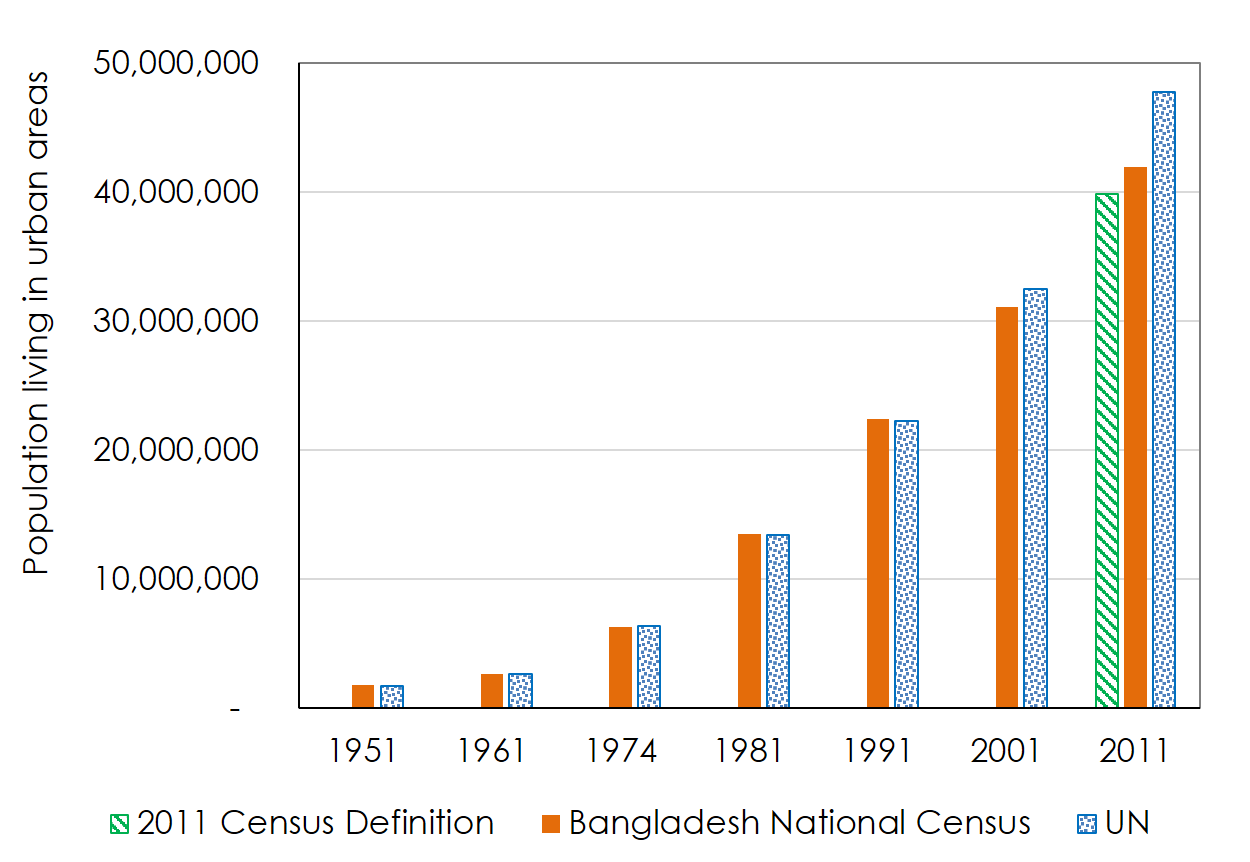
Particularly for the 2013 UHS, the use of urban boundaries posed a challenge. The definition of urban area used by BBS in the 1981 National Census was continued up to 2001 and changed in 2011. In the earlier censuses, the urban area included city corporations, municipalities, upazila (sub-district) headquarters, growth centers, cantonment area, and urban agglomerations adjacent to large cities (termed as Statistical Metropolitan Areas—SMAs) (Dewan and Corner, 2014; Hossain, 2011). In 2011, the concepts of SMA, growth center, and some other urban areas were abandoned and only the City Corporations, municipalities (paurashavas), upazila headquarters, and cantonment area were considered as urban. Due to this definitional change, the percentage of the urban population decreased slightly to 23.3% in 2011 compared to 23.5% in 2001. If the same definition of urban areas had been used in 2011 as previously used, the percentage of the urban population would have been 28.0% in 2011 (BBS, 2014). This definitional change also resulted in a difference of nearly eight million people in urban population estimates from the 2011 national census source and international source (see Figure 4) (United Nations, 2014; BBS, 2014; BBS, 1994).
Figure 4. Urban population estimates for Bangladesh from national and international sources
Identifying populations of interest within urban areas: slum residents
Populations living in slum areas are often of particular interest for urban health. There is no standard definition of a slum, and multiple definitions are found in the literature. Yet the definition and measurement methods used are important, as they determine survey sampling frames. Nolan reviewed the implications of different definitions for measuring health inequities in India (Nolan, 2015). While there is general agreement on criteria (density, crowding, water and sanitation, housing material, low SES), there is no agreement on cut-off points. The most widely accepted definition is probably the United Nations Human Settlement Program’s (UN-Habitat) definition, which defines a slum as “one or a group of individuals living under the same roof in an urban area and lacking one or more of the following: durable housing, sufficient living area, access to improved water, access to improved sanitation, and secure tenure” (UN-HABITAT, 2003). However, varying slum definitions often result in a large difference in estimates from different sources. In 2001, UN-Habitat estimated that there were 155 million slum dwellers in India following their definition, compared with 54 million reported by the Census of India, who used the slum definition as ‘a compact area of at least 300 population or about 60–70 households of poorly built congested tenements, in an unhygienic environment usually with inadequate infrastructure and lacking in proper sanitary and drinking water facilities in addition to urban areas already identified/recognized as slums by state/local government and union territories administration’ (Patel, Koizumi, and Crooks, 2014). In Bangladesh, the most recent census of slum areas and floating population by BSS used the following definition for slums: a cluster of compact settlements of 5 or more households which generally grow very unsystematically and haphazardly in an unhealthy condition and atmosphere on government and private vacant land or owner-based household premises (BBS, 2015). In 2014, BBS estimated that 6.33% of the urban population in Bangladesh (2.2 million in total) was living in urban slums (BBS, 2015), which was much less than national and global sources (UN-HABITAT, 2021; CUS, NIPORT, and MEASURE Evaluation, 2006),
In preparation for the 2006 UHS, the 2005 CMS operationalized the UN-Habitat definition of a slum the following way: settlements with a minimum of 10 households or a mess unit with a minimum of 25 members, and predominantly very poor housing, very high population density, very poor water and sanitation, very low socioeconomic status, and lack of secure tenure (UN-HABITAT, 2003). In the case of the 2005 CMS, slums were defined at a community level, rather than at an individual household level, based on information on the characteristics of neighborhoods (or households) collected from key community informants and specific thresholds were set for each of the characteristics to define slums. The slum mapping in the city corporations involved multiple stages in the 2005 CMS, including a census of slums combining satellite images with “ground-truthing” of all city wards to confirm the slum classification of suspected settlements and estimate the slum population. The complete process was documented elsewhere (Angeles et al. 2009). While this approach was comprehensive and provided a complete sampling frame for the slum and non-slum domains for the 2006 UHS, as well as publicly available maps that were used for a wide range of planning purposes, it was also expensive and time-consuming. Therefore, alternative approaches have been used since then to reduce costs. The sampling approach used in the 2013 UHS reduces the number of areas teams have to visit, which is expected to increase the quality of identification of slums, but the omission of satellite images to help locate slums might offset that to some degree.
The 2013 UHS only mapped slums for a random sample of areas (specifically Mohallas, defined as urban communities) within the City Corporations rather than a full census of slums. This method has the advantage of providing a representative sample at considerably reduced costs but does not provide a complete map of slum areas for planning purposes. Besides, the estimates of the characteristics of slum areas are subject to sampling errors. Satellite images were not used to pre-identify possible slum areas, as was done in the 2005 CMS.
We compared the 2005 CMS approach with an alternative approach by Gruebner and colleagues (2014) for developing comprehensive maps of slum areas. Their approach uses existing data only, particularly the analysis of high-resolution satellite images and historical satellite data, to construct maps for different time points without any “ground truthing” to save costs. Hence, their approach requires skills in geographic information system (GIS) methods and analysis of satellite images. The definition of slums is limited to features that can be readily identified by satellite images from above, which differs from the definition used by UN-Habitat or in the 2005 CMS. Also, the absence of field teams limits adding additional community/slum characteristics. Figure 5 compares the slum boundaries obtained from the 2005 CMS (in yellow) with those obtained for 2006 from the Gruebner and colleagues’ (2014) method (in red) for a section of Dhaka. We can see areas where the two sets of boundaries are quite similar such as the area to the right in the figure (circle A). However, we can also see areas in which the two approaches identify quite different areas, such as the area to the left (circle B).
Figure 5. Comparison of slum maps from the 2005 CMS and Gruebner et al. (2014)
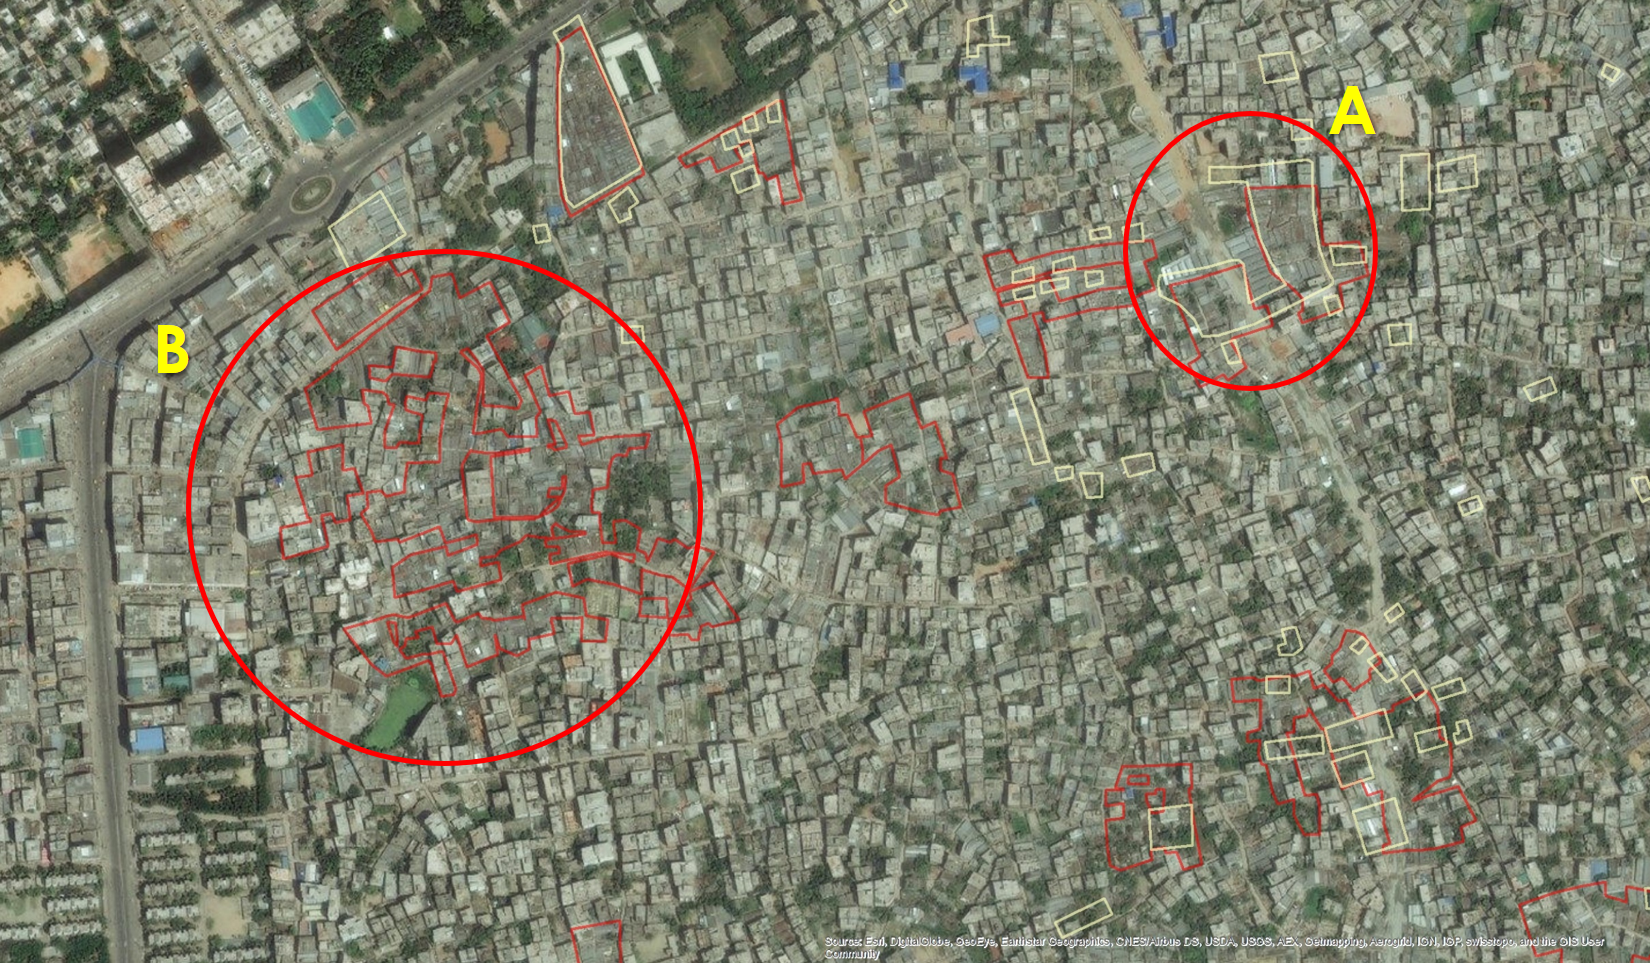
The area adjacent to circle A in Figure 5 was identified as a potential slum area in 2006 from the Gruebner and colleagues’ (2014) boundaries but not in the 2005 CMS. Overall, Gruebner and colleagues (2014) identified a larger area as potential slum areas than the 2005 CMS identified. Such differences are not surprising given the different definitions and methods. For example, Gruebner and colleagues (2014) noted the potential for erroneous inclusion of industrial areas as slums because they look similar in satellite images. The 2005 CMS ground-truthing activity aimed to catch such errors. There may also have been genuine changes in slum geography between 2005 and 2006, especially given flooding in the period between the two studies. The point here is not to criticize one method over another—identifying non-standard populations of interest is a difficult exercise, and different methods have different advantages and disadvantages. Rather, the takeaway is that there is no one correct solution for all circumstances, so it is important to be aware of the methods used and their implications when using such data.
Defining the relevant catchment areas for health services
Health service environments in urban areas are diverse and complex, with a combination of public, private, and non-profit providers, and where health facilities and services are administered by different authorities (WHO and UN-HABITAT, 2010b). A health facility mapping of urban slum settlements in Dhaka by Adams, Islam, and Ahmed (2015) found that pharmacies (drug stores) and non-formal/traditional doctors make up 60% of the health service delivery points in urban areas, followed by physician’s consultation chambers (20%), public hospitals and satellite clinics (12%) and NGO clinics (6%). Spatial access to services is of interest to study inequity within urban areas and to evaluate the impact of changing spatial access on health behaviors and outcomes (e.g., when evaluating the impact of programs). Measuring spatial access to services is challenging in rural areas, but those challenges are magnified in urban areas. Some examples of problems encountered in measuring access to health services in urban areas include large numbers of providers in a small geographic space; catchment areas of facilities are difficult to define and overlap with those of other facilities; and a large for-profit private sector, which may not be well-documented.
We briefly illustrate the catchment issue with an example from the 2008 and 2011 Smiling Sun Franchise Program (SSFP) Urban Evaluation Surveys (Lance, Angeles, and Islam, 2009; MEASURE Evaluation, 2013). The sampling design called for sampling households from within the catchment areas of SSFP clinics, which were defined for each clinic. For sampling, we had to translate the catchment area on a clinic map onto a listing map with clearly defined boundaries. These boundaries are often not standard administrative boundaries, so it took some effort on the ground to determine these boundaries and turn them into maps that could be used for areas that could be listed. The population sizes of these areas also had to be confirmed from the listing operation. Adjacent geographic areas that fell outside of the clinic’s catchment area and were not served by another SSFP clinic also had to be identified, which took a lot of work on the ground given the complex health service environment in large urban areas and non-standard boundaries. In smaller urban areas, a different problem was encountered—the SSFP clinic might serve the entire urban area, and all adjacent areas were rural so could not be used as comparison areas. A different strategy had to be used to identify other nearby urban areas that could serve as comparison areas.
The SSFP evaluation surveys included a community survey in which key informants were asked to identify all the facilities used by members of their community. Figure 6 illustrates the complexity of the urban service environment and the challenge of defining precise boundaries for clinic catchment areas (MEASURE Evaluation, 2013). As would be expected, virtually all urban communities in project catchment areas reported an SSFP clinic used by their community, but so did adjacent non-project catchment area communities. Both project and non-project catchment area communities also reported a range of other types of provider used by their community. Overall, the mean number of facilities reported as used by community members was 11 for urban project communities and 10 for urban non-project communities.
Figure 6. Percentage of urban communities reporting different types of facilities
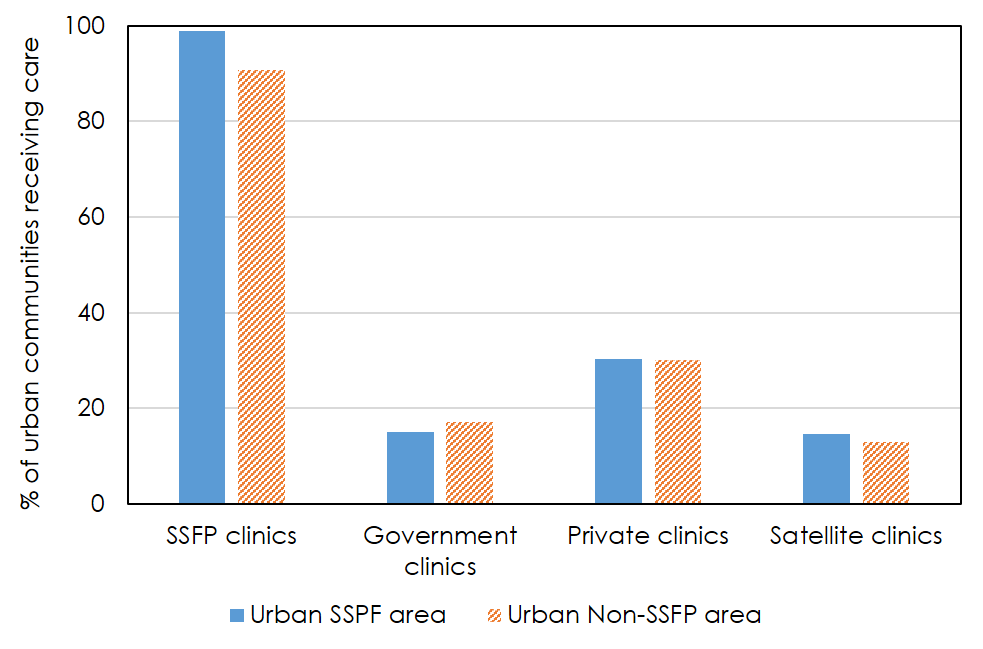
Figure 7. Percentage of service users who report different types of providers
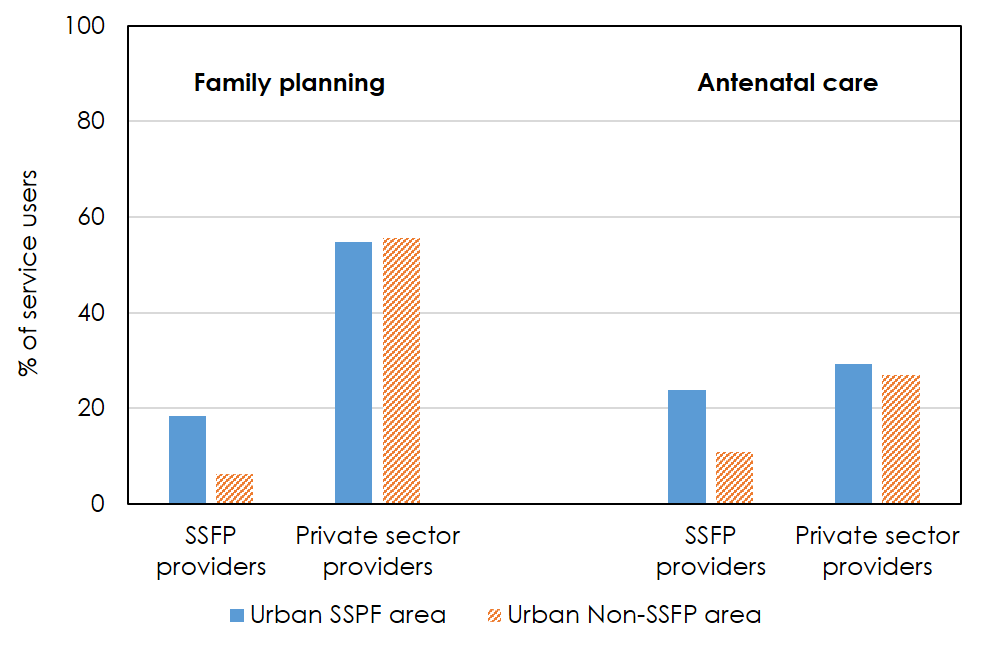
The picture is a little different when looking at the actual choice of providers reported by individual respondents, however. Despite the similar spatial access environment reported in the community survey, the use of SSFP providers for both family planning (FP) and antenatal care (ANC) was higher among those living in SSFP catchment areas. However, about 6% of FP users and 11% of ANC users in non-project catchment areas did report using SSFP clinics (Figure 7) (MEASURE Evaluation, 2013). Thus, the actual choice of providers reported by individual respondents/service users may be more accurate (assuming the survey sample is representative of the population of interest). Service users clearly cross catchment area boundaries, as would be expected, but there is ‘distance decay’ in the use of a clinic as one moves further away from itn public health, the phenomena that health services use decreases with increasing distance between health facilities and user’s location is often labeled by the term distance decay (Shannon, Bashshur, and Metzner, 1969). It is also clear that a large proportion of users use other types of providers too, with over half of FP users and over a quarter of ANC users reporting private sector providers, for example. The private sector health service environment can be particularly difficult to fully capture. The lack of sample frames for urban health providers, particularly for the private for-profit sector and informal providers, has remained a challenge. As of November 2015, the Directorate General of Health Services of the Ministry of Health and Family Welfare registered 13,341 private hospitals, clinics, and diagnostic centers in Bangladesh (DGHS 2015). The health facility mapping in urban areas of Bangladesh listed 12,963 health facilities (inpatient, outpatient, pharmacies, and diagnostic centers) in Dhaka City Corporation alone (Adams, Islam, and Ahmed, 2015).
A framework for addressing the measurement challenges
In light of the measurement challenges of conducting surveys in urban settings mentioned above, we proposed a framework for conducting urban health surveys. In addition to our experiences from two urban health surveys in Bangladesh, we reviewed national and global practices in this regard.
Household sample surveys are increasingly being utilized to plan and evaluate health policy programs at national and sub-national levels. In order to get nationally (or for specific strata like total urban, large cities, etc.) representative estimates, a multistage sampling procedure is commonly performed. Under this procedure, the sample of households is selected from previously selected larger sampling units (Alves et al. 2011). This strategy presupposes the existence of complete lists of sampling units throughout all stages of selection (e.g., all slums within the target population with a complete listing of the households within slums). Urban slums are inherently transient, and these informal settlements can move rapidly from one place to another, affected by natural disasters (river erosions, for instance), evictions by city authorities, or resettlements under the government’s poverty reduction/social protection programs. Creating a complete list of slums and updating it in regular intervals is not only resource-intensive, but also not feasible in many of the developing countries. Alves and colleagues (2011) evaluated two sampling frame techniques (viz., using census/complete list of slums/non-slum household addresses and creating of clusters/segments for listing and random selection) and found that the sampling strategy utilizing clusters of households was superior in terms of speed and ease of the listing,the localization and identification of households during the performance of interviews, greater access to the interviewees, and greater stability of the lists. The disadvantages reported were the potential homogeneity within segments and the possibility of less detailed information on the population. The use of segments can also reduce sampling errors due to problems related to identifying selected households and allow for the inclusion of households that were not previously listed. Although the sampling of segments has been used in diverse health surveys, authors demonstrated that this type of sampling is particularly advantageous when applied in slums, which are characterized by disorganized and dense housing patterns (Alves et al. 2011). Based on our experience from UHS 2013, we also found that randomly selecting a sample of urban units (termed as Mohalla in Bangladesh) in the first stage and complete mapping to identify and map all slum and non-slum clusters (30–35 households per cluster) in the selected Mohallas was a feasible sampling strategy (NIPORT, ICDDR,B, and MEASURE Evaluation, 2015). The potential limitations of this approach (i.e., sampling of segments) are biased samples and high sampling error, which are common for two-stage cluster sampling designs.
As discussed earlier, slum identification in urban areas remains a major challenge and is crucial for any urban health survey. However, using conventional methods for slum detection, such as field surveys, can be time-consuming and costly. Our experience from the 2005 CMS indicates that slum identification using high resolution satellite pictures and ground-truthing offers a faster and less expensive alternative for properly identifying the slum settlements. Due to the increasing availability of satellite platforms and advances in analysis methods during the last decade, remote sensing imagery has the potential to become an alternative source of information in urban settings (Duque et al. 2017). There has been a substantial increase in the number of studies regarding the usefulness of remote sensing imagery to identify human settlements—between 2000 and 2015, nearly 90 scientific articles have been published, demonstrating that the physical characteristics of slums are distinguishable from the physical characteristics of formal settlements by using remote sensing data (Kuffer, Pfeffer, and Sliuzas, 2016). This is an important advancement for urban health surveys where information on informal settlements like slums is scarce, and government systems may not fully acknowledge the existence of slums for their policy positions.
Analytical procedures for slum identification in urban areas from satellite imagery are diverse. Among these, texture-based image analysis using Google Earth images showed a promising accuracy of 74% in automatically detecting slums (Praptono et al. 2013)—in this study, Gabor filter and texture features were employed to create the image representation of slums and non-slums based on the regularity and density of the settlements, which provided substantially better results than the previous works (Kit, Lüdeke and Reckien, 2012). Increasingly, researchers are using machine-learning algorithms for urban image classification, which are information-driven approaches that allow for repetitive learning from a large and rich set of training data (Niebergall, Loew, and Mauser, 2008). In terms of more sophisticated analytical methods, a recent study on implementing a low-cost, standardized strategy for slum detection using spectral, texture, and structural features extracted from Google Earth compared capabilities of three machine learning algorithms (i.e., Logistic Regression, Support Vector Machine, and Random Forest)—using data from Argentina, Colombia, and Brazil, the study determined Support Vector Machine with radial basis kernel (SVMrbk) performed the best to classify urban areas as either slum or no-slum (Duque et al. 2017). Based on cost, methodological rigor, and technical expertise requirements, we opine that texture-based image analysis using aerial images can potentially be an effective approach to identify slum settlements for urban health surveys. To mitigate the risks of misclassification of slums, ground-truthing also needs to take place in the settlements identified by remote sensing as seen in other countries (Krishna, Sriram, and Prakash, 2014).
Resolving catchment area issues in delivering health services is more complicated and requires a long-term approach. Our experience from development and implementation of an Electronic Management Information System (eMIS) to automate the business processes of community health workers in Bangladesh indicate that a shortage of community health workers from the public sector makes expanding the population registration system in urban areas not feasible in the near future (MEASURE Evaluation, 2019). The preliminary results from the population registration system in rural areas of Bangladesh clearly demonstrated that such a system could effectively address catchment area issues in delivering essential primary health care to the urban poor.
Conclusions and the way forward
The purpose of this paper was to share some of the measurement issues we faced and approaches we used to address them in the surveys we have done in urban Bangladesh. Measurement of health behaviors and outcomes in urban areas is an active area of research. There is often no single way to address a problem, and new approaches are emerging and being tested all the time. As we learn from these experiences, standards and best practices will emerge. In such a dynamic area, it is critical to clearly document methods used, the choices made, and their implications. For public health researchers and health policymakers as consumers of urban health data, it is essential to understand the methods used and critically assess their implications when interpreting results. These measurement issues bring challenges but also the opportunity for innovation.
Based on our experience implementing the 2006 and 2013 UHSs in the main cities of Bangladesh and review of available examples in similar contexts, we highlight the following options for conducting similar surveys to capture key health outcomes and service utilization indicators in urban areas in the coming years:
- Design of urban health surveys should follow a three-stage sampling procedure, where defined primary sampling units (PSUs) will be randomly selected with probability proportionate to size (PPS)—PSUs are the area units around which the fieldwork (mapping, segmentation, or listing of households) will be organized. The segments will be selected as random in the second stage, and the particular households within a segment that would be designated for interview in the survey in the third stage. The process needs to involve extensive ground-truthing to identify slums in the sampled second-stage segments for strengthening precision. To ensure greater reliability, urban health surveys should be planned and implemented shortly after such a population census.
- The use of high-resolution satellite pictures offers a faster and less costly alternative to the CMS approach (i.e., satellite picture as well as ground-truthing) for slum identification. However, without ground-truthing, the risks of misclassification of slums will be higher. The use of texture-based image analysis on aerial imagery can be an efficient, cost-effective identification approach. An opportunity to combine national population censuses with GIS analysis to identify the different types of settlements (for example, urban slums and non-slum settlements) will give a global picture of settlements across the entire country and guide future surveys.
- Develop an updated list of health service delivery points in the urban areas, preferably by the public officials, to strengthen the Ministry/Department of Health’s regular monitoring and regulatory activities. For example, in the absence of an official updated list of healthcare providers in the urban areas, expanding the coverage of Urban Health Atlas (ICDDR,B, 2017) and filling in the information gaps with periodic updating will serve as a useful ‘master list’ of health service delivery points in the urban areas in Bangladesh.
References
- Adams, A.M., Islam, R., Ahmed, T. (2015). Who serves the urban poor? A geospatial and descriptive analysis of health services in slum settlements in Dhaka, Bangladesh. Health Policy and Planning, 30(S1), i32–i45.
- Alves, M.C.G.P., Morais, M.L.S., Escuder, M.M.L., Goldbaum, M., Barros, M.B.A., Cesar, C.L.G., Carandina, L. (2011). Household sampling in slums in surveys. Revista de Saude Publica, 45(6), 1099–1109.
- Angel, S., Parent, J., Civco, D. L., Blei, A., & Potere, D. (2011). The dimensions of global urban expansion: Estimates and projections for all countries, 2000–2050. Progress in Planning, 75(2), 53-107.
- Angeles, G., Lance, P., Barden-O’Fallon, J., Islam, N., Mahbub, A.Q.M., Nazem, N.I. (2009). The 2005 census and mapping of slums in Bangladesh: design, select results and application. International Journal of Health Geographics, 8(32), 1–19.
- Asian Development Bank (ADB). (2012). The Urban Governance and Infrastructure Improvement Project in Bangladesh: Sharing Knowledge on Community-Driven Development. Metro Manila: ADB.
- Bangladesh Bureau of Statistics (BBS). (2015). Census of Slum areas and Floating Population 2014. Final Report. Dhaka: Ministry of Planning.
- Bangladesh Bureau of Statistics (BBS). (2014). Bangladesh Population and Housing Census 2011: Urban Area Report. National Report Volume 3. Dhaka: Ministry of Planning.
- Bangladesh Bureau of Statistics (BBS). (1994). Bangladesh Population Census 1991: Analytical Report. National Series Volume 1. Dhaka: Ministry of Planning.
- Center for Urban Studies (CUS), National Institute of Population Research and Training (NIPORT), MEASURE Evaluation. (2006). Slums of urban Bangladesh: mapping and census, 2005. Dhaka and Chapel Hill, NC: CUS, NIPORT, MEASURE Evaluation.
- Dewan, A., Corner, E. (Eds.) (2014). Dhaka Megacity: Geospatial perspectives on urbanisation, environment and health. Dordrecht: Springer.
- Directorate General of Health Services (DGHS). (2015). Health Bulletin 2015. Dhaka: Ministry of Health & Family Welfare.
- Duque, J. C., Patino, J. E., and Betancourt, A. (2017). Exploring the potential of machine learning for automatic slum identification from VHR imagery. Remote Sensing, 9(895), 1‒23.
- Ferguson, B., Navarrete, J. (2003). A financial framework for reducing slums: lessons from experience in Latin America. Environment and Urbanization, 15(2), 201–16.
- Government of Bangladesh. (2017). Local Government Engineering Department: Urban Management Unit. Dhaka: Ministry of Local Government, Rural Development & Cooperative.
- Govindaraj, R., Raju, D., Secci, F., Chowdhury, S., Frere, J.J. (2018). Health and Nutrition in Urban Bangladesh: Social Determinants and Health Sector Governance. Directions in Development Series. Washington, DC: World Bank.
- Gruebner, O., Sachs, J., Nockert, A., Frings, M., Khan, M., Hossain, M., Lakes, T. and Hostert, P. (2014). Mapping the Slums of Dhaka from 2006 to 2010. Dataset Papers in Science, 2014(172182), 1‒7.
- Hossain, S. (2011). Urban Poverty in Bangladesh: Slum communities, migration and social integration. Library of Development Studies Volume 3. London: I.B. Tauris & Co Ltd.
- International Centre for Diarrhoeal Disease Research, Bangladesh (ICDDR,B). (2017). Urban Health Atlas. Dhaka: Health Systems and Population Studies Division (HSPSD), ICDDR,B. Retrieved December 30, 2017 (http://urbanhealthatlas.com/).
- MEASURE Evaluation. (2019). Implementation of the Electronic Management Information System in Bangladesh: Experience and Lessons Learned. Chapel Hill, NC: MEASURE Evaluation.
- Kit, O., Lüdeke, M., Reckien, D. (2012). Texture-based identification of urban slums in Hyderabad, India using remote sensing data. Applied Geography, 32(2), 660–667.
- Krishna, A., Sriram, M.S., Prakash, P. (2014). Slum Types and Adaptation Strategies: Identifying Policy-Relevant Differences in Bangalore. Environment and Urbanization, 26 (2), 568–585.
- Kuffer, M., Pfeffer, K., Sliuzas, R. (2016). Slums from space—15 years of slum mapping using remote sensing. Remote Sensing, 8(455), 1‒29.
- Lance, P., Angeles, G., Islam, S. (2009). 2008 Baseline Urban Bangladesh Smiling Sun Franchise Program (BSSFP) Evaluation Survey. Dhaka and Chapel Hill, NC: Mitra and Associates and MEASURE Evaluation.
- MEASURE Evaluation. (2013). Smiling Sun Franchise Program (BSSFP) Endline Survey Report 2011. Chapel Hill, NC: MEASURE Evaluation.
- National Institute of Population Research and Training (NIPORT), MEASURE Evaluation, International Centre for Diarrhoeal Disease Research, Bangladesh (ICDDR,B), and Associates for Community and Population Research (ACPR). (2008). 2006 Bangladesh Urban Health Survey. Dhaka and Chapel Hill, NC: NIPORT, MEASURE Evaluation, ICDDR,B, and ACPR.
- National Institute of Population Research and Training (NIPORT), International Centre for Diarrhoeal Disease Research, Bangladesh (ICDDR,B), and MEASURE Evaluation. (2015). Bangladesh Urban Health Survey 2013 Final Report. Dhaka and Chapel Hill, NC: NIPORT, ICDDR,B, and MEASURE Evaluation.
- Nazem, N. I., Hossain, M. A. (2012). Mapping Poor Settlements in 27 Cities and Towns of Bangladesh: UPPR Experience. Dhaka: Center for Urban Studies. Retrieved May 21, 2018 (http://www.academia.edu/9670644/Mapping_Poor_Settlements_in_27_Cities_and_Towns_of_Bangladesh_UPPR_Experience).
- Niebergall, S., Loew, A., Mauser, W. (2008). Integrative assessment of informal settlements using VHR remote sensing data—The Delhi case study. IEEE Journal of Selected Topics in Applied Earth Observations and Remote Sensing, 1(3), 193–205.
- Nolan, L.B. (2015). Slum definitions in urban India: implications for the measurement of health inequalities. Population and Development Review, 41(1), 59–84.
- Patel, A., Koizumi, N., Crooks, A. (2014). Measuring slum severity in Mumbai and Kolkata: A household-based approach. Habitat International, 41, 300–306.
- Pearson, L., Newton, P., Roberts, P. (Eds.) (2014), Resilient sustainable cities: A future. New York: Routledge.
- Praptono, N.H., Sirait, P., Fanany, M.I., Arymurthy, A.M. (2013). An automatic detection method for high density slums based on regularity pattern of housing using Gabor filter and GINI index. In: Proceedings of the IEEE Advanced Computer Science and Information Systems (ICACSIS), Bali, Indonesia, 28–29 September 2013, pp. 347–351.
- Schiller, N. G., Çağlar, A. (Eds.). (2011). Locating migration: Rescaling cities and migrants. Ithaka and London: Cornell University Press.
- Shannon, G. W., Bashshur, R. L., & Metzner, C. A. (1969). The concept of distance as a factor in accessibility and utilization of health care. Medical Care Review, 26(2), 143–161.
- Simon, D., Arfvidsson, H., Anand, G., Bazaz, A., Fenna, G., Foster, K., Jain, G. et al. (2016). Developing and testing the Urban Sustainable Development Goal’s targets and indicators–a five-city study. Environment and Urbanization, 28(1), 49–63.
- Sticzay, N., Koch, L. (2015). Slum upgrading. GSDR 2015 Brief. Wageningen: Wageningen University and Research Centre.
- United Nations. (2014). World Urbanization Prospects: The 2014 revision. New York: Department of Economic and Social Affairs, Population Division.
- United Nations Development Programme (UNDP). (2014). Targeting Urban Poverty Reduction: Policy and institutions for inclusive urban governance. Dhaka: UNDP/Bangladesh.
- United Nations Human Settlements Programme (UN-HABITAT). (2021). Urban Indicators Database. Retrieved November 09, 2021 (https://data.unhabitat.org/).
- United Nations Human Settlements Programme (UN-HABITAT). (2003). The challenge of slums: Global Report on Human Settlements 2003. London and Sterling, VA: Earthscan Publications Ltd.
- Urban Health Systems Strengthening Project (UHSSP). (2016). Health Seeking Behaviour and Population Coverage of DFID’s Urban Health Programme in Selected Areas. London and Dhaka: Options Consultancy Services UK and Partners in Health and Development (PHD).
- Vlahov, D., Freudenberg, N., Proietti, F., Ompad, D., Quinn, A., Nandi, V., & Galea, S. (2007). Urban as a determinant of health. Journal of Urban Health, 84(1), 16–26.
- Wolff, M., Haase, D., & Haase, A. (2018). Compact or spread? A quantitative spatial model of urban areas in Europe since 1990. PloS one, 13(2), e0192326.
- World Economic Forum (WEF). (2017). Migration and Its Impact on Cities. Geneva: WEF. Retrieved November 09, 2021 (https://www3.weforum.org/docs/Migration_Impact_Cities_report_2017_HR.pdf).
- World Health Organization (WHO), United Nations Human Settlements Programme (UN-HABITAT). (2010a). Urban Health Inequities Revealed. In: Hidden Cities: Unmasking and Uncovering Health Inequities in Urban Settings. Geneva: WHO.
- World Health Organization (WHO), United Nations Human Settlements Programme (UN-HABITAT). (2010b). Health in an Urban Context. In: Hidden Cities: Unmasking and Uncovering Health Inequities in Urban Settings. Geneva: WHO.
-
Keywords
calibration CATI coverage coverage bias cross-national surveys data linkage data quality European Social Survey experiment face-to-face face-to-face survey Facebook hard to reach populations incentives item nonresponse measurement measurement error mixed-mode surveys multitasking non-probability samples Nonresponse nonresponse bias nonresponse rates paradata PIAAC Probability sample probability samples QR codes rare populations response rate Satisficing social desirability Social media survey survey-taking climate survey data survey management survey methods Telephone survey telephone surveys total survey error unit nonresponse validity web survey Web surveys weighting
