

Cost Efficiency of Incentives in Mature Probability-based Online Panels
Research note
Lipps,O., Jaquet, J., Lauener L., Tresch A. & Pekari, N. (2022). Cost Efficiency of Incentives in Mature Probability-based Online Panels. Survey Methods: Insights from the Field. Retrieved from https://surveyinsights.org/?p=17115
The data used in this paper are available on request from the authors.
© the authors 2022. This work is licensed under a Creative Commons Attribution 4.0 International License (CC BY 4.0) 
Abstract
Little is known about the trade-off between response rates and sample selection on the one hand and costs of different incentives on the other hand in mature online panel surveys. In wave 5 of the Panel Survey of the Swiss Election Study (Selects), a conditional CHF 20 (cash) is used for the politically least interested, while the remaining sample is randomized in two incentive groups: a conditional CHF 10 (cash) and a lottery (5x300 CHF). In the two experimental groups, there are only small differences regarding sample composition, and response rates are only slightly higher in the more expensive cash group. Given that costs are significantly lower in the lottery group, we conclude that it may be possible to save costs on incentives in a mature panel.
Keywords
costs, incentives, mature panel, online, Probability sample, response
Copyright
© the authors 2022. This work is licensed under a Creative Commons Attribution 4.0 International License (CC BY 4.0)
Introduction
To keep response rates high in panel surveys, survey designers often rely on incentives. While there is a lot of evidence about effects of different incentives on response rates in cross-sectional surveys or in the first wave of a panel survey, we know surprisingly little about effects on response rates and costs of incentives in mature panel surveys. This is particularly the case in probability-based online panels on the general population. Trading-off the costs and the effects on response of incentives is even more relevant in longitudinal than in cross-sectional surveys: cumulative attrition leads to small and increasingly selective samples which make incentives necessary and – due to repeated use – expensive (Lynn 2009). In online surveys, incentives increase sample members’ response in the first wave and also the likelihood to becoming panel members; see Witte et al. (2021). However, the cost efficiency of incentives in subsequent waves should decrease, because as time passes, factors explaining respondents’ likelihood of participation other than incentives such as intrinsic motivation should play an ever-greater role than incentives.
In this paper, we analyze effects from an incentive experiment on response rates and costs of a probability-based online panel of Swiss adult citizens in wave 5 of an ongoing Panel Survey of the Swiss Election Study (Selects). Specifically, we use a conditional cash incentive (CHF 20) for those with a low response probability and randomize the remaining sample into a conditional cash incentive group (CHF 10) and a conditional lottery (5×300 CHF). Costs of the CHF 10 cash-incentive are about six times higher than those of the lottery-incentive. Given the maturity of our panel, we expect that while cost differences are substantial, the difference in attrition between the two groups is small and that the two designs do not lead to different sample compositions.
Incentives, response rates, and cost efficiency in longitudinal surveys
The incentive used in the first wave of “a particular longitudinal survey has long-term consequences for the survey both financially in terms of cost and the expectations of respondents” (Laurie & Lynn 2009: 209). For example, incentives offered in the first wave may lead to expecting incentives in subsequent waves. While most of the current literature (see e.g., McGonagle 2020) indicates that positive effects of incentives offered at the start of a panel persist across waves, others do not find such carryover effects (Becker & Glauser 2018; Wong 2020). Because nonresponse is especially high (Lepkowski & Couper 2002; Watson 2003; Uhrig 2008) and selective (Lipps 2007; Jäckle & Lynn 2008) in the first waves and because prepaid cash often performs best (Warriner et al. 1996; Pforr et al. 2015; Pforr 2016; Lipps et al. 2019), a good strategy may be to use an (expensive) unconditional cash incentive rather than a (inexpensive) lottery incentive in the first wave (Witte et al. 2021).
Regarding costs, Gajic and colleagues (2012) found in a cross-sectional survey of a general community population that while the prepaid cash incentive generated the highest response rates and no incentive generated the lowest, a lottery with few prizes was the most cost-effective incentive for obtaining completed interviews. The question is about which incentive is most efficient in subsequent waves: while the most efficient incentive with respect to response rates, prepaid cash, is also the most expensive alternative, the survey budget exerts constraints on what researchers can do in terms of survey designs (Olson et al. 2021). In mature panels, cost efficiency of expensive incentives may be lower since respondents who participate in several waves are more likely to be driven by other factors than incentives themselves (Pforr et al. 2015; Sacchi et al. 2018). For example, Pekari (2017) found that already after the first wave with an unconditional cash incentive, adding a cost-efficient lottery of iPads was just as effective as an expensive conditional cash-prize at reducing attrition for wave 2 and 3. Factors that are likely to become increasingly important for participation include a higher interest in the survey and a higher intrinsic motivation. For such motivated respondents using (inexpensive) conditional incentives in the following waves may be a sufficient motivator to continue to respond. While lotteries may work in later waves for respondents who did not need extra treatment (such as reminders) during the first waves, for more difficult respondents, it may be worth using more expensive incentives (Becker et al. 2019).
Data and experimental design
The Swiss Election Study “Selects” investigates the determinants of turnout and vote choice in national parliamentary elections. We use a self-administered online Panel Survey (see Selects 2022) that was part of Selects 2019. The Panel Survey investigates the dynamics of opinion formation and vote intention during the election year and annually between two successive national elections. Six waves have been conducted so far, three in 2019 (one before the 2019 election campaign, one during the election campaign and one after the federal elections), and three subsequent yearly waves in 2020, 2021 and 2022.
The initial sample was drawn by the Swiss Federal Statistical Office at random from the Swiss population register and comprised 25,575 Swiss citizens aged 18 and above. Sample members received a pre-notification letter one week before the beginning of the online survey together with an unconditional incentive of CHF 10 in the form of a postal check. In addition, respondents who participated in the waves 1, 2 and 3 were told that they could win one of five iPads. 7,939 valid interviews (>50% completed) were conducted in wave 1. All respondents from wave 1 were invited to take part in wave 2 (5,577 valid interviews; AAPOR2 response rate=68.4%) and in wave 3 (5,125 valid interviews; AAPOR2 response rate=64.9%). At the end of wave 3, 3,030 respondents gave consent to participate in yearly follow-up surveys until the next national elections (in 2023). Consenters were informed that they would receive CHF 10 (cash) upon completion of wave 4 of the online survey. In total, 2,499 valid interviews were conducted in wave 4 (out of 2,955 contacted persons; AAPOR2 response rate=84.6%).
Consenters from wave 3 were again contacted in wave 5 of the study (2,878 contacted persons, excluding respondents no longer in the population (e.g., deceased) or who asked to be withdrawn from the sample. Those with a low political interest in wave 1 (not at all or rather not interested, N=536, versus rather or very interested, N=2,342) and those who systematically responded only after the second reminder were deemed low probability respondents (N=592). This group was offered a CHF 20 incentive and excluded from the experiment. The remaining sample (2,286 sample members) was randomized into two equally sized subsamples. The first subsample was informed that they would receive CHF 10 (cash) upon completion of the questionnaire. The second subsample was informed that they would participate in a cash lottery upon completion of the questionnaire (5×300 CHF). Note that a proper “control” group receiving no treatment is not included in the experiment. To calculate valid responses, speeders (N=2), respondents reporting a sex or a birthyear inconsistent with information from the sampling frame (N=41), and drop-offs (N=20) counted as non-respondents.
Using a logistic regression, we checked the randomization into the two experimental groups by regressing the two incentives on the variables political interest, having voted in national elections, education level and whether the questionnaire of wave 3 was interesting to answer. We imputed 4 missing values for political interest, 18 for voted, 2 for education level and 17 for interest in the wave 3 questionnaire using chained equations. Previous research shows that these variables, which are good proxies for social inclusion and participation, are generally negatively correlated with attrition (e.g., Voorpostel 2010). This is important for the test of selection effects in the next chapter. We also include gender, language region (Swiss-German, French, Italian), and age group (18-30, 31-43, 44-56, 57-69, 70+) in the regression model. The model turned out to be insignificant (Prob > chi2 = 0.719), suggesting that the variables are not jointly different in the two experimental designs.
Results
While the response rate of the full sample (N=2,878) amounts to 80.7%, this is 78.0% in the CHF 20 group (N=592), 82.9% in the CHF 10 group (N=1,143), and 80.0% in the lottery incentive group (N=1,143). Based on two-sided t-tests, the response rates are different on the 5% significance level between the CHF 20 group and the CHF 10 group (Pr(|T| > |t|) = 0.015; df=1733), on the 10% level between the CHF 10 group and the lottery group (Pr(|T| > |t|) = 0.076; df=2284), and on the 35% level between the CHF 20 group and the lottery group (Pr(|T| > |t|) = 0.348; df=1733). This means that there is no significant effect between the two experimental groups (CHF 10 and lottery) on a conventional significance level.
To test respondent selection effects of the incentives in the two experimental groups, we regress completion in the two experimental groups on the variables used for the randomization check above. Using a logit model, these variables do not jointly interact with the experimental group on the 10% significance level (Prob > chi2 = 0.271). We conclude that the respondent sample composition is the same in the two experimental groups. Only two variables interact significantly with incentive: gender (2% level) and age groups from 44 years on (5% level; baselevel 18-30 years old). We illustrate the interaction of these variables with incentive using marginal effects in Figure 1:
Figure 1: Predictive Marginal Effects of completion by gender and age group interacted with incentive.
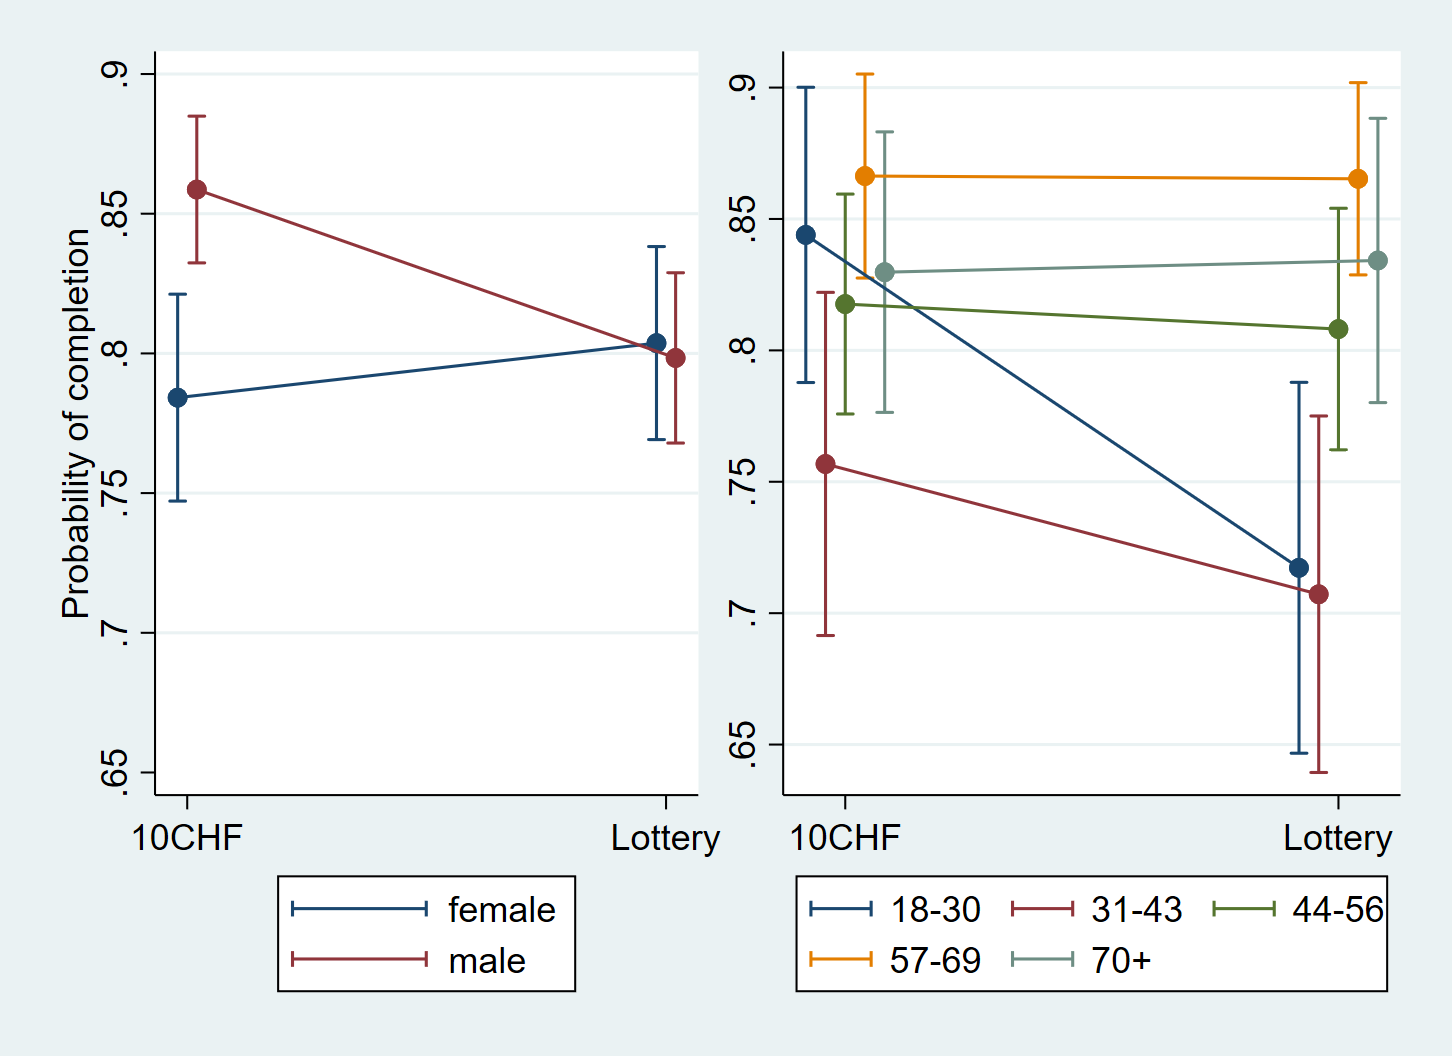
Note: Data: Wave 5 (Selects 2019 Panel Survey), N=2,286 sample members in the two experimental groups.
Men (red) are more responsive to conditional cash than women (blue) and younger people (blue: 18-30 years old; red: 31-43 years old) are more sensitive to incentives, with conditional cash having positive effects on participation.
While neither response rates nor respondent sample composition differ much between the two experimental groups, incentive costs do, however: the per respondent incentive costs excluding administrative costs (letters, etc.) amount to CHF 10 in the first group and to CHF 1.6 in the lottery group, making the latter incentive design much cheaper.
Discussion
Comparing a conditional CHF 10 cash incentive with a lottery of 5×300 CHF in wave 5 of a probability-based online panel survey among Swiss adult citizens, we find that neither response rates (82.9% vs. 80.0%) nor sample composition are statistically significantly different from each other. Interestingly, the only variables for which different categories have different response rates according to the incentives used are age and gender. These socio-demographic variables are typically not prone to cause large differences in nonresponse, see Lipps and Pekari (2021), who find little effects in the 2015 edition of the Selects survey except for older people who are underrepresented in the web only design. Social inclusion and participation related variables, however, do not interact with the incentives. While it may be an idea to use conditional cash for men or younger sample members and a lottery for women or older sample members, overall, the sample composition does not differ much across the two experimental groups.
The largest difference between the two incentives are costs: in our setup, conditional cash incentives cost about six times as much as the lottery. This suggests that – at least in a mature panel – it is possible to reduce incentive costs drastically without too much damaging the size and composition of the sample. Sample members invited (participants of wave 3) are rather driven by interest in the survey: while only 71% of the wave 3 respondents, who strongly or rather disagree with the statement that the questionnaire was interesting (N=112), participate in wave 5, this percentage increases to 79% for those who neither agree nor disagree (N=332), to 80% for those who rather agree (N=1594), and to 84% for those who strongly agree (N=823). This of course reflects an increasing selection of sample members to those who are interested in the survey.
One limitation of this study is that we had to exclude low propensity respondents. These people – selected by means of their little political interest and late participation in previous waves – have different properties and were not part of the incentive experiment because not offering them an especially high incentive (CHF 20) would have been too high a risk of losing them. Since this led to a further (positive) sample selection in addition to already restricting the sample to the mature respondents of wave 3, the resulting sample was probably less sensitive to different incentives. Our results are therefore likely to be conservative. Nevertheless, we think that we took a pragmatic choice which didn’t involve too high risks to lose low probability respondents. To sum up, in a mature panel of adult citizens, it is possible to save costs on expensive incentives without sacrificing response rates and sample composition too much.
References
- Becker, R. & Glauser, D. (2018). Are prepaid monetary incentives sufficient for reducing panel attrition and optimizing the response rate? An experiment in the context of a multi-wave panel with a sequential mixed-mode design. Bulletin of Sociological Methodology, 139(1), 74-95.
- Becker, R., Moser, S. & Glauser, D. (2019). Cash vs. vouchers vs. gifts in web surveys of a mature panel study––Main effects in a long-term incentives experiment across three panel waves. Social Science Research, 81, 221-234.
- Gajic, A., Cameron, D. & Hurley, J. (2012). The cost-effectiveness of cash versus lottery incentives for a web-based, stated-preference community survey. The European Journal of Health Economics, 13(6), 789-799.
- Jäckle, A. & Lynn, P. J. (2008). Respondent incentives in a multi-mode panel survey: cumulative effects on nonresponse and bias. Survey Methodology, 34(1), 105-117.
- Laurie, H. & Lynn, P. J. (2009). The use of respondent incentives on longitudinal surveys. In
P. J. Lynn (Ed.), Methodology of longitudinal surveys (pp. 205-233). Chichester, West
Sussex: Wiley. - Lepkowski, J. M. & Couper, M. P. (2002). Nonresponse in the second wave of longitudinal household surveys. In R. M. Groves, D. A. Dillman, J. L. Eltinge, & R. J. A. Little (Eds.), Survey nonresponse (pp. 259–272). New York: John Wiley & Sons.
- Lipps, O. (2007). Attrition in the Swiss household panel. methods, data, analyses, 1(1), 45-68.
- Lipps, O., Herzing, J. M. E., Pekari, N., Ernst Stähli, M. Pollien, A., Riedo, G., Reveilhac, M. (2019). Incentives in surveys. FORS Guide No. 08, Version 1.0. Lausanne: Swiss Centre of Expertise in the Social Sciences FORS.
- Lipps, O. & Pekari, N. (2021). Sequentially mixing modes in an election survey. Survey Methods: Insights from the Field. DOI:10.13094/SMIF-2021-00003.
- Lynn, P. J. (2009). Methods for Longitudinal Surveys. In P. J. Lynn (Ed.), Methodology of longitudinal surveys (pp. 1-19). Chichester, West Sussex: Wiley.
- McGonagle, K. A. (2020). The Effects of an Incentive Boost on Response Rates, Fieldwork Effort, and Costs across Two Waves of a Panel Study. methods, data, analyses, 14(2), 241-250.
- Olson, K., Wagner, J., Anderson, R. (2021). Survey costs: Where are we and what is the way forward? Journal of Survey Statistics and Methodology, 9(5), 921-942.
- Pekari, N. (2017). Effects of contact letters and incentives in offline recruitment to a short-
term probability-based online panel survey. Presented at the European Survey Research
Association (ESRA) Conference, Lisbon. - Pforr, K. et al. (2015). Are incentives effects on response rates and nonresponse bias in large-scale, face-to-face surveys generalizable to Germany? Evidence from ten experiments. Public Opinion Quarterly, 79(3), 740-768.
- Pforr, K. (2016). Incentives. GESIS Survey Guidelines. GESIS – Leibniz-Institut für Sozialwissenschaften. doi:10.15465/gesis-sg_001.
- Sacchi, S., von Rotz, C., Müller, B., & Jann, B. (2018). Prepaid incentives and survey quality in youth surveys. Experimental evidence from the TREE panel. Presentation at the III. Midterm Conference of the ESA RN 21 Cracow, October 3–6, 2018.
- Selects (2022). Panel Survey (waves 1-5) – 2019-2021 [Dataset]. Distributed by FORS, Lausanne. www.selects.ch DOI: https://doi.org/10.48573/g1em-fa05
- Uhrig, S. N. (2008, February). The nature and causes of attrition in the British Household Panel Survey. ISER Working Paper Series, 05-08, Colchester, Essex.
- Voorpostel, M. (2010). Attrition patterns in the Swiss household panel by demographic characteristics and social involvement. Swiss Journal of Sociology, 36(2), 359-377.
- Warriner, K., Goyder, J., Gjertsen, H., Hohner, P. & McSpurren, K. (1996). Charities, no; Lotterie, no; Cash, yes: Main effects and interactions in a Canadian incentives experiment. Public Opinion Quarterly, 60(4), 542-562.
- Watson, D. (2003). Sample attrition between waves 1 and 5 in the European Community Household Panel. European Sociological Review, 19(4), 361-378.
- Witte, N., Schaurer, I., Schröder, J., Décieux, J. P. & Ette, A. (2021). Enhancing Participation in Probability-Based Online Panels: Two Incentive Experiments and Their Effects on Response and Panel Recruitment. Social Science Computer Review, 08944393211054939.
- Wong, E. (2020) Incentives in longitudinal studies, CLS Working Paper 2020/1. London: UCL Centre for Longitudinal Studies.
-
Keywords
calibration CATI coverage coverage bias cross-national surveys data linkage data quality European Social Survey experiment face-to-face face-to-face survey Facebook hard to reach populations incentives item nonresponse measurement measurement error mixed-mode surveys multitasking non-probability samples Nonresponse nonresponse bias nonresponse rates paradata PIAAC Probability sample probability samples QR codes rare populations response rate Satisficing social desirability Social media survey survey-taking climate survey data survey management survey methods Telephone survey telephone surveys total survey error unit nonresponse validity web survey Web surveys weighting
