

Exploring Optical Character Recognition (OCR) as a Method of Capturing Data from Food-Purchase Receipts
Kaderabek, A. (2023), Exploring Optical Character Recognition (OCR) as a Method of Capturing Data from Food-Purchase Receipts. Survey Methods: Insights from the Field, Special issue: ‘Food Acquisition Research and Methods’. Retrieved from https://surveyinsights.org/?p=17190
© the authors 2023. This work is licensed under a Creative Commons Attribution 4.0 International License (CC BY 4.0) 
Abstract
This paper explores capturing expenditure data from food-purchase receipts using optical character recognition (OCR). Point-of-sale receipts provide means to assess the accuracy of self-reported expenditures by providing a comprehensive record of the number of items purchased and their prices. However, comprehensively coding receipts can be cost prohibitive, particularly for large-scale surveys. The burden of capturing receipt data then becomes the largest impediment to survey researchers who are looking to reduce respondent burden and take full advantage of point-of-sale receipts as an external record of expenditures. This work examines the efficacy of employing open-source OCR software to interpret food-purchase receipts and subsequently store the data in a useful analytical format. Receipts were collected as part of the Alternative Data Collection Methods (ADCM) study that was conducted in 2017 in preparation for the USDA’s second National Household Food Acquisition and Purchase Survey (FoodAPS-2). A sample of the submitted receipts were manually reviewed and revealed the most frequented establishments (e.g., grocery stores, convenience stores or restaurants), which establishments had similar receipt formatting, and to what extent other receipt properties vary across the sample. Additionally, the manual review identified measurement error resulting from underreporting of expenditures by respondents. To better understand the extent and impact of underreporting, we employed Tesseract OCR, ImageMagick, and R to automate the interpretation, cleaning, and storage of receipt data. We compare the accuracy of data captured through OCR to a manual coding of food-purchase receipts, and the respondent-reported expenditure data corresponding to those purchases. We discuss the factors that facilitate and limit efficient and accurate receipt capture.
Keywords
expenditure data, measurement error, optical character recognition, receipt data, under-reporting
Acknowledgement
This work was originally conducted as part of a cooperative agreement between the U.S. Department of Agriculture - Economic Research Service and the University of Michigan’s Program in Survey and Data Science. I would like to thank Elina T. Page and Jeffrey M. Gonzalez from the U.S. Department of Agriculture Economic Research Service for providing me the opportunity to work with the FoodAPS ADCM data. I would also like to thank professors Brady T. West and Yajuan Si for the invaluable lessons and support they provided me while pursuing my degree in the Program for Survey and Data Science and in the development of this manuscript.
Copyright
© the authors 2023. This work is licensed under a Creative Commons Attribution 4.0 International License (CC BY 4.0)
Introduction
This paper explores using optical character recognition (OCR) to capture expenditure data from food-purchase receipts. We employ the open-source Tesseract OCR engine and a custom-tailored algorithm to capture text data from images of food-purchase receipts and then parse and store the data for further analysis. We compare the accuracy of data captured through this OCR algorithm to a manually coded review of food-purchase receipts, as well as respondent-reported expenditures corresponding to those purchases. A process that makes receipts machine readable could provide immense cost savings by reducing the level of effort needed to access and analyze the data.
As a record of food expenditure, receipts are a particularly robust source of information. They provide itemized expenses in a recognizable format that includes a description of the purchased good or service, the quantity procured, and the corresponding cost. Receipts also typically identify the retailer, the time and date of purchase, the subtotal, taxes, and the total cost for the expenditure. However, collecting data from receipts can be difficult. First, there is the challenge of gaining cooperation and collecting receipts from respondents which often leads to a reliance on small, nonrepresentative samples (e.g., Rankin et al. 1998, Ransley et al. 2001, French et al. 2009). Once receipts have been collected, they must be reviewed, annotated, and coded into a data set (Jäckle et al. 2021). Due to this high level of effort very few general population surveys have included the collection and analysis of receipt data.
Of the few general population surveys that have collected receipts from respondents, the most recent is the Understanding Society Spending Study 1 which included the collection of expenditures and receipts through a mobile survey application (University of Essex, Institute for Social and Economic Research 2021). 2,112 members of the Understanding Society Innovation Panel were invited to participate in the study and of those who consented and downloaded the app, 270 participants used the app at least once for a total of 11,507 reported expenditures over a 31-day period (Jäckle et al. 2019). Analysis of the data indicated that nearly half of the app uses were receipt submissions (Read 2019), and the number of times that participants scan receipts or report purchases was relatively consistent over the 31-day period (Jäckle et al. 2019).
In the United States two federal surveys have captured and analyzed receipts. The first survey is a small pilot study conducted as part of the Consumer Expenditure (CE) Quarterly Interview Survey Records Study. Researchers recruited 115 households to be interviewed twice in a seven-day period. Participants were asked to keep receipts and other personal records of expenditures like credit card statements. Interviewers found that records were available for 36% of the 3,039 expenditures reported in the initial interview and those records were enough to provide evidence of measurement error from both over- and under-reporting (Geisen et al. 2011). Subsequently, a protocol for receipt collection was included in the suggestions for redesigning the CE (Westat 2011, National Research Council 2013).
The second survey is the National Household Food Acquisition and Purchase Survey (FoodAPS-1) sponsored by the U.S. Department of Agriculture (U.S. Department of Agriculture, 2012). FoodAPS-1 was a nationally representative survey that captured all food acquired, whether purchased or obtained for free, by all household members older than 12 years of age. Participants were asked to keep all food-purchase receipts for the 7-day data collection period and use them as a reference when reporting details of the expenditure. Similar to the Understanding Society Spending Study 1, FoodAPS-1 recognized a cooperative pattern of behavior among active respondents. FoodAPS-1 respondents provided receipts for 80% of 15,998 “food at home” (FAH) events (Kirlin and Denbaly 2017) and 57% of 23,472 “food away from home” (FAFH) events for which the respondent paid for food. Similar to the CE, early findings from the FoodAPS-1 receipts motivated suggestions to continue the use of receipt data in future iterations of data collection (Cole and Baxter 2016, Yan and Maitland 2016, Kirlin and Denbaly 2017, Page et al. 2019).
Alternative Data Collection Methods Study
In preparation for FoodAPS-2, the Alternative Data Collection Methods (ADCM) study was conducted in 2017. The ADCM tested an online diary format called the “FoodLogger” to reduce reporting burden and improve data quality. Respondents were able to access the FoodLogger on a computer, tablet, or mobile phone. The FoodLogger platform included product identification assistance using Universal Product Codes (UPCs), Google Maps integration for looking up event locations, and the ability to upload images of receipts. Receipts were submitted as digital images including JPEG, PNG, and PDF formats. No specific guidance on photographing or scanning was given to respondents during their initial interview. All receipts used for this examination of OCR come from the receipts collected during the ADCM.
The ADCM sample was drawn from an address-based sampling frame of 12 primary sampling units (PSUs) across nine states that were sampled for FoodAPS-1. The ADCM aimed at collecting representative data from a target of 500 households, including 150 households participating in the Supplemental Nutrition Assistance Program (SNAP). In total, 430 households reported 4,906 food acquisition events with 1,598 reports “having a receipt to upload” as indicated by the respondent, which we will refer to as “receipt-indicated” reports. There were two categories of food acquisition events that respondents could report: a) “food away from home” (FAFH) which includes meals, snacks or drinks consumed outside the home, or b) “food at home” (FAH) which includes any food or drink items brough into the home for consumption.
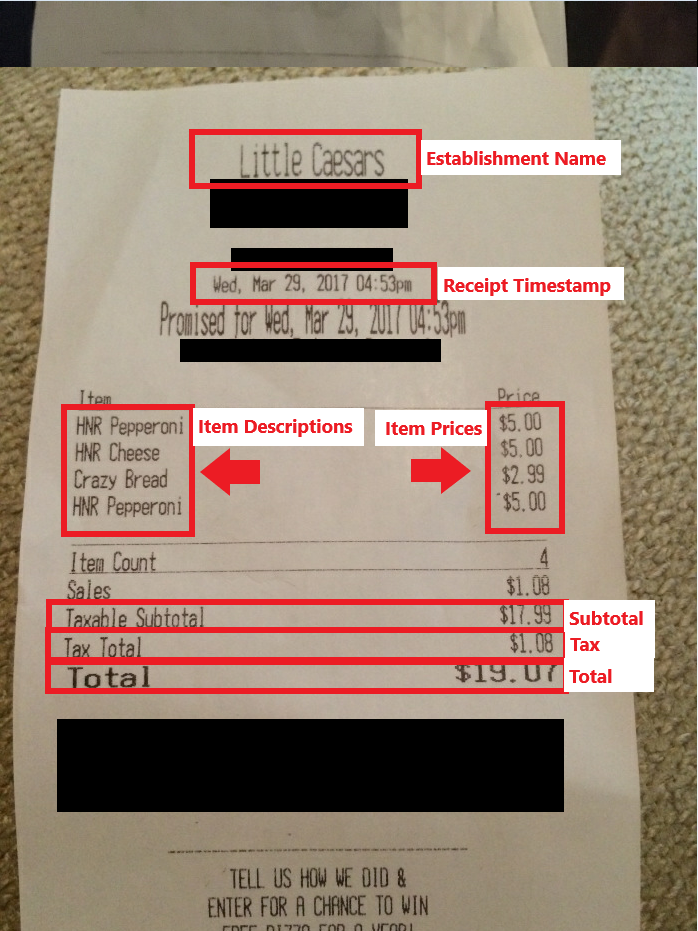
Figure 1 provides annotated examples of two FAFH receipts. In addition to item descriptions, item prices, taxes, and the total cost, there are several other elements that illustrate types of formatting conventions that can be found across establishments. For example, the receipt from Little Caesars, a fast-food pizza chain, lists items individually along the left side of the receipt with corresponding prices aligned to the right. We can infer from the line labeled “item count” that each description represents a singular item, resulting in a total of four items. In comparison, the receipt from Subway, the international sandwich chain, also lists the item description to the left of the item price but it also includes an indication of quantity preceding the item. We also see that the receipt from Subway includes the type of payment used (i.e., cash) and the resulting change from the transaction whereas the receipt from Little Caesars provides no additional information on the type of payment.
| Figure 1: Example Food Away from Home (FAFH) Receipts | |
 |
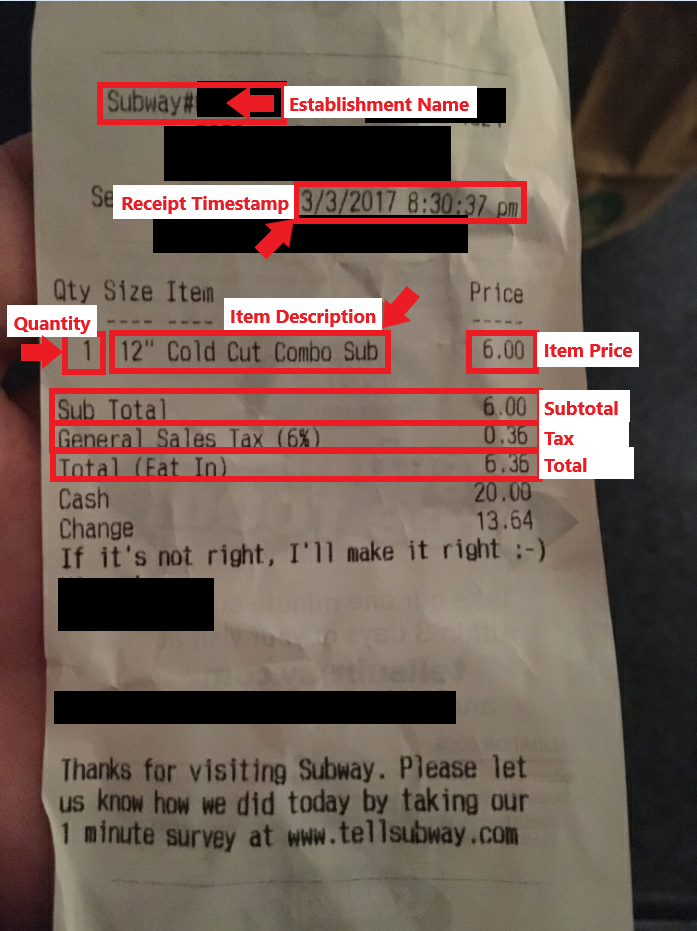 |
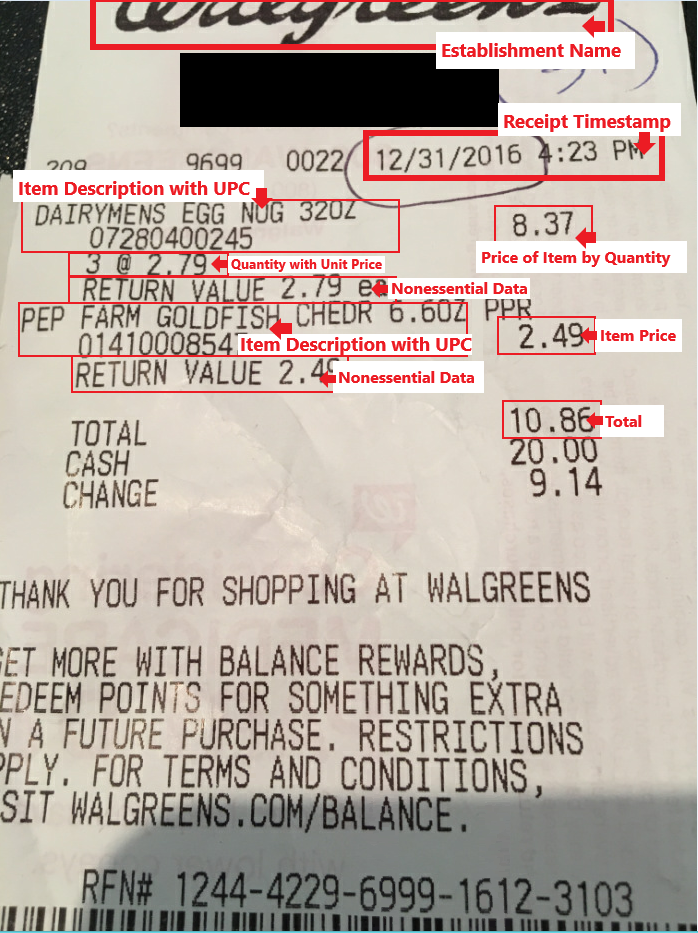
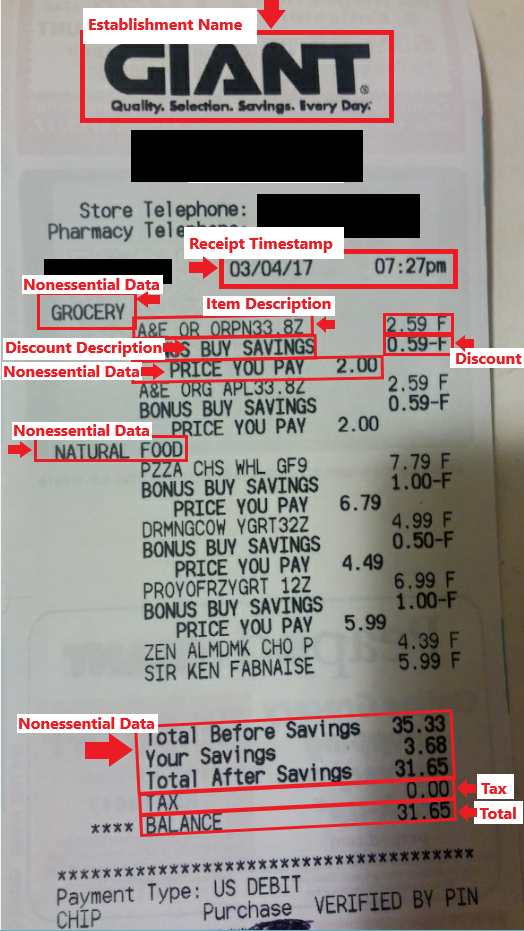
Figure 2 provides annotated examples of two FAH receipts. Both contain several additional elements that are not present in the FAFH receipt examples. For example, the multi-line-item descriptions on the receipt from Walgreens, a nationwide drug store chain, include product UPCs and quantity information and the receipt from Giant, a regional grocery store, includes item-level discounts. There are also elements that are not of particular interest for this examination of OCR, which we will refer to as “nonessential data”. The receipt from Walgreens, for example, lists the return value for each item and the receipt from Giant includes headers for different items, such as “GROCERY” and “NATURAL FOOD”.
| Figure 2: Example Food at Home (FAH) Receipts | |
 |
 |
Methods
Sampling Receipts
As part of a data quality review, a random sample of 100 FAFH and 100 FAH events was selected from the 1,598 receipt-indicated reports to evaluate against the reported expenditure data (Kaderabek et al. 2021). During the validation process it became evident that the number of receipts indicated by respondents was not accurate due to several factors: reporting error, non-itemized receipts, images of receipts from stores that did not correspond to the reported establishment, images that were not receipts, corrupted files, and receipt images that were illegible.
Figure 3 provides a breakdown of ADCM receipt-indicated events compared to the actual number of receipts that were available for data validation. It was found that only 1,426 (89%) of the 1,598 receipt-indicated events corresponded to an available image file and only 1,274 (80%) of the receipt-indicated events corresponded to an itemized and legible receipt. Although the same issues contributed to the reduction of available FAFH and FAH receipts, Figure 3 also shows there was a more profound reduction in the number of FAFH receipts.
| Figure 3: Receipt Availability for Food Away from Home (FAFH) and Food at Home (FAH) Events |
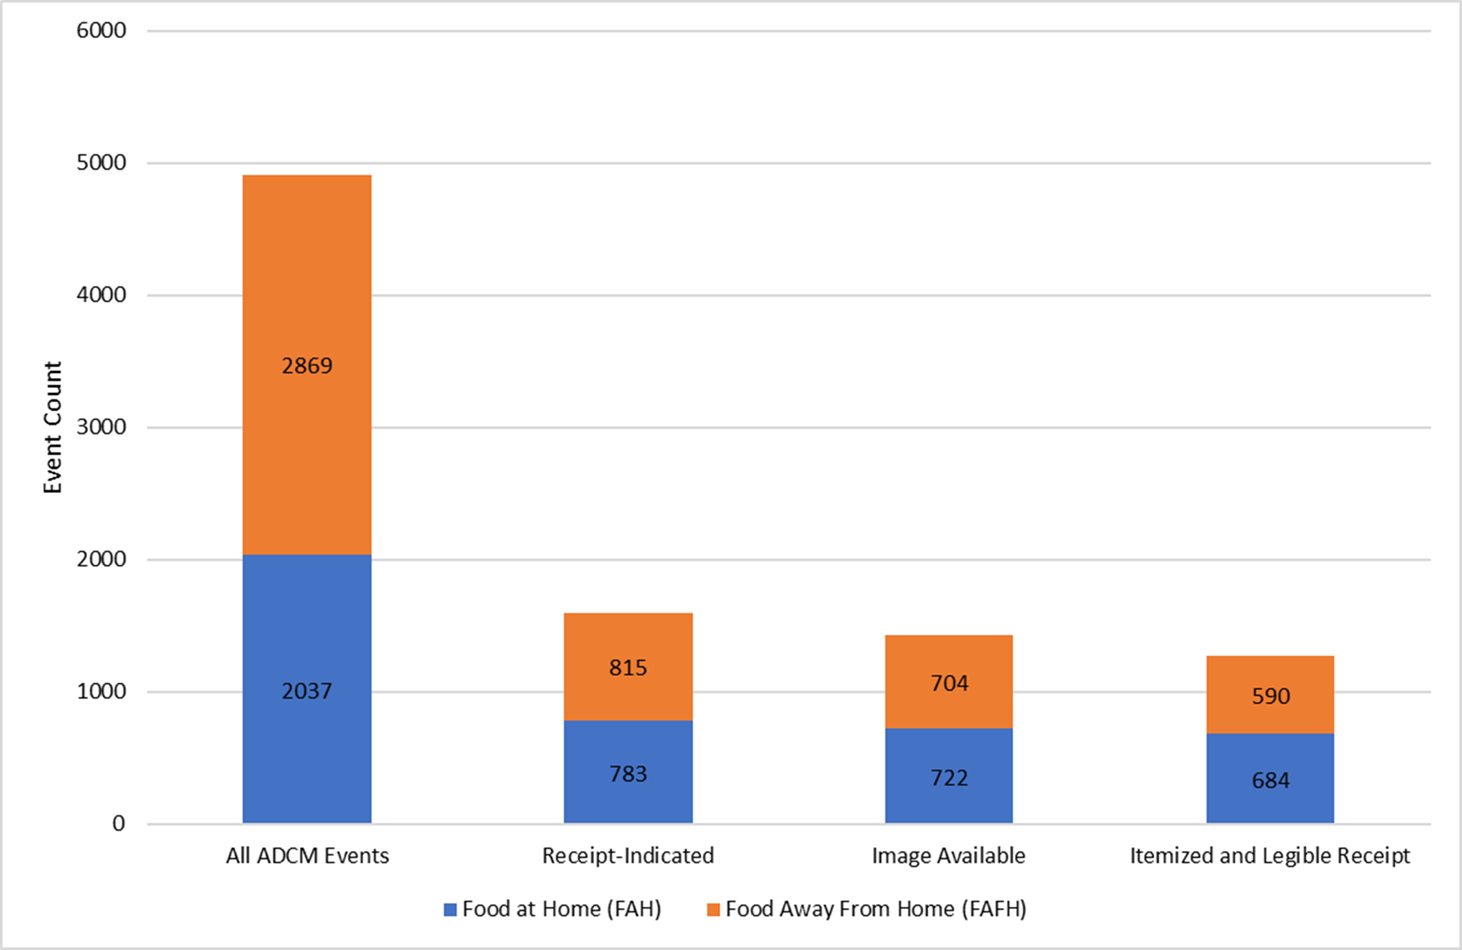 |
Of the 100 sampled FAFH events, 18 images were missing (i.e., they were either never uploaded by the respondent or they were not included in the archive of images after data collection), 5 images were not of receipts, 8 receipts were not itemized (i.e., they only indicated a confirmation of payment). This resulted in 69 FAFH receipts that could be compared to the reported data. Of the 100 sampled FAH events, 9 receipt images were missing, 2 receipts were illegible, and 1 receipt was not itemized (and appeared to be from a misreported FAFH event), leaving 88 FAH receipts for comparison. We manually coded the total cost, number of items, and item prices from the receipt data for all sampled receipts. Because there were no standards for how respondents should capture the receipt image, the legibility of each sampled receipt was also coded as “completely legible” or “partly legible” to evaluate the quality of the submitted images.
OCR Test Cases
The 69 FAFH and 88 FAH events from the validation study represent the initially available OCR test cases. However, because any limitation to manual interpretation of receipt data will also limit automated interpretation, we used the receipt legibility scores to exclude blurry images and receipts with stains or other peripheral markings that impeded legibility. Restricting our test cases to completely legible receipts reduced the available FAFH images to 61 and the available FAH images to 82. In order to bolster the number of FAFH test cases, we included 7 of the 8 non-itemized receipts from the FAFH sample to test the possibility of capturing the receipt total when no other information was available, yielding a total of 68 FAFH test cases (the eighth non-itemized receipt only contained a payment confirmation without any cost information). This was not possible for FAH receipts because grocery stores and similar FAH establishments in our sample all provided itemized receipts.
Pre-processing with ImageMagick
Before the OCR process can be applied, we use ImageMagick (ImageMagick Development Team 2021) for image pre-processing. OCR accuracy with Tesseract is dependent on several image properties (Google 2021). Of critical importance are resolution, clarity, and skew. Resolution, measured in pixels, is defined by the image capture device (e.g., camera or scanner). Clarity is a less objective metric that is dependent on image contrast and focus. Image skew refers to the 2D and 3D alignment of elements in the image. This includes both vertical and horizontal alignment as well as distortions of perspective like keystoning (i.e., converging vertical elements due to the top of an image appearing further away from the camera than the bottom). ImageMagick facilitates cropping images, binarizing (i.e., converting all pixels to black or white), adjusting resolution, and de-skewing images. Each ImageMagick function includes parameters for adjusting preprocessing performance and output however, due to time constraints, only default parameters were tested during this investigation.
OCR with Tesseract
Following the image pre-processing, each file was processed using the Tesseract OCR engine (Google 2021). Tesseract identifies pixels in relation to each other and associates the identified shapes with known characters. The resulting interpretation is then converted into a string of text characters with the individually recognized lines of text separated by the new line escape character “\n”. The next step it to parse the data from strings of text and store it in a way that makes statistical analysis possible.
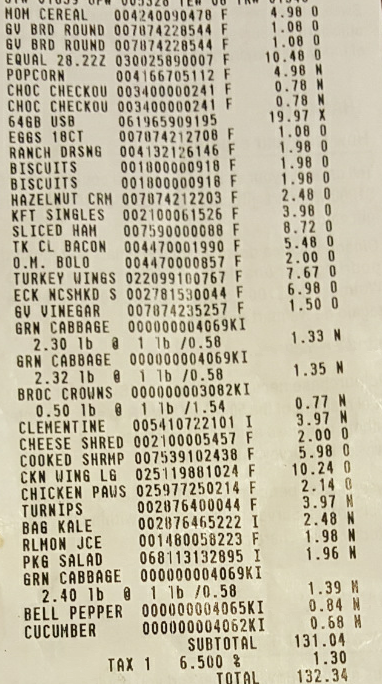
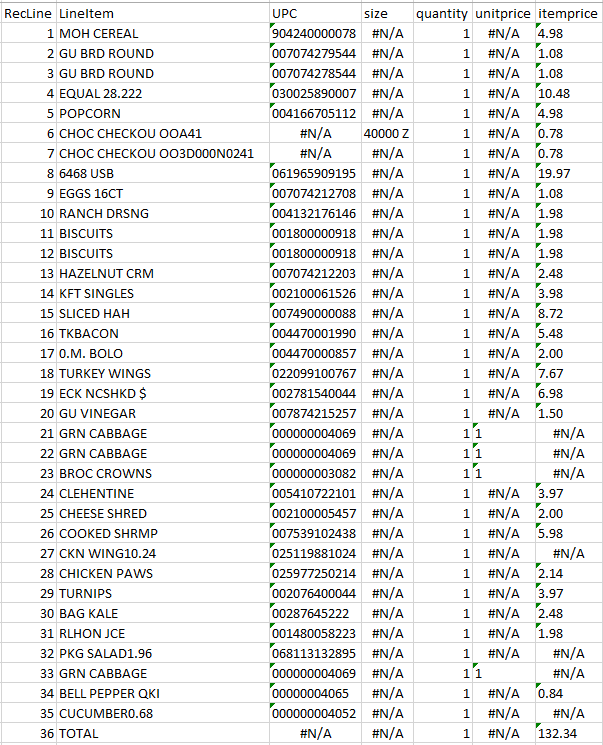
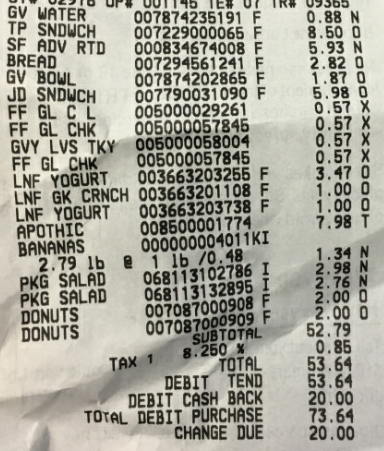
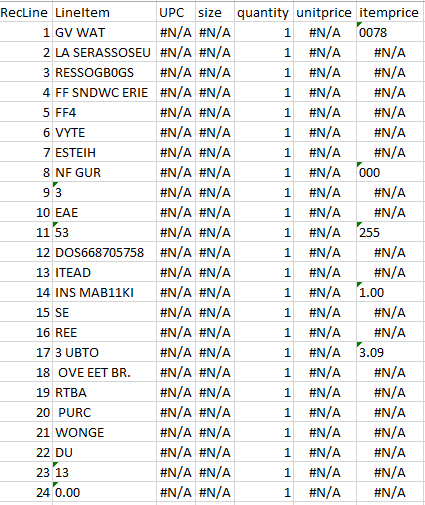
Figure 4 provides examples of OCR results from each end of the quality spectrum. The upper pair of images represent a near perfect OCR capture of a receipt containing 35 items. OCR accurately captured the receipt total, all item descriptions, and all but five item prices. In contrast, the bottom pair of images represent a receipt that was legible to the human eye but was unrecognizable to the OCR.
| Figure 4: Successful and Unsuccessful OCR Capture | |
 |
 |
 |
 |
Using Regular Expressions (REGEX) to Parse Text
As illustrated above, receipts are often not standardized across establishments. However, there are a number of properties that make receipt data highly recognizable. For example, in the United States, receipts read left to right with the item description appearing first, possibly followed by an indication of quantity or size, and the item-specific price displayed to the right of the description. Prices are aligned and summed to provide the subtotal, tax, and total cost below the listing of item prices. Dollar signs are commonly, but not always, associated with prices. Within the ADCM receipts, prices were universally listed as a numeric value including two decimal places. As seen in the FAH receipt examples (Figure 2), there may also be other elements present such as Universal Product Codes (UPCs), or loyalty-member discounts.
Recognizing these patterns enables humans to employ heuristics, or cognitive short-cuts that enhance recognition and interpretation of the information contained in a receipt. In turn, it is possible to employ an algorithm that uses similar logical inference to parse the raw text data that results from using OCR. We use regular expressions (or “regex”) and Boolean logic to create an algorithm that is capable of identifying pertinent elements of the receipt as well as removing text which is not informative. Regex are special sequences used to find or match patterns in strings of text data. These sequences use metacharacters and other syntax to represent sets, ranges, or specific characters. For example, the expression “[0-9]” matches the range of numbers between 0 and 9. Regex are far more flexible than searching for explicitly defined character strings, which makes them incredibly useful for searching and manipulating text strings.
It should be noted, however, that there are limitations to using a strictly logic-based approach to parsing the data. Rules will only be enforced if the explicit regex are recognized. For example, if we instruct the algorithm to look for the word “TOTAL” but the OCR errantly perceives “T0TAL” then the corresponding rule will not be triggered. There are ways to mitigate these simple issues, such as building a dictionary that includes likely alternatives or modifying the regex to be more flexible but these solutions can have limitations as well. Future work in novel text extraction could benefit from incorporating predictive machine learning techniques to mitigate character misinterpretations, particularly if there is significant variation in the quality of the images undergoing OCR. Due to time constraints, our algorithm was constrained to a “what you see is what you get” OCR output.
Defining and Targeting Receipt Data to Capture
During the preliminary review of the OCR test receipts, a list of common and consistent elements was created to guide the development of the text parsing algorithm. The algorithm was also programmed to include indicator variables when identifying certain receipt elements, including item counts, price discounts, the subtotal, tax, and total. Indicator variables were constructed as binary variables that indicated if the element-specific regex pattern is present and has a corresponding value. In order for a given indicator to be coded as 1, both the regex pattern and a numeric value needed to be identified and captured. An indicator would be coded as 0 for either not recognizing the specified regular expressions, or by recognizing the expression but failing to identify an associated dollar value. We focus on capturing the following eight elements from the receipt image:
- Item descriptions – specifically a string of characters constrained to a single line of text indicating a food item. We exclude lines containing nonessential information like department headers or lines indicating the quantity of an item.
- Item prices – as present for each individual item description on FAH receipts. Respondents were asked to report individual items included in FAFH combo meals and report the price with only the initial/parent item.
- Item discounts – in the FAFH test cases discounts were rare to the extent that a short custom dictionary was constructed to identify discounts by the terms “EMP DISC”, “MANAGER MEAL”, and “DISCOUNT”. Discounts among FAH test cases were far more prevalent and universally indicated by a hyphen immediately before or after the price, as seen in the “BONUS BUY SAVINGS” lines of the receipt from Giant in Figure 2.
- Item count (FAH receipts only) – by default a line-item translates to a quantity of one, even if multiples of the same product are purchased in succession. As an element of the receipt, we define quantities specifically as any line containing an asperand (i.e., “@”) to be a line indicating a weight or other quantity, for example “3 @ $2.79” or “1.56 @ 3.99 / LB”. We then parse the amount purchased and the per-unit price and associate them with the item description immediately preceding the quantity line to calculate the total item count.
- Line count (FAFH receipts only) – in contrast to the use of the asperand, FAFH receipts tend to list the quantity of each product purchased before the item description as seen in the receipt from Subway (Figure 1). This pattern, coupled with the frequent presence of numbers at the beginning of item descriptions and the common inclusion of order instructions, made it impossible for the algorithm to capture item and quantity information in any way comparable to both the manually coded receipt data and the reported data for FAFH events. Figure 5 illustrates these formatting issues. Line 1 indicates the purchase of a “buy one, get one” deal and the two items included are listed subsequently in lines 2 and 3. Line 4 indicates a quantity of 1 for “2 Burritos” and line 7 similarly indicates a single order of “2 Hash Browns”. Additionally, both lines 6 and 9 are instructions related to different items and not unique food items themselves. We were unable to modify the algorithm to accommodate this level of nuance in the time available for testing. However, it was still important to make some assessment of the OCR’s performance in accurately capturing text from the receipt. As a solution, we manually counted the items listed on the FAFH receipts by line as illustrated in Figure 5 with no differentiation of quantities or content. We compare this “line count” with the number of lines captured by OCR as a performance metric. Since respondents were asked to report the number of food items we are unable to compare the respondent reported data to the OCR captured line count.
Figure 5: Example of Line Count for FAFH Receipts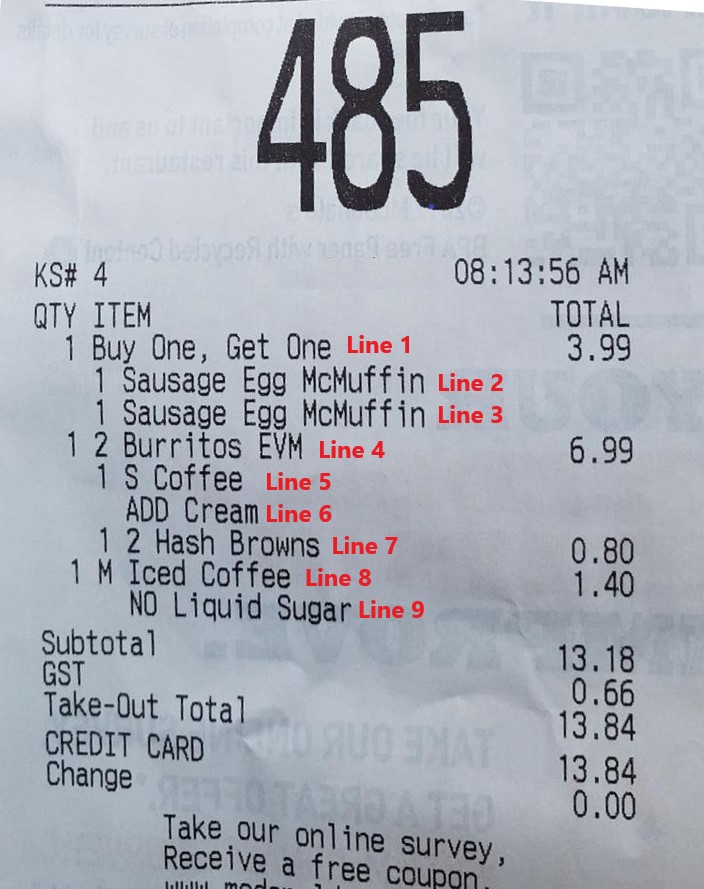
- Subtotal (FAFH only) – as indicated by the presence of “SUBTOTAL” or “SUB TOTAL” on FAFH receipts. The subtotal indicator was the least complex in that it simply targeted the appearance of “SUBTOTAL” or “SUB TOTAL” and an associated value. Because respondents were not asked to report subtotal or tax for FAH events, we did not attempt to capture these data from the FAH receipts using OCR.
- Tax (FAFH only) – only FAFH receipts included tax in addition to the receipt total. The tax indicator targeted patterns that were highly likely to be representations of “TAX”, such as “TAK” or “AX”. As noted above, because respondents were not asked to report tax separate from the receipt total for FAH events, we did not attempt to capture tax from the FAH receipts using OCR.
- Total – the balance due for all purchased items plus tax. The total indicator used regex patterns to identify strings that included commonly used terms like “TOTAL”, “BALANCE”, and “AMOUNT DUE”.
Analysis
For our analysis we refer to the manually coded receipt data as the “true” values for each event. To assess the accuracy of OCR as a method of capturing text data, we compare the OCR output to the manually coded receipt data. Specifically, we look at the FAFH values of subtotal, tax, absolute total, and line count (as defined above) along with the FAH values of total and item count. Because respondents were not asked to report the subtotal and tax separately for FAH events the subtotal and tax were not captured as part of the manually coded review or OCR capture of the FAH receipts.
Where the OCR output differs from the manually coded data, we compare whether OCR or the respondent reported data are closer to the true values. We also compare the correlation between the OCR and manually coded data to the correlation between manually coded data and the respondent reported data. If the OCR produces price and item information that is highly correlated to the manually coded information, then there will be support for OCR’s ability to accurately capture the expenditure information.
Results
Table 1 provides a comparison of summary statistics for the manually coded receipt data, the OCR results, and the respondent-reported data. For FAFH events, we present the mean receipt line count, tax, subtotal, and total. For FAH events, we show the mean receipt item count and total. Because of the inclusion of non-itemized receipts and two receipts with missing totals (one FAFH and one FAH receipt), we indicate the number of test cases available for each comparison in the fourth column. For both the OCR results and the self-reported data, we then present the number of cases that accurately matched the manually coded receipt data.
Table 1: Summary of Manually Coded Receipt Data, OCR Results, and Self-Reported Data
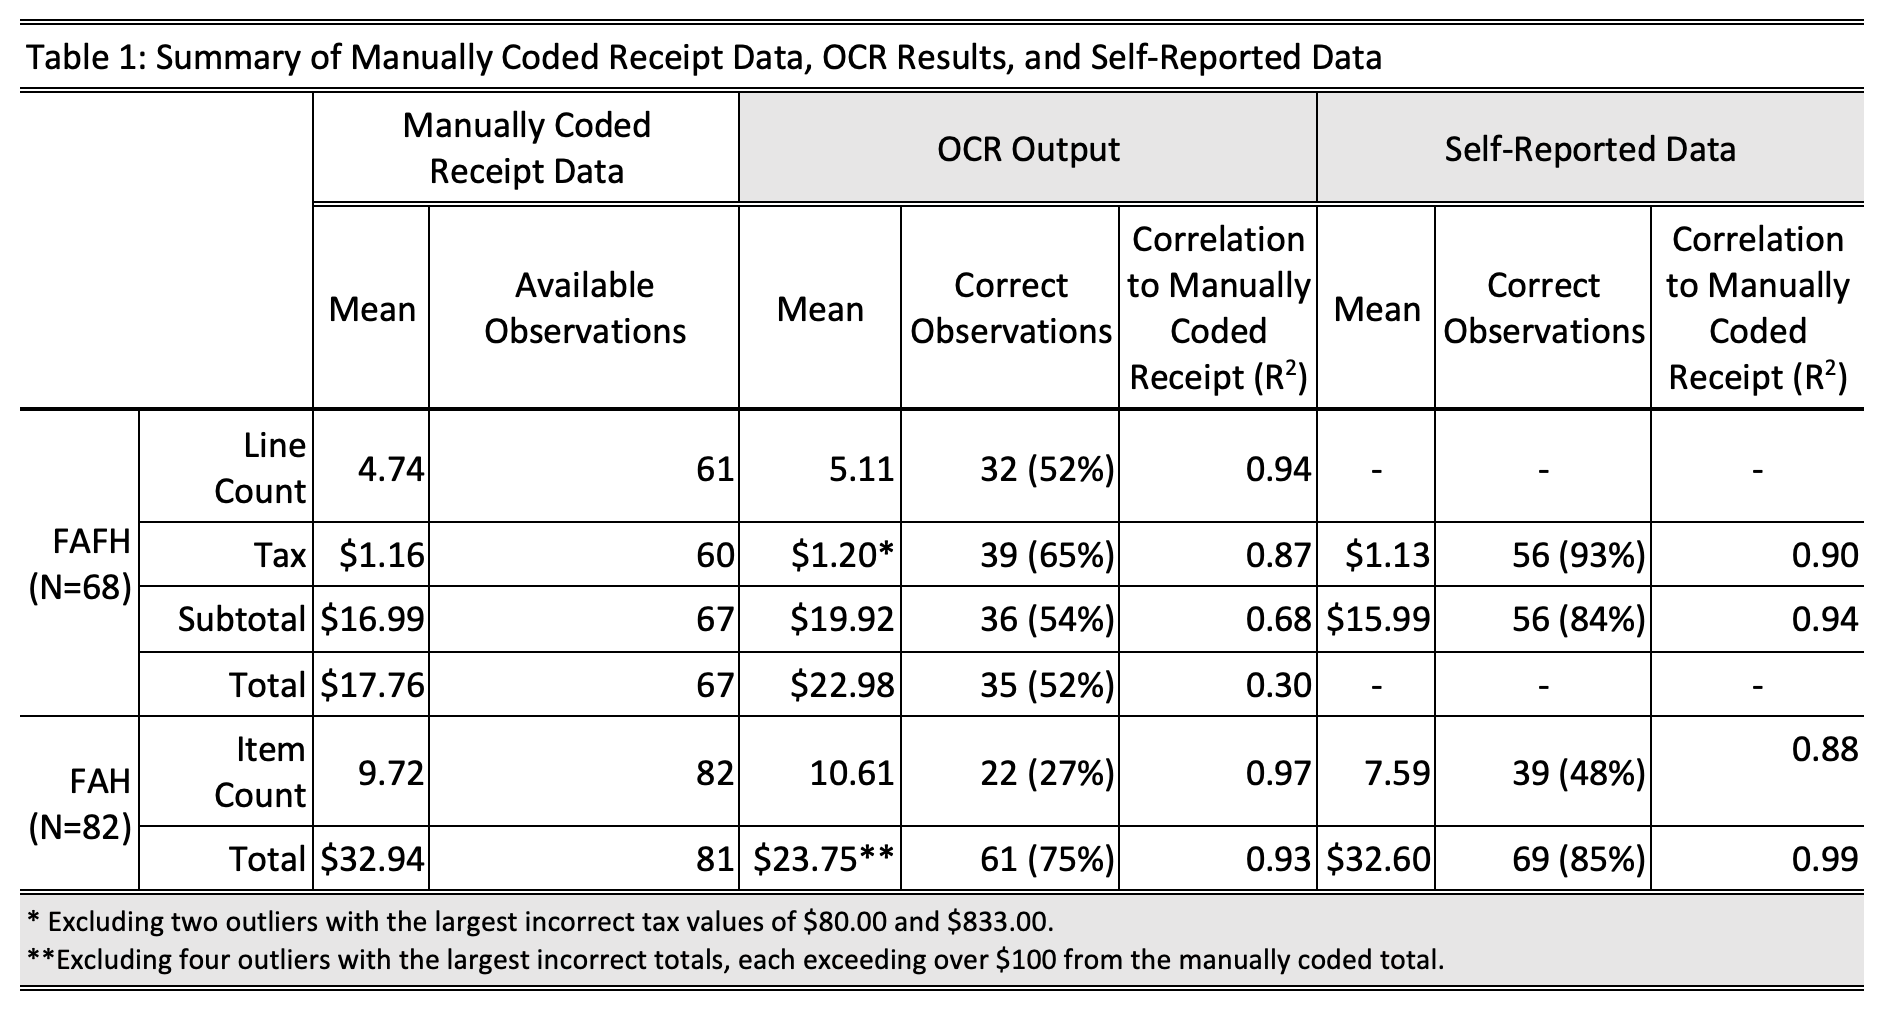
Within the FAFH test case events, the mean line count in the OCR output is 5.11 lines and only slightly higher than the mean line count of 4.74 in the manually coded receipt data. The resulting correlation between the OCR line count and the manually coded receipt is R2 = 0.94, indicating that OCR is largely consistent in its ability to capture lines of text without other conditions applied. OCR over-estimates the average tax by $0.04 whereas the respondent-reported data under-estimates the average tax by $0.03. Additionally, we see that the correlation of OCR tax results to the manually coded receipt tax (R2 = 0.87) is nearly the same as the correlation of the self-reported tax data to the manually coded receipt values (R2 = 0.90), excluding the two largest tax mis-captures of $80.00 and $833.00 from the OCR results. The average subtotal from the OCR results ($19.92) is notably higher than the manually coded data ($16.99). The correlation of the OCR subtotals to the manually coded receipt values is R2 = 0.68. The respondent-reported data of subtotal ($15.99), in turn, more closely match with the manually coded receipt values, with a correlation of R2 = 0.94. For the total of FAFH receipts, we see that the manually coded data yield a mean of $17.76 while the OCR results yield a mean of $22.98, with a correlation of R2 = 0.30.
The final two rows of Table 1 present a similar summary of the FAH data. The OCR results over-estimate the average number of items per receipt (10.61) compared to the manually coded data (9.72). The respondent-reported data, in turn, under-estimate the average item count (7.59). Although we find that OCR correctly captures the exact number of items for only 27% of the FAH receipts, the correlation of OCR item counts to the manually coded receipt values (R2 = 0.97) is much stronger than the correlation of self-reported item counts to the manually coded receipt data (R2 = 0.88). Finally, we find that OCR performs quite well at capturing FAH totals. Although the average total based on the OCR results ($23.75) under-estimates the average total from the manually coded receipts ($32.94) by almost $10.00, OCR captures the correct total in 75% of test cases, with a correlation of R2 = 0.93, after excluding outliers. The respondent-reported average total ($32.60) matches closely with the manually coded total and captures the correct total in 85% of test cases, with a correlation of R2 = 0.99.
Discussion
This work set out to explore the feasibility of using open-source OCR software and a custom-tailored algorithm to capture expenditure data from images of food-purchase receipts. The value of receipts as a record of expenditure is high and a process that makes receipts machine readable would provide immense cost savings by reducing the level of effort needed to access and analyze the data. Although the results of OCR were generally less accurate than the reported data, OCR did perform well in some situations. We present this work as evidence that computer vision methods can successfully capture text data.
We found OCR to be successful in capturing more accurate data on FAH item counts, which were one of the most commonly under-reported event details in both FoodAPS-1 and the ADCM (Kaderabek et al. 2021). Additionally, we found OCR to reliably capture several data elements from text when the image quality is sufficient, although the results can be drastically impaired by a lack of consistency across images. It is our believe that a more focused scope could greatly improve the performance of OCR. For example, Walmart accounted for roughly 15% of the FAH receipts submitted during the ADCM. The ability to construct less sophisticated algorithms that focus on specific establishments could provide meaningful insight into patterns of over- and under-reporting food acquisition and expenditure.
One of the substantial limitations of OCR is that the extracted values potentially deviate from the actual receipt data to a large extent. If OCR mis-captures text, the result may be missing integers or including errant digits altogether. The most extreme example in this study is the OCR-based tax of $833.00 for a receipt indicating a total of $26.64, with a manually coded tax of only $1.69. Interestingly, while the tax captured was almost 500 times higher than the tax based on manually coded receipts, OCR successfully captured all items and corresponding prices accurately, the sum of which matched the receipt subtotal perfectly.
A review of OCR’s performance in recognizing our specified REGEX patterns (e.g., “tax”, “subtotal”, and “total”) offered no clear insights into the overall performance of the algorithm aside from supporting concerns that accuracy will decrease with poorer image quality. The OCR and parsing processing took about 1 second per receipt and the process was able to batch process images from an existing directory. Comparatively, manually coding generally took between 2-10 minutes per receipt depending on the length for a single coder to review and capture the information on the receipt.
As a method of data collection, we found the use of ImageMagick and Tesseract OCR to be accessible to anyone with a working knowledge of R and/or Python. This work was conducted with no prior familiarity with ImageMagick, Tesseract or regex over an eight-week period during the final semester of the University of Michigan’s Graduate Program in Survey and Data Science. Future work should explore iterative rounds of testing to improve overall performance of the algorithm, including predictive classification of text and modularized versions of the algorithm tailored for specific establishments.
In conclusion, the effort involved in capturing receipt data for analysis may still be the largest impediment to expenditure researchers seeking to use receipts as a way to reduce respondent burden and improve measurement. However, receipts will continue to be a robust source of expenditure data. These results provide some evidence that capturing text data from receipts can be successful and using OCR as a method of data collection can benefit from further investigation.
References
- Cole, N., & Baxter, C. (2016). Lessons learned from the design and implementation of the national household food acquisition and purchase survey (FoodAPS). Mathematica Policy Research.
- French, S. A., Wall, M., Mitchell, N.R., Shimotsu, S. T., and Welsh, E. (2009). Annotated receipts capture household food purchases from a broad range of sources. International Journal of Behavioral Nutrition and Physical Activity 6: 37.
- Geisen, E., Richards, A., Strohm, C., and Wang, J. (2011). U.S. Consumer Expenditure Records Study, Final Report.
- Google (2021). Tesseract OCR v 5.0.0. Lead Developer, Ray Smith. Repository Maintainer, Zdenko Podobny. Available at: https://github.com/tesseract-ocr.
- ImageMagick Development Team (2021). ImageMagick. Available at: https://imagemagick.org.
- Jäckle, A., Burton, J., Couper, M.P., and Lessof, C. (2019), Participation in a mobile app survey to collect expenditure data as part of a large-scale probability household panel: Coverage and participation rates and biases. Survey Research Methods, 13(1): 23-44.
- Jäckle, A., Couper, M. P., Gaia, A., and Lessof, C. (2021). Improving survey measurement of household finances: A review of new data sources and technologies. In P. Lynn (ed.), Advances in Longitudinal Survey Methodology. New York: Wiley, pp. 337-367.
- Kaderabek, A., West, B., Kirlin, J.A., Gonzalez, J., and Page, E. (2021). Is Proof of Purchase Really Proof? Presented at the Federal Computer Assisted Survey Information Collection (FedCASIC) Conference 2021. Virtual Conference.
- Kirlin, J. A., and Denbaly, M. (2017). Lessons learned from the national household food acquisition and purchase survey in the United States. Food Policy, 72, 62-71.
- National Research Council (2013). Measuring What We Spend: Toward a New Consumer Expenditure Survey. Panel on Redesigning the BLS Consumer Expenditure Surveys, Don A. Dillman and Carol C. House, Editors. Committee on National Statistics, Division of Behavioral and Social Sciences and Education. Washington, D.C.: The National Academies Press.
- Page, E.T., Larimore E., Kirlin J.A., and Denbaly M. (2019). The National Household Food Acquisition and Purchase Survey: Innovations and research insights. Applied Economic Perspectives and Policy, 41(2): 215-234.
- Rankin, J. W., Winett, R. A., Anderson, E. S., Bickley, P. G., Moore, J. F., Leahy, M., Harris, C. E., and Gerkin, R. E. (1998). Food purchase patterns at the supermarket and their relationship to family characteristics. Journal of Nutrition Education 30(2): 81-88.
- Ransley, J. K., Donnelly, J. K., Khara, T. N., Botham, H., Arnot, H., Greenwood, D. C., and Cade, J. E. (2001). The use of supermarket till receipts to determine the fat and energy intake in a UK population. Public Health Nutrition 4(6): 1279-1286.
- Read, B. (2019). Respondent burden in a mobile app: Evidence from a shopping receipt scanning study. Survey Research Methods, 13(1): 45-71.
- University of Essex, Institute for Social and Economic Research. (2021). Understanding Society: Spending Study 1, 2016-2017. [data collection]. UK Data Service. SN: 8749. Available at: http://doi.org/10.5255/UKDA-SN-8749-1
- U.S. Department of Agriculture (2012). Food Assistance and Nutrition Programs: The National Household Food Acquisition and Purchase Survey (FoodAPS). Available at: https://www.ers.usda.gov/data-products/foodaps-national-household-food-acquisition-and-purchase-survey/.
- Westat (2011). Redesign Options for the Consumer Expenditure Survey. Rockville, MD: Westat. Available at: http://www.bls.gov/cex/redwrkshp_pap_westatrecommend.pdf.
- Yan, T., and Maitland, A. (2016). Review of the FoodAPS 2012 Instrument Design, Response Burden, Use of Incentives, and Response Rates. Prepared for the Economic Research Service, U.S. Department of Agriculture. Washington, D.C.
-
Keywords
calibration CATI coverage coverage bias cross-national surveys data linkage data quality European Social Survey experiment face-to-face face-to-face survey Facebook hard to reach populations incentives item nonresponse measurement measurement error mixed-mode surveys multitasking non-probability samples Nonresponse nonresponse bias nonresponse rates paradata PIAAC Probability sample probability samples QR codes rare populations response rate Satisficing social desirability Social media survey survey-taking climate survey data survey management survey methods Telephone survey telephone surveys total survey error unit nonresponse validity web survey Web surveys weighting
