

Challenges in sampling students with and without special educational needs in inclusive settings for an educational longitudinal study
Schmitt, M., Gresch, C. & Labsch, A. (2023). Challenges in sampling students with and without special educational needs in inclusive settings for an educational longitudinal study. Survey Methods: Insights from the Field. Retrieved from https://surveyinsights.org/?p=17319
© the authors 2023. This work is licensed under a Creative Commons Attribution 4.0 International License (CC BY 4.0) 
Abstract
In 2009, Germany adopted the UN Convention on the Rights of Persons with Disabilities and thus commits itself to the implementation of an inclusive education system. In this context, the number of students with special educational needs in general schools increases. However, to date, there is little information on the design of inclusive learning in secondary education from a nationwide perspective in Germany. Therefore, there is a need to create a valid data basis. Against this background, the project INSIDE (“Inclusion in lower secondary tier in Germany”) was conducted, founded by the Ministry of Education and Research in Germany. The process of drawing a sample is associated with various challenges due to accessing the population as well as due to the Corona crisis. The paper discusses the handling of these challenges and the experiences with a view to further large-scale studies.
Keywords
educational research, inclusion, large-scale assessment, longitudinal study, sampling, students with special educational needs
Acknowledgement
The project underlying this article was funded by the Federal Ministry of Education and Research under grant IN1503A, IN1503B, IN1503C, IN1503D. The content of the publication is solely the responsibility of the authors.
Copyright
© the authors 2023. This work is licensed under a Creative Commons Attribution 4.0 International License (CC BY 4.0)
1. Introduction
With ratifying the UN Convention on the Rights of Persons with Disabilities, Germany (CRPD) has committed to an inclusive education system. Accordingly, students with special educational needs (SEN) increasingly learn at general schools with students without such needs. Empirical findings show that neither students with SEN nor their classmates without SEN suffer from disadvantages due to joint learning. Instead, there are rather positive effects (cf. for an overview, e. g. Werning 2014). However, only little is known, mainly on a regional level, about how and under which conditions learning in an inclusive setting can be successfully implemented and how inclusive education affects students’ development over time.
This lack of information is the starting point for the interdisciplinary cooperation project INSIDE (“Inclusion in lower secondary tier in Germany”), funded by the German Federal Ministry of Education and Research (BMBF) (cf. information on the project Schmitt et al., 2020). In order to examine the conditions under which students develop successfully in an inclusive setting, the INSIDE longitudinal study in schools was conducted to create a database with sufficient data at the school, class, and individual level.
However, the federal states in Germany differ regarding their definition of SEN-Students. Some focus only on students with an official diagnosis. Others (also) include students with special educational support independent of a diagnosis. After all, not all federal states can provide reliable information about schools, including students with SEN, as they are needed for drawing a sample. Furthermore, there exist different understandings of inclusion (see Göransson & Nilholm, 2014): A narrow understanding refers to students with SEN placed in general education classrooms. A broader understanding includes meeting all students’ needs or even creating communities with specific characteristics. A database that allows research on inclusive learning needs to address these different approaches is missing.
By this, the overarching research question to be answered by this paper is how we can create a database in Germany that enables research on the implementation and consequences of inclusive education and what recommendations can be derived for future research, considering (1) the varying preconditions in the federal states and (2) the different understandings of inclusive education.
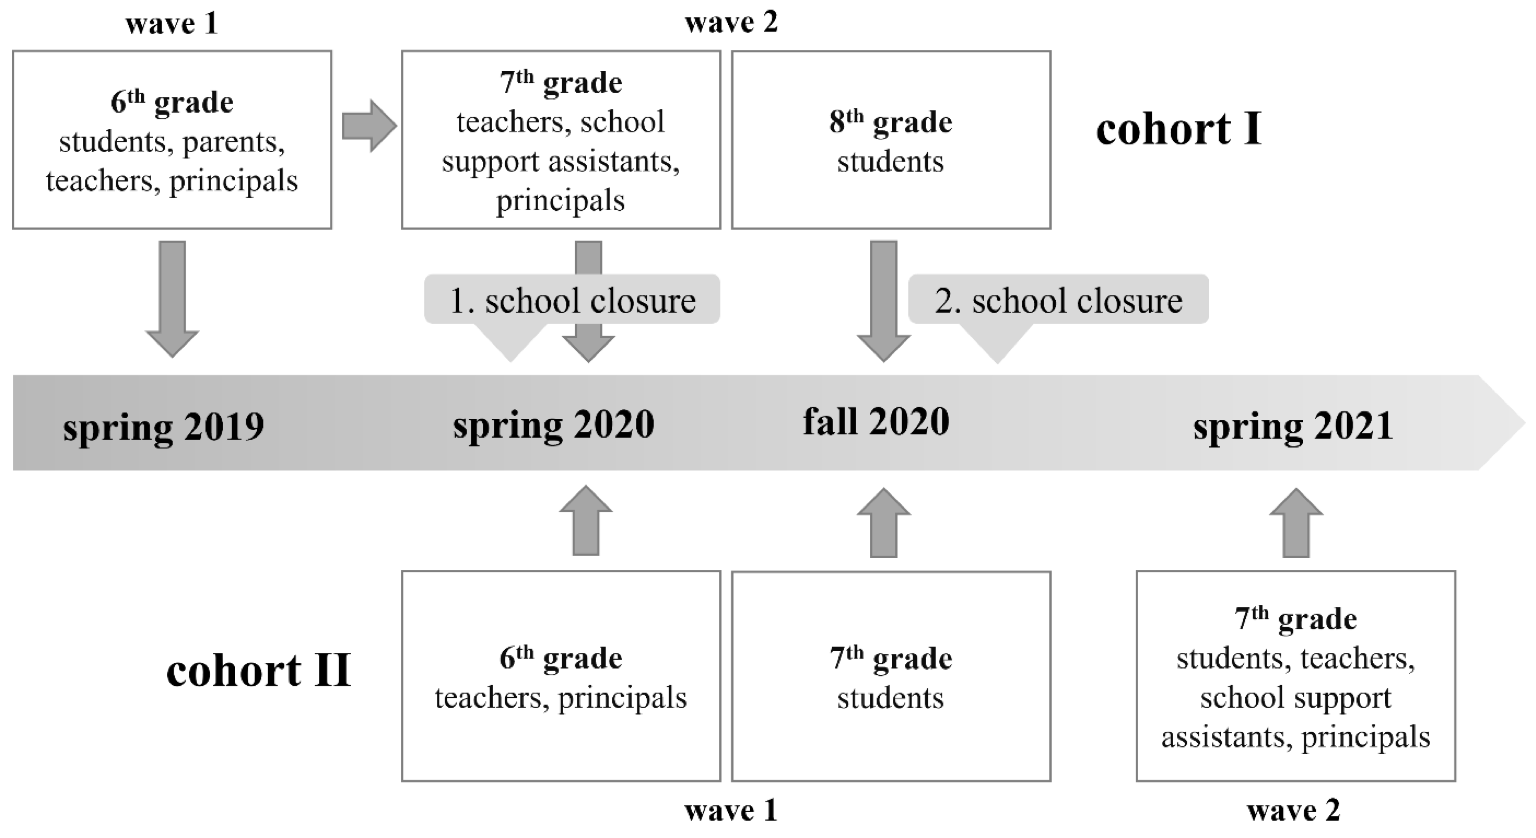
The original plan was to survey and test students from Grades 6 (wave 1, spring 2019) and 7 (wave 2, spring 2020) in about 500 schools nationwide. In addition, the principals, teachers, school support assistants, and parents of the participating students were to be interviewed. The survey design of this INSIDE longitudinal study can be seen in Figure 1[1].
Figure 1: Initially planned survey design of the INSIDE longitudinal study
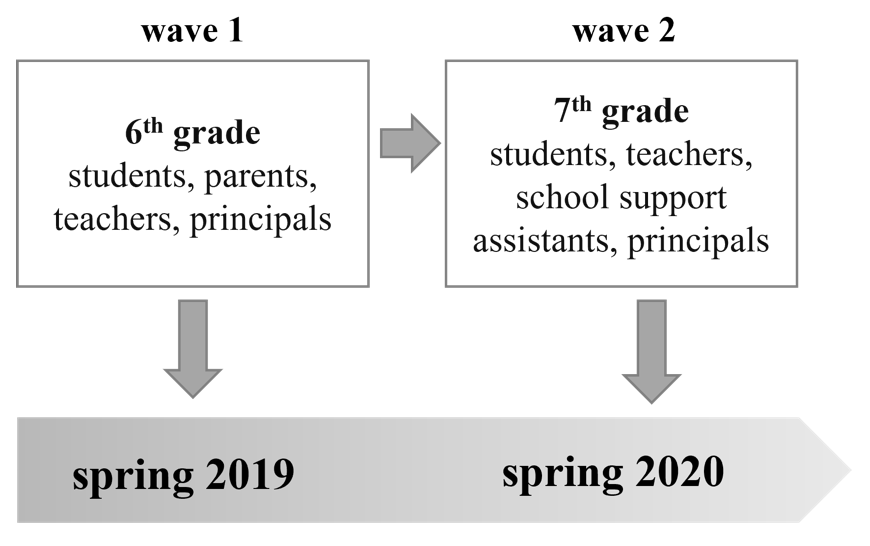
We focused on general schools with at least one SEN student with special needs in “learning” and “emotional and social development” taught together with students without SEN in Grade 6. The special needs area of “learning” is the support area with the proportionally highest number of students (cf. KMK, 2018). Students with special needs in “learning” and “emotional and social development” are predominantly taught inclusively at general schools. The study’s criteria for defining SEN and inclusion were still as open as possible. SEN includes students who have undergone an official or in-school assessment procedure or receive special education support independent of an official procedure. Furthermore, we decided to collect data from these SEN students and all other students in their classes to enable research using a broader understanding of inclusive education.
The sampling process was subject to several challenges. To invite schools to participate in a study on the conditions and consequences of inclusive learning, it is first necessary to identify schools where SEN students are taught (cf. Gresch et al., 2014). In addition to identifying inclusive schools, another challenge was to recruit these schools, principals, teachers, parents, and students for participation in the survey. The federal states have different specifications regarding the use of incentives, which is why they could only be used in part. Due to a lower participation rate than expected, we had to draw an additional sample (cohort II) to reach a sufficient sample size. The closure of schools associated with COVID-19 subsequently necessitated adjustments to the survey design, as has been the case with many other studies. Therefore, we had to adapt our survey design due to several aspects, as described in the following section.
2. Survey design
2.1 Identification and recruitment of inclusive schools and students: Cohort I
2.1.1 Identification of students with SEN in inclusive learning environments
Sampling for the INSIDE longitudinal study aimed to recruit schools in which at least one SEN student in the area of “learning” and/or “emotional and social development” was taught in Grade 6 (which was the focus of the first wave) in a general education school (low vocational school track, school type with several education tracks, intermediate vocational school track, integrated comprehensive school, independent Waldorf school, and academic school track, both state and private institutions). Accordingly, the study population consisted of all lower secondary schools SEN students attended in the abovementioned areas.
However, the challenge for the present study was that there is no so-called school list of inclusive schools, including information about the initial situation and organizational structures from the official school statistics (usually used to draw a school sample (gross sample)). The lack of such a list is due to several reasons. First, there are no uniform criteria for identifying SEN students at the school level in the German states (e. g., Malecki, 2013; Piezunka et al., 2016). Second, special education support is sometimes provided based on flat-rate resource allocation in some federal states, and these students with SEN are not mandatorily registered in the official data (cf. KMK, 2018: XI). Third, in some federal states, no official information was available to identify schools with SEN students at all (cf. Gresch et al., 2014). Thus, there is no sampling frame for our target population. Therefore, we had to collect information on our own to draw a gross sample from schools in which after recruitment at least one SEN student in the area of “learning” and/or “emotional and social development” was taught in Grade 6.
The initial plan was to collect information on the attendance of SEN students and other information in an upstream online survey of school principals during spring 2018 (school year 2017/18) and to select schools (gross sample) on this basis. For this selection we had to consider two uncertainties regarding our target population: First, we had to refer to data from the previous grade (grade 5) to identify students with SEN in grade 6, second, we expected a participation rate from about 30 to 50 percent of the students. To ensure, that at least one student with SEN finally participates in our study, we focused on schools with at least three students with SEN in the previous school year (grade 5).
After consultation with the federal states, the study received permission to draw a sample of 5,500 schools based on official data from school year 2016/17 (cf. Statistisches Bundesamt, 2017). For the federal states which didn’t allow for identifying SEN students, we received additional information requested from the state statistical offices via the Standing Conference of the Ministers of Education and Cultural Affairs (Kultusministerkonferenz, KMK) (see Gresch et al., 2021 for details).
Access 1: This sample of 5,500 schools was asked for information on the joint learning of students with and without SEN. Information was obtained from 1,360 schools, of which N = 1,014 schools actively participated in the survey. Based on the information from this survey and the official data, 745 schools were selected at which at least three SEN students were taught in the areas of “learning” and/or “emotional and social development” in Grade 5 in the school year 2017/18 (as for the reasons described above). It was, therefore, highly probable that at least one of these students would attend Grade 6 in the following school year (2018/19) (which was the aim of recruitment) and participate in the study. One other school was subsequently included on its own initiative.
As with other voluntary surveys, lower participation rates were expected than for mandatory studies. This means that many schools must be included in a gross sample to obtain a sufficiently large number of schools willing to participate in a study (net sample). The number of 745 schools selected through Access 1 would presumably not be sufficient to achieve a large enough net sample for the study. Further, it was expected that schools would still be part of the gross sample that were not part of the target population, i. e., “wrongly” identified.
Therefore, the initial plan to select schools based only on Access 1 was softened, and additional schools were decided to be included in the gross sample. For this, the information from the sample defined for the online survey was drawn upon again:
Access 2: An additional N = 1,896 schools were chosen from the official data from school year 2016/17 and on the additional information already used as the basis for the online survey. These schools were not selected for those participating in the online survey (and therefore not part of the sample of the 5,500 schools). Still, according to the available information for the school year 2016/17, they were likely teaching SEN students in Grade 6 in the school year 2018/19.
Once recruitment started, it became apparent that the net sample would likely still not be large enough even after including these schools, so once again, additional schools had to be included in the gross sample.
Access 3: For this, the information from the sample of the 5,500 schools defined for the online survey was drawn upon again, and schools selected (N = 1,813) that already had been asked to participate in the online survey but had not taken part in it, but according to the available information, taught SEN students in Grades 5 and/or 6 in the school year 2016/17.
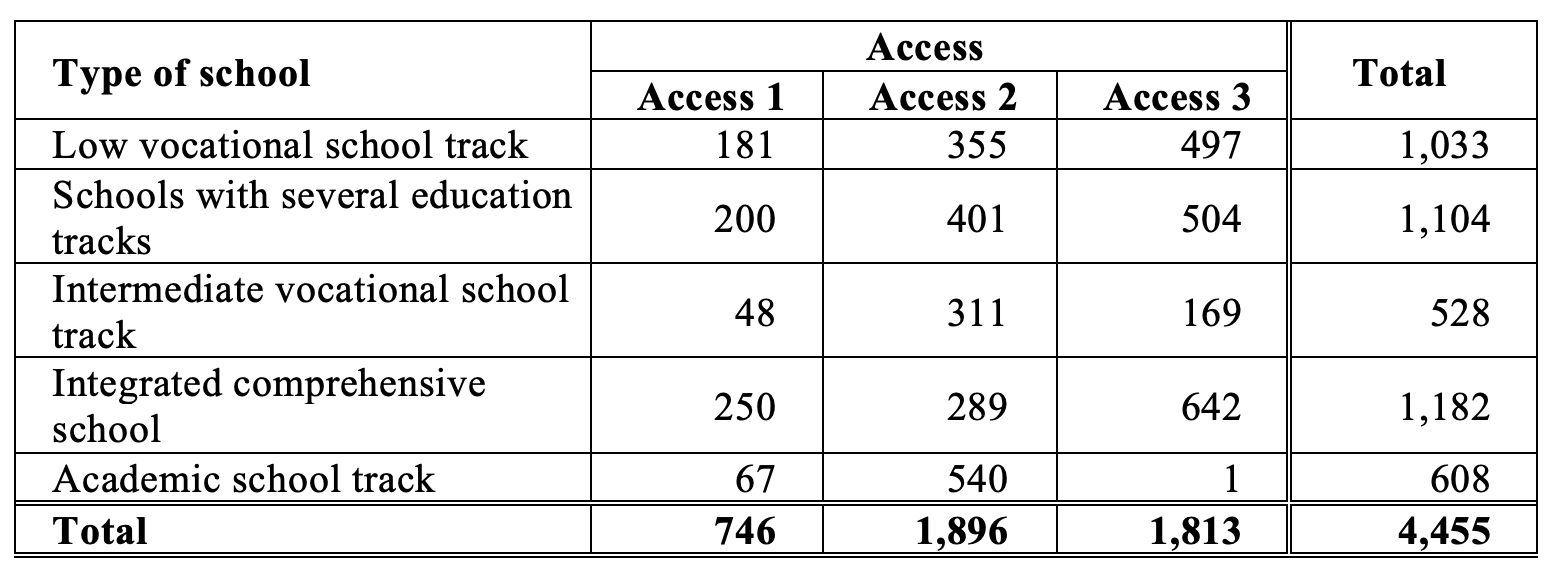
In total, the gross sample at the school level for the INSIDE longitudinal study included N = 4,455 schools at which one SEN student in the area of “learning” and/or “emotional and social development” is at least likely to be taught in grade 6 in the 2018/19 school year. Table 1 shows the composition of the gross sample by access and school type.
Table 1: Distribution of drawn schools by access and type of school
2.1.2 Recruitment of inclusive schools
2.1.2.1 Incentives to participate
When inviting the selected schools to participate in the INSIDE study, it was essential to keep in mind that the intended target population of this study on inclusive learning in lower secondary schools would be a group of people who learn together under a wide variety of requirements and framework conditions in the school context and who may face challenges in their everyday school life. The inclusive character of the project was also applied to incentivization, and participation was not incentivized per target person, as is common in comparable (longitudinal) studies. Therefore, at the first and the second wave, an incentive was used at the school level independent of individual persons’ participation. Accordingly, all schools were informed during the initial contact that they would receive a monetary amount after participating in the respective wave. They could use this incentive payment to attend educational events on inclusion topics in the school setting or to purchase materials for the school community. In this way, schools could decide for themselves what the money would be invested in, although they were encouraged to consider inclusive criteria whenever possible. Thus, schools could spend financial resources according to local needs and with little administrative effort (without requiring additional agreement). The announcement of the incentive at the school level was timed to positively affect the willingness of all school stakeholders, including external stakeholders (parents), to participate and ensure long-term participation (panel stability). Due to special conventions in the different German states, the described procedure was prohibited in all states. Therefore, we have a quasi-experimental situation allowing for investigating whether the incentive was decisive in obtaining a school’s agreement to participate in INSIDE.
2.1.2.2 Result of school recruitment
To ensure that at least one SEN student in the areas of “learning” and/or “emotional and social development” was actually taught in Grade 6 in the school year 2018/19, an inquiry about the number of sixth-grade SEN students in these areas was included in the first recruitment contact, before obtaining consent at the student level. Of the 4,555 schools invited to participate, 348 (7.8 %) agreed to participate during the recruitment process, 2,074 schools actively refused participation, and 2,033 schools didn’t respond to the invitation. Around 20 % of the schools that actively refused participation reported that no students received special needs education in “learning” and/or “emotional and social development” in Grade 6. It is possible that this also applied to schools that did not respond to the invitation, gave no reasons, or gave other reasons. Of the 348 schools that expressed an interest in participating during the school recruitment process, 231 participated in the survey in May 2019. About 20 % of the 117 schools that had initially agreed to participate did not take part in the survey because, in the meantime, no (more) students received special education support in the areas of “learning” and/or “emotional and social development.” Academic school tracks were most likely to report that no SEN students were taught in the relevant areas, at just under 25 %. In comparison, the target population was not found in 11 % of the intermediate vocational school track, 6 % of the schools with several education tracks, 9 % of the intermediate vocational school track, and 5 % of the integrated comprehensive school. The net sample of the INSIDE longitudinal study at school level thus comprised 231 schools (5.2 %).
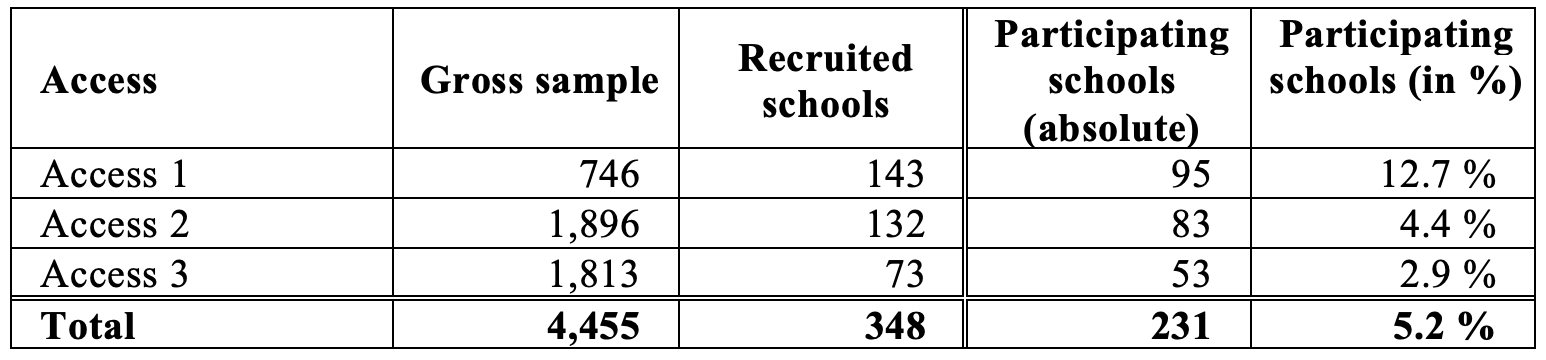
Tables 2 and 3 present the results of school recruitment, showing the development from the gross sample contacted to the final school sample, differentiated by the type of school and access. According to these results, the participation rate was lowest for the academic school track (around 2 %) and highest for schools with several education tracks and integrated comprehensive schools. At low vocational school tracks, where a comparatively large number of students from the target population were also identified, recruitment was in the middle range at around 4 %. Regarding access to the sample, schools that already participated in the previous online survey showed the highest willingness to participate (12.7 %, see table 3, access 3).
Table 2: Result of school recruitment by type of school
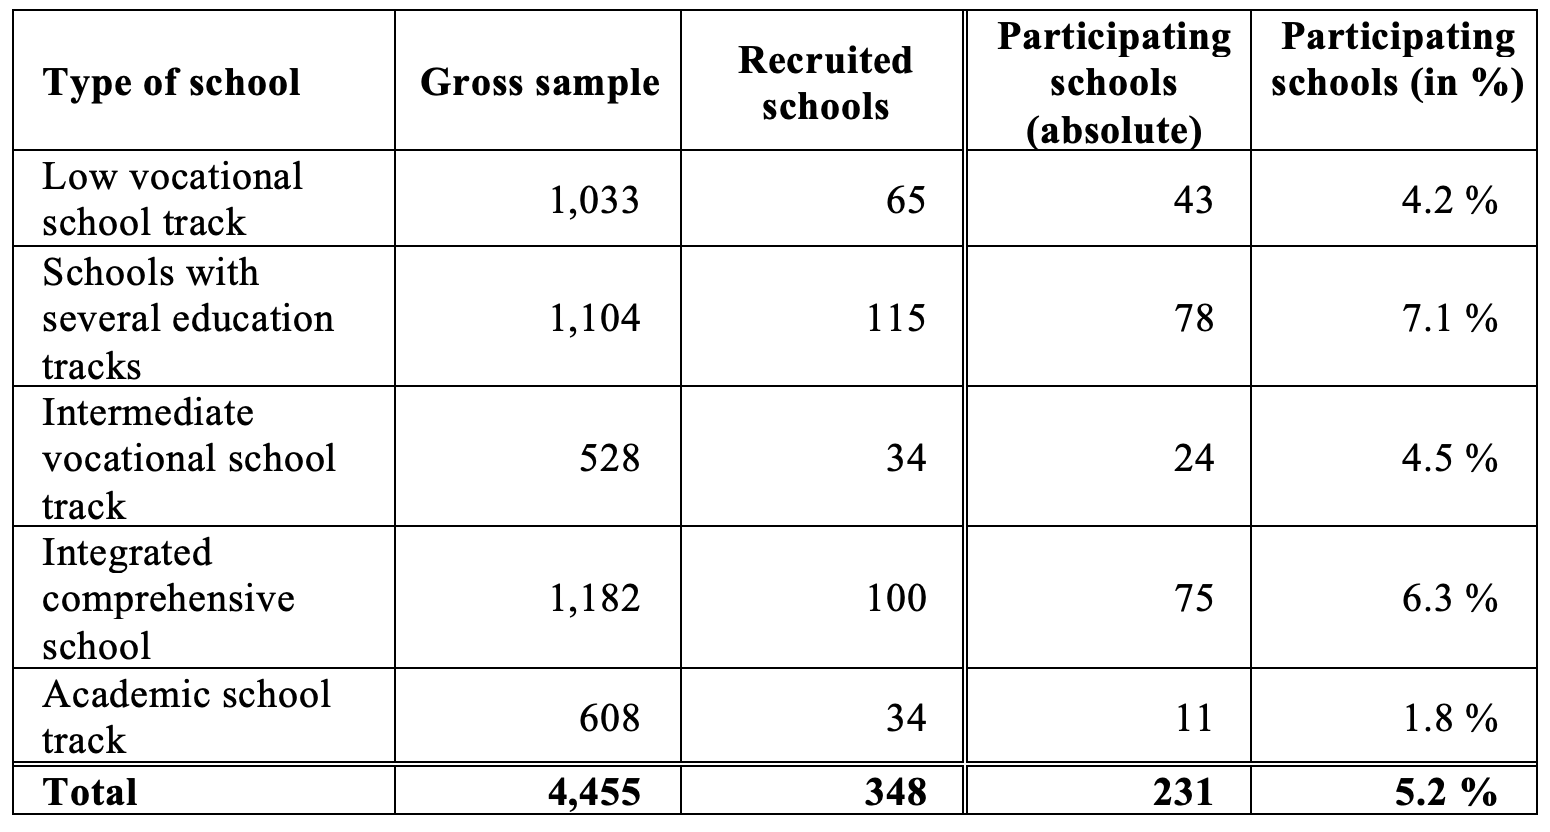
Table 3: Result of school recruitment by access
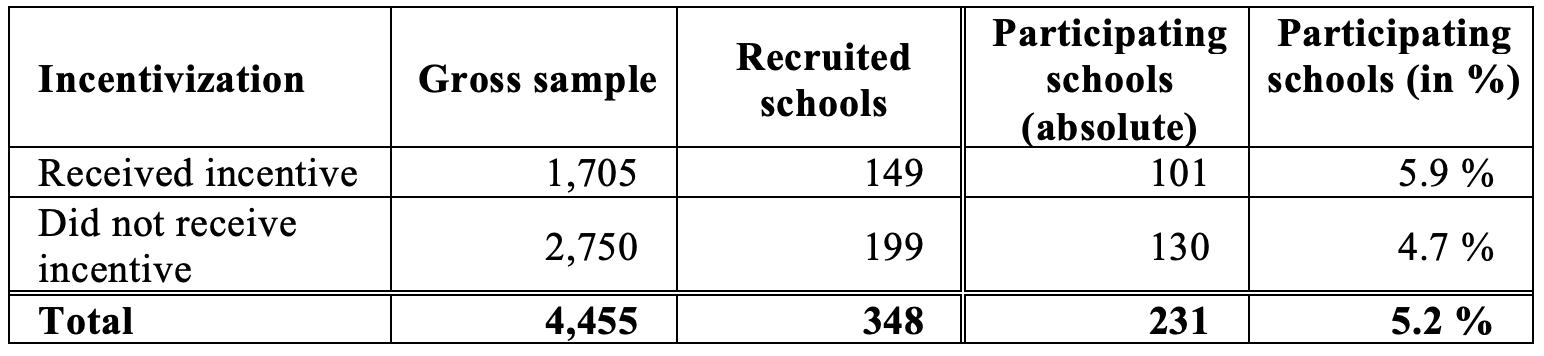
Regarding the school incentives, it can be noted (table 4) that the response was generally positive by schools willing to participate. The participation rate was 5.9 %; at schools without incentives, the participation rate was 4.7 %.
Table 4: Result of school recruitment after incentivization
2.1.3 Recruitment of students from inclusive schools
To address the different understandings of inclusive education, all students of the entire 6th class were invited to participate in the study via information materials. The 231 participating schools reported 16,214 sixth-grade students (requested students) in 715 classes. Of these, 1,781 students (11 %) had SEN: 1,363 (8,4 %) students in the areas of “learning” and/or “emotional and social development.”, 418 (2,6 %) students in other areas, like e. g. physical impairment or mental development. Due to the age of the students, all parents of the 16,214 students had to consent to their participation actively. This consent was obtained for 3,899 students (24.0 %; net sample) in 622 classes. Of these students, 337 (8,6 %) were SEN students in the areas of “learning” and/or “emotional and social development” and 182 (4,7 %) had other support needs. In addition, the parents were also invited to participate in a telephone survey. 2,222 parents (57 %) of the 3,899 students also agreed to participate.
The following tables show the distribution of the students who were willing to participate and therefore recruited (net sample), compared to the requested sample, by type of school (table 5) and SEN (table 6). The participation rate was highest in the low vocational school track and schools with several education tracks and lowest in the academic school track. There was hardly any difference in the participation between students with and without SEN in the areas of “learning” and/or “emotional and social development”.
Table 5: Result of recruitment at individual level by type of school
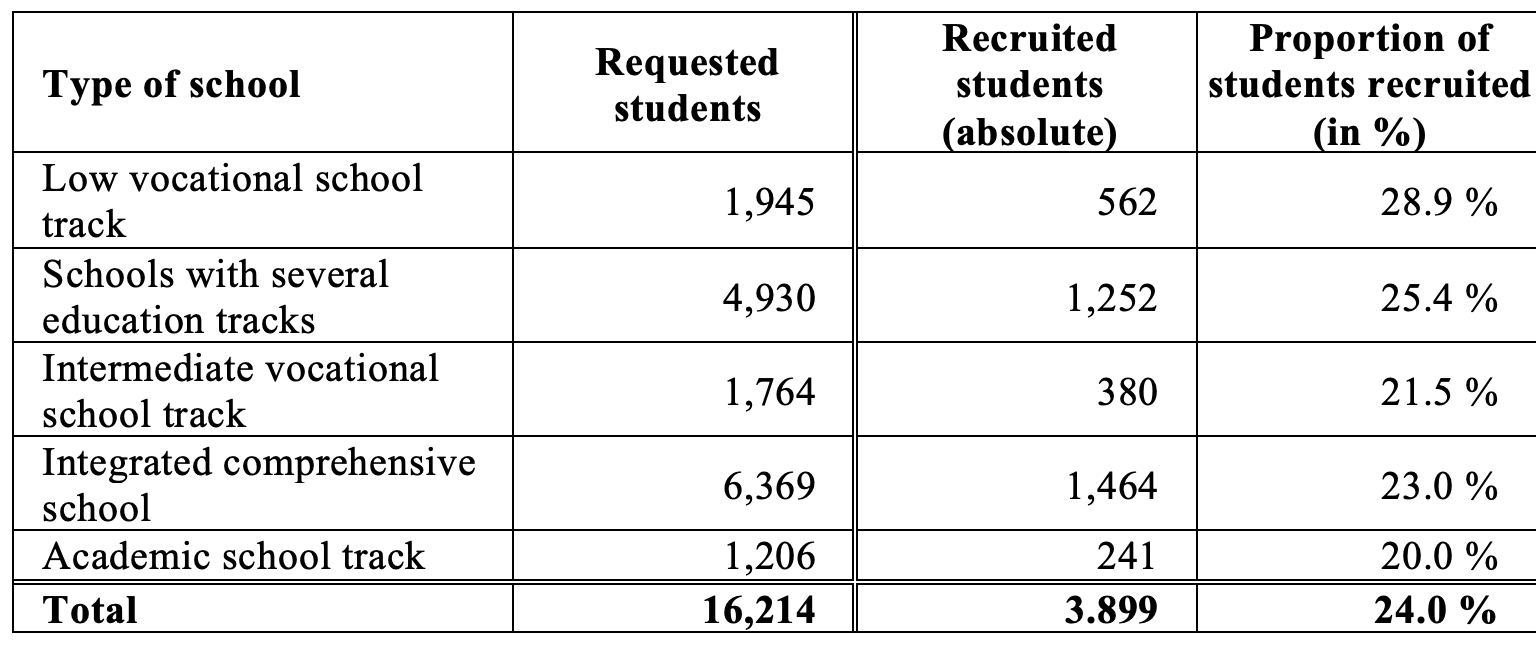
Table 6: Result of recruitment at individual level by SEN
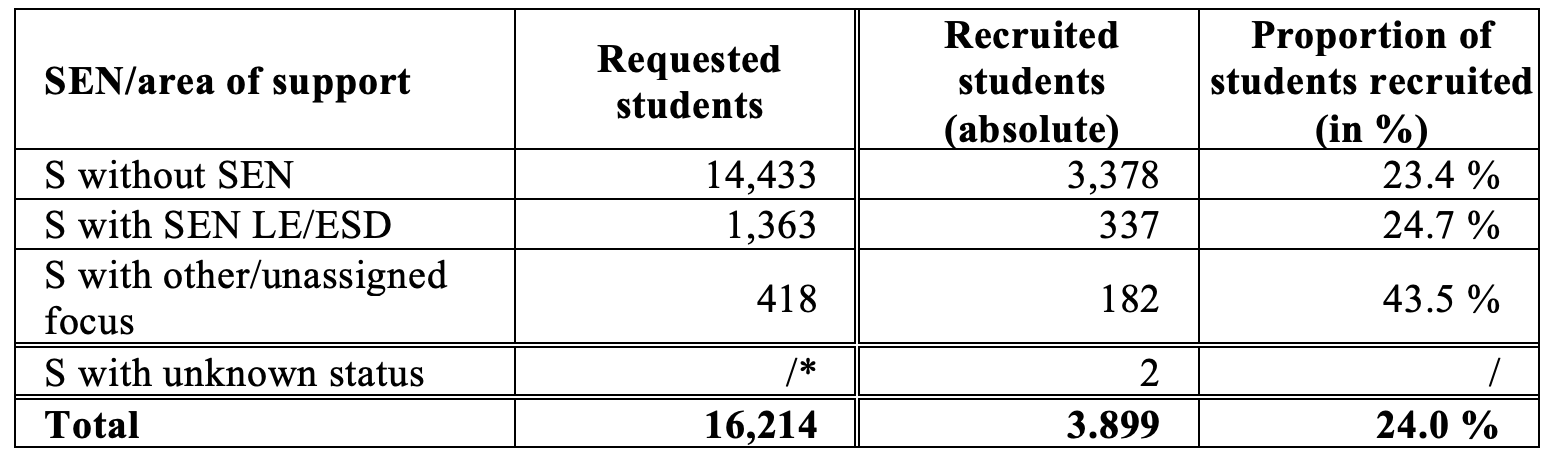
Note: Information on the requested students was collected on an aggregate basis, so either complete information or no information was available.
S = students, SEN = special educational needs, LE = learning, ESD = emotional and social development.
For the INSIDE study, it was important that the sample would allow valid statements to be made about processes of inclusive learning and the developmental trajectories of students with and without SEN. The participation rates achieved up to that point did not correspond to the targeted size from a methodological and content point of view. For this reason, the decision was made to increase the participation rates in INSIDE by recruiting additional schools and students, including their principals, teachers, and parents.
2.2 Post-recruitment of inclusive schools and students: Cohort II
2.2.1 Post-recruitment strategies for cohort II
To increase the validity of the INSIDE project regarding inclusive learning in lower secondary schools, the sample of students was expanded by recruiting a supplementary sample. Thus, a total of two cohorts participated in the INSIDE study. The first wave in Grade 6 of the second cohort was collected at the same time as the second wave in Grade 7 of the first cohort. Different approaches were used to access schools for the second cohort, drawing on existing prior information. First, schools that had already been contacted for the first cohort were approached but from which final feedback had not yet been received (approach 1: 1,948 schools). These schools were assumed to teach at least one SEN student in Grade 6. Based on experience in the first recruitment phase, it was assumed that willingness to participate would not be sufficiently high. As a result, schools that had already participated in the first survey were also asked to participate in the INSIDE study with another Grade 6 (approach 2: 231 schools) in the second wave. Thus, the total gross sample at the school level for the second cohort of the INSIDE longitudinal study included 2,179 schools. Post-recruitment resulted in the following adapted survey design planned for the next surveys (see Figure 2):
Figure 2: Planned survey design after post-recruitment
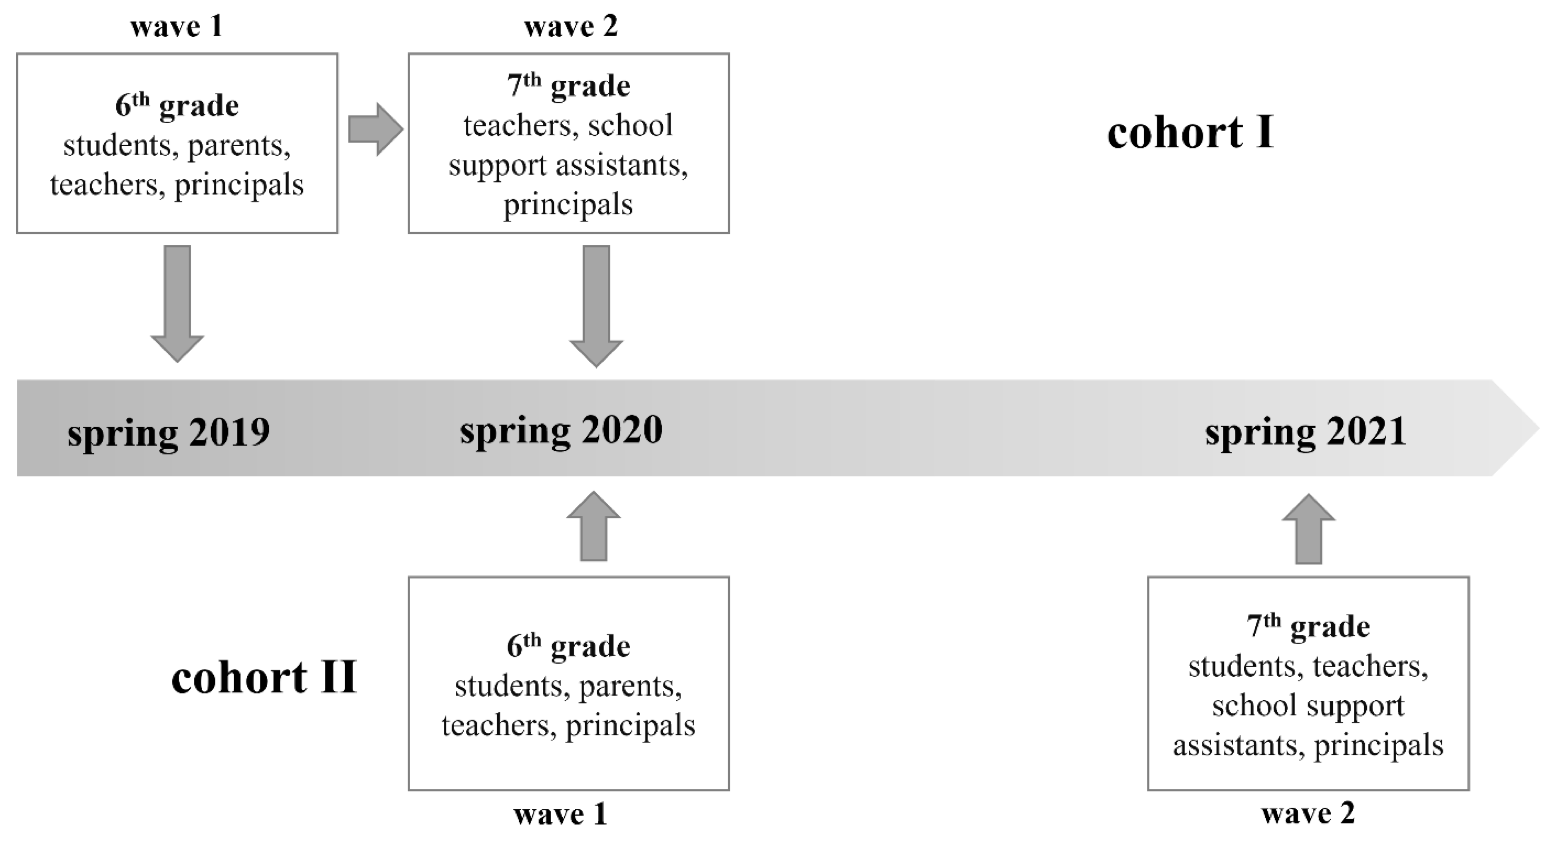
The first cohort is shown above the timeline, the second cohort is below, and the time frame of the surveys is in the middle. Thus, in spring 2019, the survey started with the first wave of the first cohort. In spring 2020, the second wave of the first cohort in Grade 7 and the first wave of the second cohort in Grade 6 occurred. Next, the second wave of the second cohort started in spring of 2021. At the first wave of the first cohort, all participating sixth-grade students received a questionnaire and were asked to complete reading, mathematics, and basic cognitive skills tasks. Principals, all classroom teachers, German and math teachers, and special education staff also received a questionnaire, provided they taught the participating classes. In addition, parents who were willing to participate were interviewed by telephone. The students, teachers, and principals were surveyed again in the second wave of the first cohort in Grade 7. In addition, school support assistants were administered a questionnaire. This survey program was also planned for the second cohort one year later.
2.2.2 Incentives for participation in cohort II
Based on the first cohort’s recruitment experience, the same recruitment strategy was applied to the second cohort. That is, schools were offered a school-level incentive at both waves, which preferably benefited the class as a whole and was not linked to the participation of individuals. Furthermore, additional measures were introduced based on feedback from consulting practitioners and participants. In particular, they expressed the desire to be informed about the study’s results and to be given easier access to information about the study. Hence, so-called “feedback brochures” containing the initial results of the INSIDE study were designed and sent to schools and families. This information was also published on the participants’ website, supplemented with a news page with the possibility to subscribe to a newsletter. In addition, from the second wave of the first cohort and the first wave of the second cohort, cover letters in simple language were sent to the participating families. Moreover, the website offered the possibility of downloading a poster about the study or reading it aloud (cf. Schledjewski et al., 2020).
2.2.3 Recruitment of students from inclusive schools in cohort II
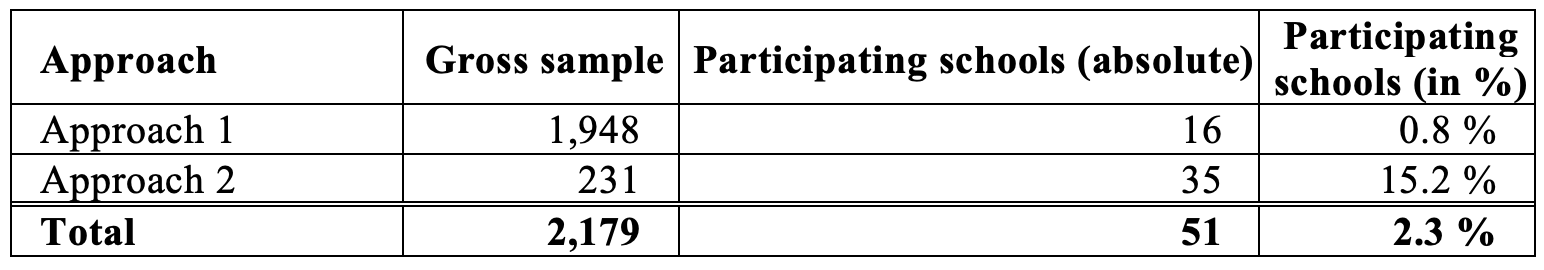
During the second recruitment process, 2,179 schools from the gross sample were contacted (see table 7). Of these, 341 schools (15. 6%) declined to participate, and there was no (final) response from 1,787 schools (82.0 %). Overall, the net sample of the second cohort of the INSIDE longitudinal survey at the school level thus included 51 schools (2.3 %). This low participation rate can be explained by the low participation rate of schools that were not yet part of the first cohort (see table 8, approach 1: 0.8 %). The willingness to participate was significantly higher among those already participating with a first cohort (see table 8, approach 2: 15.2 %). Considering only the schools in the first cohort still participating in the second wave (184 schools), the recruitment rate at these schools to participate in a second cohort was 19 %.
Table 7: Result of school recruitment by type of school (cohort II)
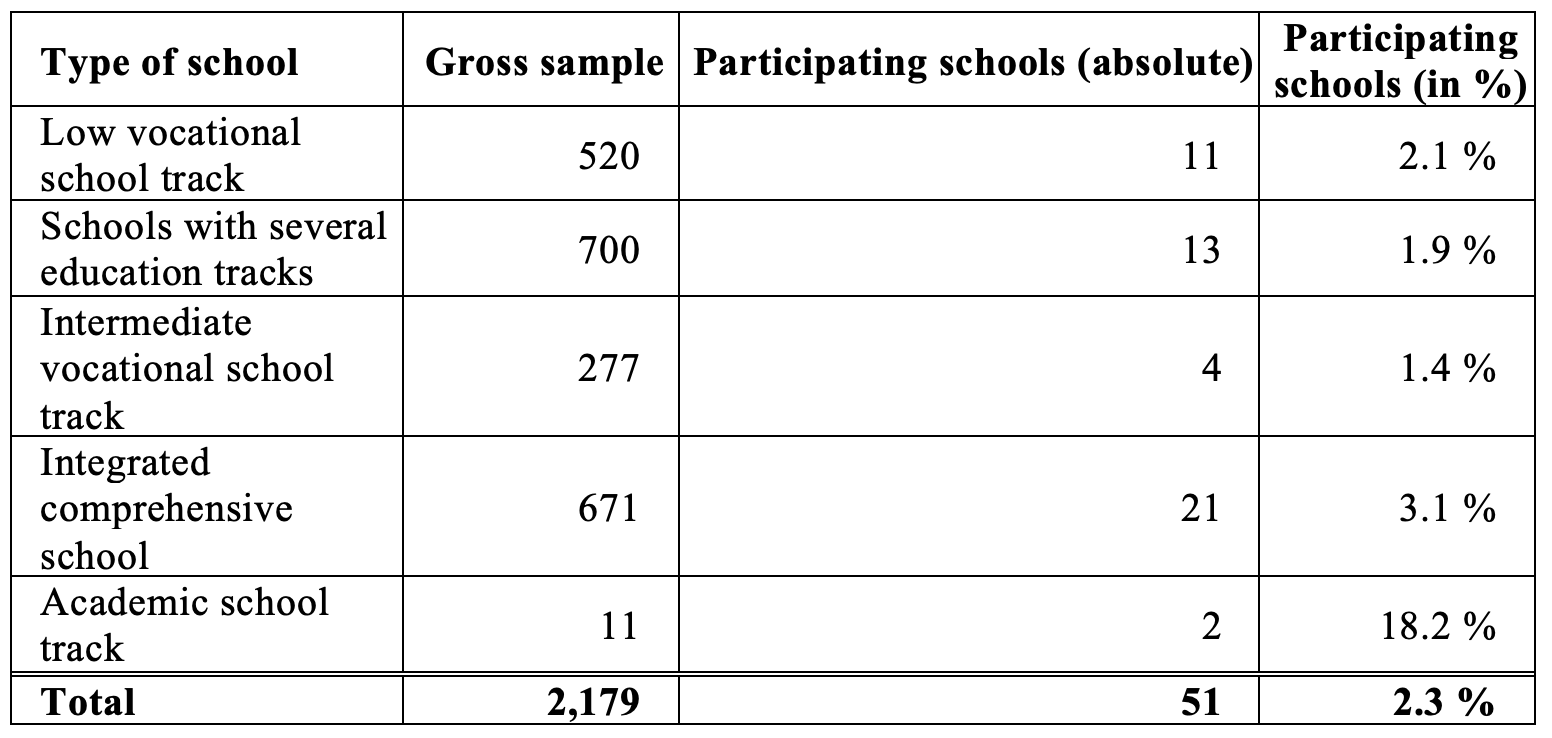
Table 8: Result of school recruitment by access (cohort II)
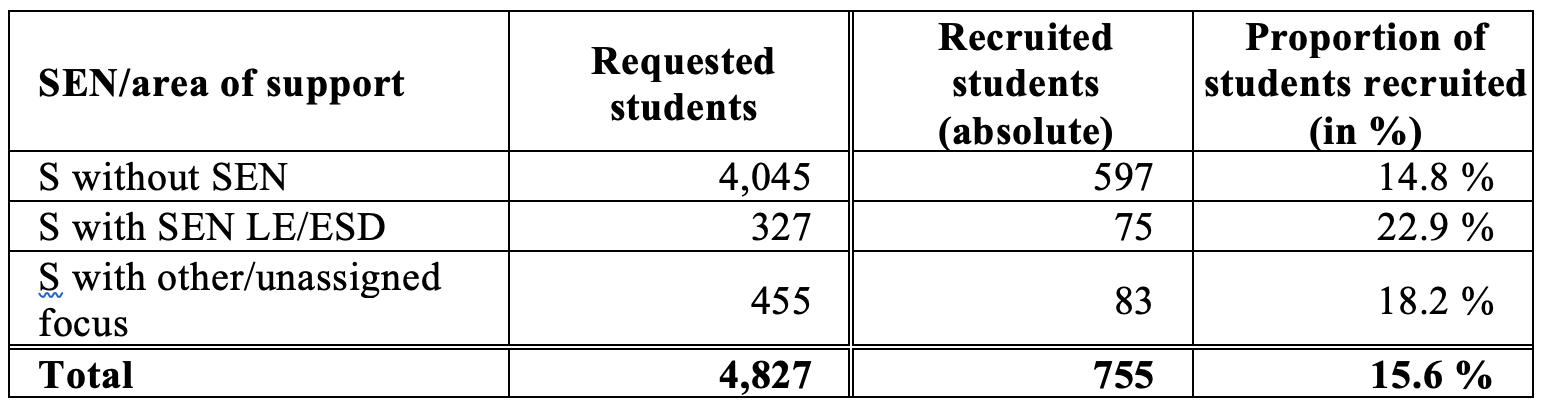
Of the 51 schools willing to participate in the second cohort, all students in Grade 6 were asked to participate in the survey. The schools reported a total of 4,827 sixth-graders (see table 9; requested students), 327 of whom had special educational needs in the areas of “learning” and/or “emotional and social development”. Valid parental consent forms were available for 755 students (15.6 %; net sample). Of these, 75 students had special educational needs in the areas of “learning” and/or “emotional and social development,” and 83 had other special needs. Once again, parents were invited to participate in a telephone survey. 400 parents of the 755 students agreed to participate.
The following tables show the distribution of the students who were willing to participate and therefore recruited (net sample), compared to the gross sample, by type of school (table 9) and SEN (table 10). The participation rate was again (compared to the first cohort, see table 5) highest in the low vocational school track and schools with several education tracks. The total participation of the second cohort (15.6 %) was even lower than in the first cohort (24.0 %). This can be explained mainly by the lower participation rate of students without SEN (cohort I: 23.4 %, see table 6; cohort II: 14.8 %, see table 10). It is striking that in the second cohort, more students have other/unassigned focus than students with SEN LE/ESD. This is because the sample of the first cohort was specifically focused on learning and ESD.
Table 9: Result of recruitment at individual level by type of school (cohort II)
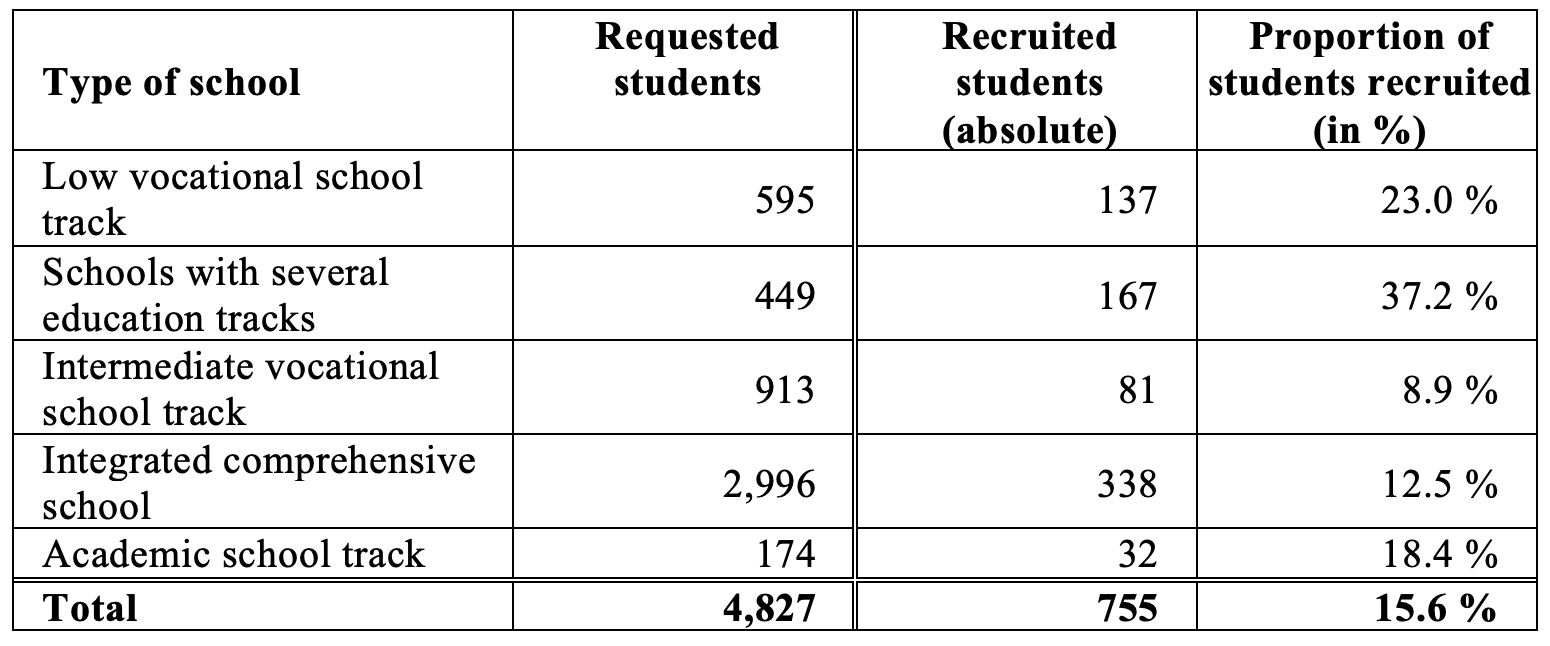
Table 10: Result of recruitment at individual level by SEN (cohort II)
Note: Information on the requested students was collected on an aggregate basis, so either complete information or no information was available.
2.3 Adjustments due to COVID-19-related school closures (cohort I and II)
As mentioned in the previous chapter, the preparation and implementation of the survey in spring 2020 (second wave of the first cohort and first wave of the second cohort) was affected by nationwide COVID-19-related school closures. As of March 2020, schools in Germany were repeatedly closed, and instruction was generally provided remotely via online solutions. Because the INSIDE study had been planned with paper-based group interviews and testing, the original survey design (see figure 2) had to be adapted for both cohorts.
To respond to school closures due to COVID-19, several strategies were discussed to conduct surveys that were as close as possible to the intended design. The INSIDE surveys were timed in the second half to the end of the school year. It was not possible to move the time frame to later in the year in the hope that regular classes would resume in the summer due to the beginning of the summer vacation and the end of the school year. Delaying the surveys by one school year was also impossible for two reasons. On the one hand, the competency tests were designed for a certain stage of development of the students (with and without SEN) and would not have reflected the corresponding status if the time frame had been shifted. On the other hand, a survey of this scope requires a certain amount of time and organizational preparation both inside and outside of schools, e. g., gathering information and creating the survey documents. Much of this survey preparation was already underway or being implemented at the time of the school closures.
For this reason, the survey of school staff, students, and parents were decoupled, and the questionnaires for teachers, school support assistants, and principals were sent to the schools by mail at the originally planned survey date in spring 2020. A different solution was needed for testing and questioning students. The tasks could not be sent to their homes because the competency test was developed as a group test, and the test booklets had to be worked on under guidance and supervision. Against this background, the survey and testing of students and the survey of parents could not be realized as described in Figure 2 but was postponed to the beginning of the new school year in the fall of 2020. In this way, the competency tests still reflected the developmental level of the students for which they were designed. In order to compensate for the time gap or the change in school year between the survey of school staff and students, some validation questions were developed and implemented. On the one hand, these questions were designed to collect information about the school closures, e.g., how the students felt about the time, how they learned during the time, and what contact they had with their teachers and classmates. On the other hand, the questions verified whether the information provided by teachers and students referred to the same facts.
2.4 Overarching survey design and sample characteristics
Figure 3 shows the final survey design of the INSIDE longitudinal study. The time delays due to post-recruitment and COVID-19-related school closures also resulted in various challenges and opportunities. For example, at the first wave, student competency measurements could not take place at the end of Grade 6 for both cohorts, as originally planned, but rather at the beginning of Grade 7 for the second cohort. The class context might have changed for some students due to this temporal shift, e.g., that a different classroom teacher was responsible for the class in Grade 7 or that students had left or joined the class. These and other differences should be considered in data use.
Figure 3: Final survey design of the INSIDE longitudinal study after adding the second cohort and including corona-related adjustments
A summary of the cases in the two cohorts is presented in Table 11: Considering the type of school and the support status of finally recruited students, hardly any students at the academic school track with SEN agreed to participate. Overall, most recruited students with SEN attended an integrated comprehensive school.
Table 11: Distribution of recruited students (absolute) by SEN and type of school for both cohorts
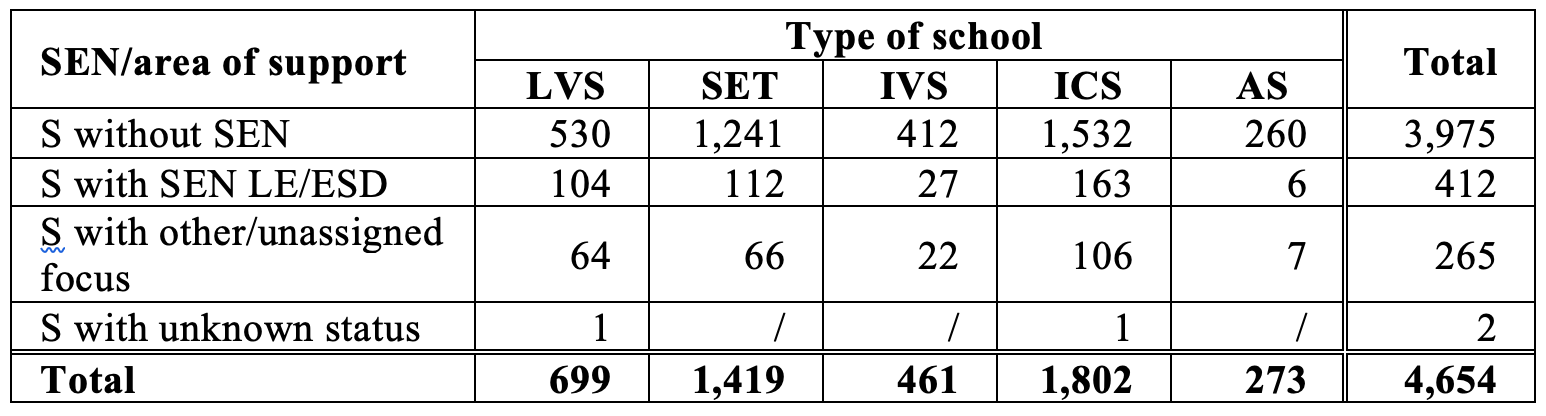
Note: LVS = low vocational school track, SET = school with several education tracks, IVS = intermediate vocational school track, ICS = integrated comprehensive school, AS = academic school track.
S = students, SEN = special educational needs, LE = learning, ESD = emotional and social development.
3. Changes in sample sizes between the first wave and the second wave
3.1 Sample development of the first and second cohorts at school level
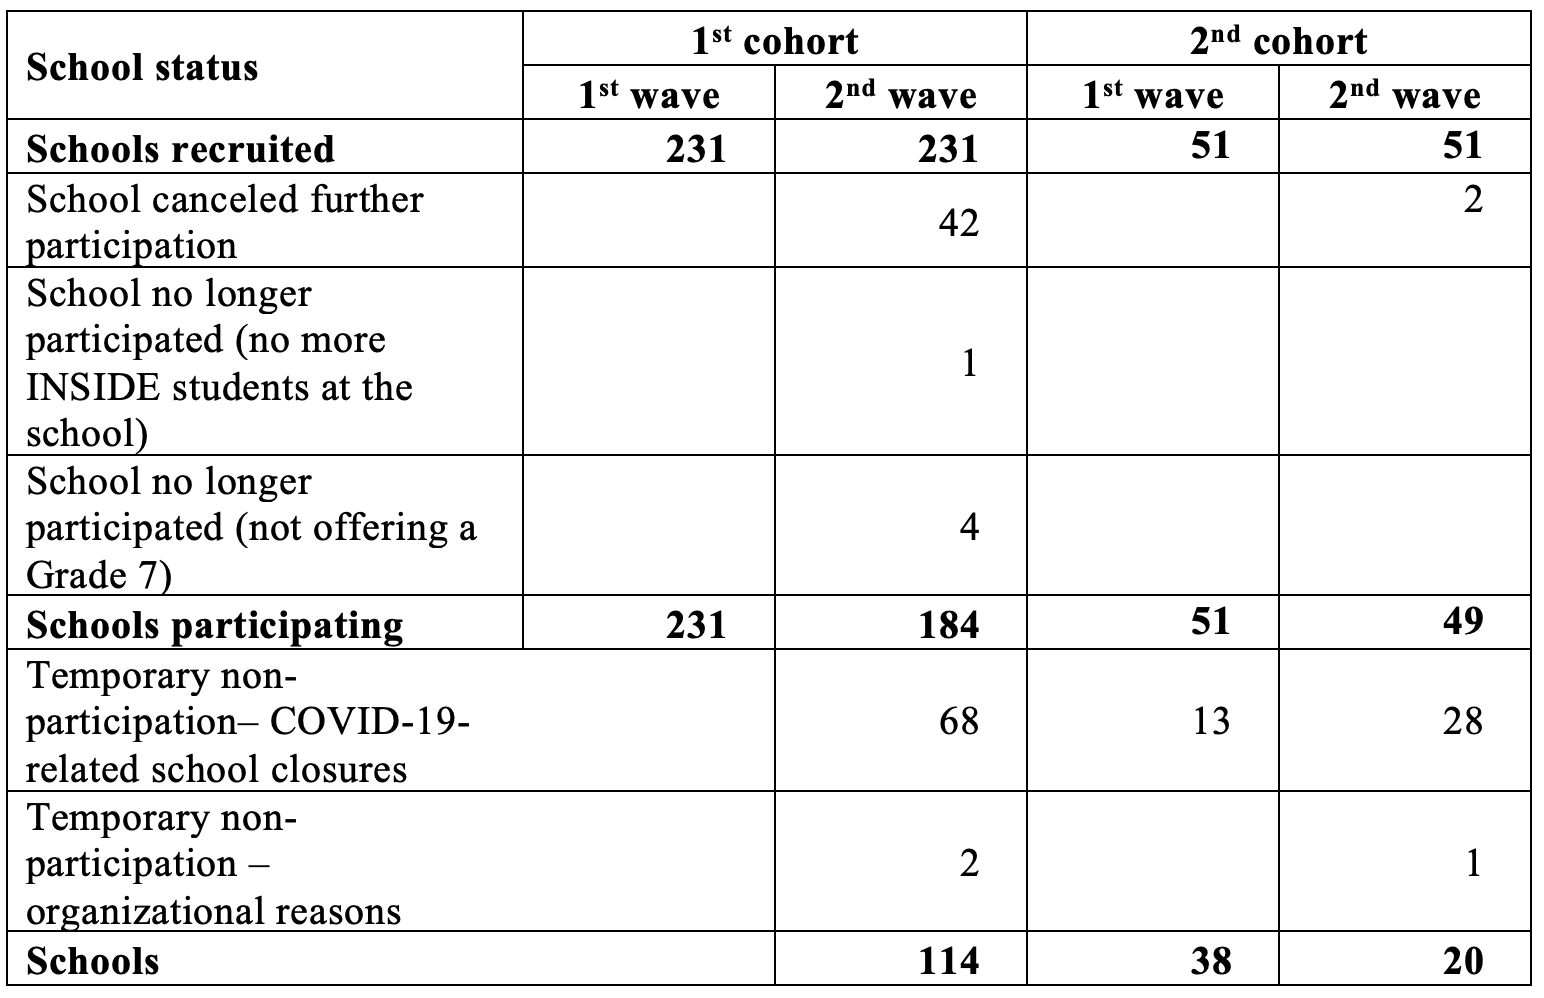
The first wave in Grade 6 of the first cohort took place in 2019 and thus before the first COVID-19-related school closures. Due to the panel design, all 231 schools in the first wave, in principle, made up the operational sample for the second wave in Grade 7. However, during the preparation of this second wave, 42 schools canceled their participation; four schools reported that they were not offering a Grade 7, and at one school, all students participating in INSIDE had left the school. These left 184 eligible schools from the first cohort for the second wave. Furthermore, 68 schools requested that the survey be suspended due to COVID-19-related school closures, and two additional schools requested that the second survey be suspended for organizational reasons. Thus, 70 schools from the still-available school panel of the first cohort did not participate in the second wave. They were considered temporary non-participation (for further waves in Grades 9 and 10 in the second funding phase).
The survey of the second cohort, which was originally scheduled to begin with the first wave in 2020 with 51 schools, also could not be conducted as planned: Due to COVID-19-related school closures, 13 of the 51 schools in the second cohort that were originally recruited postponed their participation (temporary school cancellations). Thus, a total of 38 schools participated in the survey. Due to the panel design, all 51 schools were invited to participate again in the second wave of the second cohort in Grade 7 in spring 2021. However, two schools canceled their participation. Furthermore, 28 schools were again unable to participate in the second wave due to COVID-19-related school closures, and one additional school suspended participation for organizational reasons. In conclusion, 20 schools of the second cohort participated in the second wave. Table 12 provides an overview of the school status in the first and second cohorts over time.
Table 12: Sample development of the first and second cohorts at school level
3.2 Changes in the sample composition between the first and second wave at student level (cohort I and II)
For cohort I, 3,899 students had submitted consent forms from their parents to participate in the INSIDE study. Of these 3,899 students, 34 revoked their willingness to participate by the second wave. Three students were subsequently included in the net sample because their initially incomplete consent forms were completed. Thus, in principle, 3,868 students were available for the second wave in Grade 7. Of these students, however, 947 could no longer be tested and interviewed in the school context either because they had left school, their school no longer participated in INSIDE, or their grade was no longer available at the school. To enable these students to continue participating, they were followed individually in the INSIDE study from then onwards (individual field). Another 1,260 students could not participate in the second wave due to temporary school cancellations caused by COVID-19-related school closures (including various quarantine situations in the fall of 2020)[2]. Thus, 1,661 students in the first cohort were available for the school surveys as part of the second wave in Grade 7.
Of the 755 recruited students of the second cohort, 181 students could not be reached in the first wave due to temporary school cancellations. Thus, a total of 574 students participated in the first wave. Three students revoked their willingness to participate by the second wave. Thus, in principle, 752 students were available for the second wave in Grade 7. 46 of these students could no longer be tested and interviewed in the school context because they had left school or their school no longer participated in the INSIDE longitudinal study. These students were followed individually from then onwards. Another 407 students could not participate in the second wave due to temporary school cancellations. Thus, 299 students in the second cohort were available for the school surveys during the second wave. Table 13 provides an overview of the students’ status in the first and second cohorts over the two waves.
Table 13: Sample development of the first and second cohorts at student level
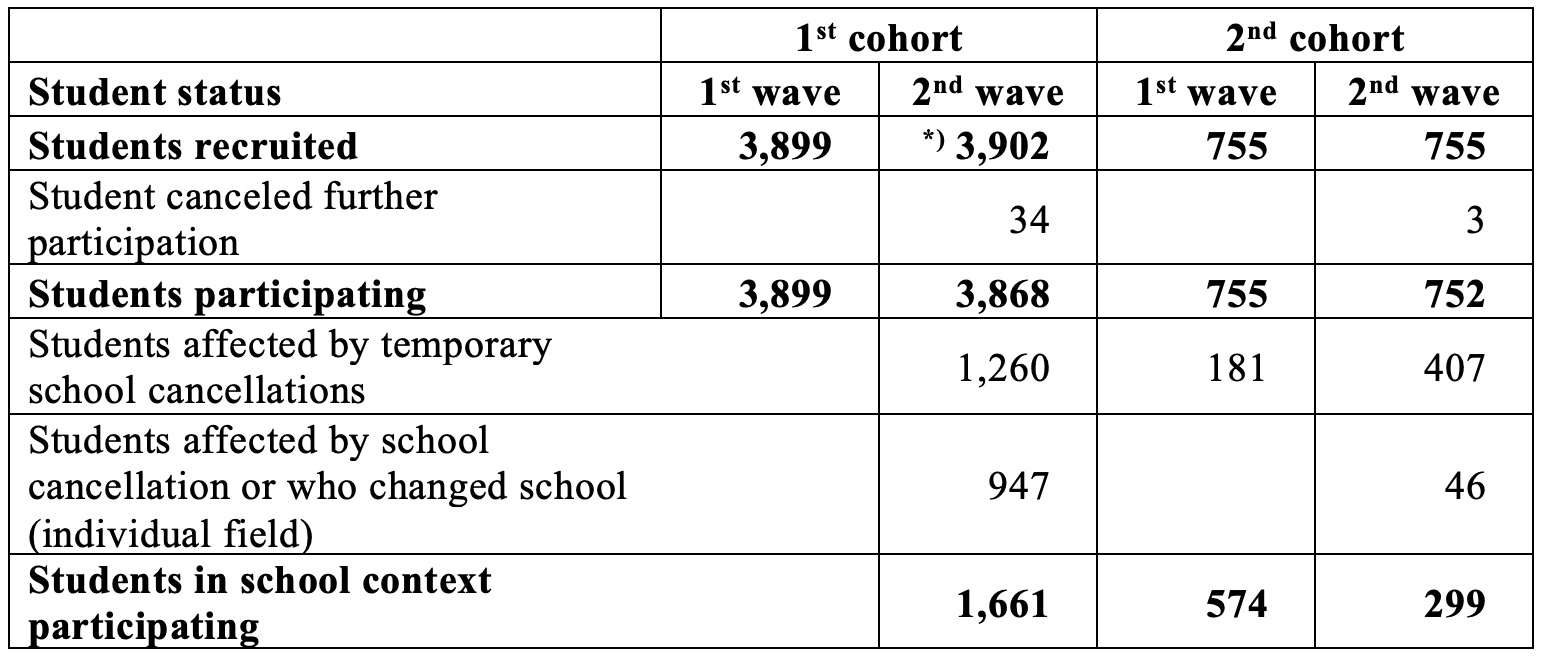
*) The sample of students was expanded by n = 3 students for whom valid consent forms could be obtained in the meantime.
4. Summary
This article explained the sampling procedure of the nationwide longitudinal INSIDE study to answer a database in Germany can be created that enables research on the implementation and consequences of inclusive education and what recommendations can be derived for future research, considering (1) the varying preconditions in the federal states and (2) the different understandings of inclusive education.
To meet the different understandings of inclusive education, we drew the sample focusing on schools with SEN students. Then we invited all students in the 6th grade to participate in the study. This approach allows for analyzing different heterogeneity criteria, like gender, low achievers, or students with immigrant or different socioeconomic backgrounds.
However, the sampling process was complex for two reasons. First, due to the fundamental challenge that there is no nationwide list of inclusive schools. Hence, when schools were invited to participate in the study, it was not guaranteed that they actually taught students with and without SEN (in the area of “learning” and/or “emotional and social development”). In order to meet this challenge, a sampling procedure with multiple steps was chosen in which, in the first step, only schools that met this criterion with a high probability were identified using preliminary information. In a second step, when obtaining consent, the schools were asked to indicate the number of SEN students in the area of “learning” and/or “emotional development” taught in Grade 6. During this verification in the second step, despite the efforts made, a considerable number of schools reported that they did not teach SEN students in Grade 6. Thus, preliminary identification with subsequent verification is strongly recommended. For preliminary identification, official data from the school statistics were used. Although these data could be partially used to determine the gross sample, they only provided reliable and robust information to a limited extent. It is therefore recommended to use other sources of information whenever possible. After consent, the schools were, in a third step, again asked to provide class-specific information on the number of SEN children. Again, schools indicated that no students were taught in the areas in question, although this was reported in the previous step. Therefore, it is recommended that the information be requested as up-to-date as possible or rechecked for the school year in question, as there are always changes in this population at the beginning of and during a school year.
The second reason the sampling process was challenging was to recruit sufficient schools, parents, and students for participation. In total, 231 schools with an average of three sixth-grade classes and 3,899 students participated in the survey of the first cohort in the first wave from May to July 2019. This sample included 519 SEN students, 337 with special educational needs in “learning” and/or “emotional and social development.” Thus, the targeted sample sizes (net samples) were not reached despite the aforementioned measures. This was, on the one hand, due to the below-average willingness on school-level to participate. Many schools were only willing to participate if they taught many SEN students and not, as it often corresponded to most schools’ school reality if a few SEN students attended the school. On the other hand, the individual-level willingness to participate was also below average. Inquiries about reasons for agreeing or refusing to participate in INSIDE revealed that this argument was also frequently cited by parents as a reason for not participating in the study with their children without SEN. Accordingly, although schools were generally willing to participate in INSIDE, the parents did not agree to participate. Aside from the fact that many schools were misidentified in the multistage process, the low participation rates illustrate the importance of recommending that a very large gross sample of schools be defined to compensate for dropouts at both levels. The offer of incentives at the school level resulted in a higher willingness to participate in the states where incentives were approved, which is why using incentives can be recommended. However, this is only a descriptive finding.
Due to the insufficient net sample of schools and students, there was a need to adjust the study design, and additional schools (new schools and schools that had already agreed to participate) and students were recruited for a second cohort, starting at grade 6 one year later. Of the 51 schools that agreed to join the second cohort, 35 also participated in the surveys as part of the first cohort. Thus, approaching schools already willing to participate again can be considered successful and recommended. The willingness to participate at the student level was lower than in the first recruitment phase, at just under 16 %. However, this can be explained mainly by the lower participation rate of students without SEN. The influence of COVID-19-related school closures cannot be conclusively assessed. It is also unclear whether the feedback on the results and the new information material increased the willingness to participate.
Due to the COVID-19-related school closures starting in the spring of 2020, the study design had to be modified again. The competence test, the survey of the students, and the parent survey had to be postponed to the beginning of the next school year. On the one hand, these adjustments made it possible to achieve a sample size that allowed evaluations within the framework of the study, and it ensured that data collection could take place despite the school closures. On the other hand, this also resulted in different evaluation requirements and possibilities. The sample could be expanded by recruiting participants later, and data can be pooled for the analyses. However, the analyses should consider the effect of shifting the surveys of the second wave of the first cohort and the first wave of the second cohort to the following school year. On the one hand, this shift could have a potential age effect, and on the other hand, it could give rise to systematic content-related biases due to school closures. However, these potential biases also provide an opportunity to analyze the effects of COVID-19-related school closures.
Endnotes:
[1] This paper refers to the design of the first funding phase of the project. For the second funding phase, further surveys in grade 9 and grade 10 are/were planned.
[2] Some of these students received at least a questionnaire because the schools had initially agreed on a test date, but then this could not be realized again due to the second school closure.
References
- Göransson, K., & Nilholm, C. (2014). Conceptual diversities and empirical shortcomings – A critical analysis of research on inclusive education. European Journal of Special Needs Education, 29, 265–280.
- Gresch, C./Schmitt, M./Külker, L./Schledjewski, J./Grosche, M./Böhme K. (2021). “Schulische Ausgangslagen und organisatorische Gestaltungsformen von Inklusion in der Sekundarstufe I“, Zeitschrift für Heilpädagogik 72(10) pp. 484-507.
- Gresch, C./Piezunka, A./Solga, H. (2014). “Realisierbarkeit einer Ergänzungsstichprobe von Integrationsschülerinnen und -schülern im Rahmen des Nationalen Bildungspanels (NEPS): Möglichkeiten und Perspektiven“, unter Mitarbeit von J. M. Blanck (NEPS Working Paper No. 37). Bamberg: Leibniz-Institut für Bildungsverläufe, Nationales Bildungspanel.
- KMK – Sekretariat der Kultusministerkonferenz (2018). Statistische Veröffentlichungen der Kultusministerkonferenz. Dokumentation Nr. 214 – Juni 2018: Sonderpädagogische Förderung in Schulen 2007 bis 2016.
- Malecki, A. (2013). “Sonderpädagogische Förderung in Deutschland – eine Analyse der Datenlage in der Schulstatistik“, Wirtschaft und Statistik 5 pp. 356-365.
- Piezunka, A./Gresch, C./Sälzer, C./Kroth, A. (2016). “Identifizierung von Schülerinnen und Schülern nach Vorgaben der UN-BRK in bundesweiten Erhebungen: Sonderpädagogischer Förderbedarf, sonderpädagogische Förderung oder besondere Unterstützung?“, Zeitschrift für Pädagogik (62) pp. 190-211.
- Schmitt, M./Roßbach, H. G./Gresch, C./Stanat, P./Böhme, K./Grosche, M. (2020). Inklusion in der Sekundarstufe I in Deutschland (INSIDE). Erziehungswissenschaft [Rubrik: Forschungsnotiz], 60(31) pp. 199–202. https://www.budrich-journals.de/index.php/ew/article/view/35870; DOI: 10.3224/ezw.v31i1.30
- Statistisches Bundesamt (2017). Fachserie 11/ Reihe 1: Bildung und Kultur – Allgemein bildende Schulen Schuljahr 2016/17. Wiesbaden.
-
Keywords
calibration CATI coverage coverage bias cross-national surveys data linkage data quality European Social Survey experiment face-to-face face-to-face survey Facebook hard to reach populations incentives item nonresponse measurement measurement error mixed-mode surveys multitasking non-probability samples Nonresponse nonresponse bias nonresponse rates paradata PIAAC Probability sample probability samples QR codes rare populations response rate Satisficing social desirability Social media survey survey-taking climate survey data survey management survey methods Telephone survey telephone surveys total survey error unit nonresponse validity web survey Web surveys weighting
