

Review of Food Diaries Used to Collect Food Acquisition Data
Yan T. & Machado, J. (2023). Review of Food Diaries Used to Collect Food Acquisition Data. Survey Methods: Insights from the Field, Special issue: ‘Food Acquisition Research and Methods’. Retrieved from https://surveyinsights.org/?p=17458
© the authors 2023. This work is licensed under a Creative Commons Attribution 4.0 International License (CC BY 4.0) 
Abstract
Food data are important for policymakers and researchers to understand food acquisition and expenditure, nutrition, food environments, food assistance, and so on. However, the collection of food data by asking people to recall their food acquisition is challenging for respondents sampled from a general population due to faulty memory, the burden associated with responding in a timely manner, and lack of knowledge. To improve recall and reduce reporting error, survey organizations may provide a diary for respondents to record foods obtained during the study period as they get them. This paper reviews three types of food diaries used in existing surveys to collect food data: paper diaries, web diaries, and app diaries. We review the differences of these diaries and the implications of these differences on survey estimates from a Total Survey Error perspective. In particular, we examine how features of each type of diary contributes to coverage, nonresponse, measurement, and post-survey processing, and cost of creating the diary. We conclude the paper with practical recommendations on how to choose a diary and how to improve the error properties of the chosen diary.
Keywords
app diary, coverage, measurement, Nonresponse, paper diary, post-survey processing, web diary
Copyright
© the authors 2023. This work is licensed under a Creative Commons Attribution 4.0 International License (CC BY 4.0)
Introduction
Policymakers and researchers rely on food data to fully understand food acquisition and expenditure, nutrition, food environments, food assistance, and so on. Besides administrative data collected by government agencies and commercial data, surveys are commonly used to collect food data directly from the target population (Wilde, 2022). Surveys are administered to sampled households or persons, asking them to recall and self-report food or drink items they have acquired or consumed. However, the collection of food data via recall is challenging for several reasons. First, food acquisition events such as a trip to a grocery store are more mundane and less salient than the purchase of a car or a house for most people, for instance. As a result, people simply do not always remember what they bought and how much they paid for them during a particular grocery trip. Second, we suspect that people may not always pay attention to the size, amount, quantity, and nutrition value of the food or drink items to encode these pieces of information in memory. For example, people may remember that they had a breakfast but not remember whether it was a continental breakfast (see Tourangeau, Rips, and Rasinski, 2000). Third, usability and cognitive tests we have conducted show that respondents may not know how to report these pieces of information in a survey even if they have encoded the information. Therefore, studies collecting food data tend to rely on the use of a diary for people to record food or drinks obtained as they get them, instead of relying on recall.
Three types of diaries are commonly used in surveys to collect food data: paper diary, web diary, and app diary. They differ from each other in important domains. For instance, they differ in terms of the technology and equipment required to complete the diary, mode of data entry, skill sets required of respondents to complete the diary, perceptions of data security, and confidentiality and privacy concerns with the diary, to name just a few. These differences have vital implications on the quality of the resulting estimates under the Total Survey Error (TSE) paradigm (Groves, 1989; Biemer and Lyberg, 2003). We review these three types of diaries, focusing on how the unique features of each type of diary contributes to coverage, nonresponse, measurement, and post-survey processing, and cost of creating the diary.
Paper Diary
Coverage. Paper diaries are paper-and-pencil diaries and booklets that are provided to potential respondents to record food acquisition. Respondents do not need any special equipment to fill out a paper diary; all they need is a pen or pencil. As a result, paper diaries have almost perfect coverage if the target population is the general population. The only population subgroup that is excluded from the use of a paper diary are those who are illiterate or have a disability that makes reading and responding impossible. About 8% of adults aged 16 to 65 are functionally illiterate (U.S. Department of Education, 2019) and would be under covered by studies using a paper diary.
Nonresponse. On top of the usual factors contributing to survey nonresponse (e.g., too busy, not interested, distrust of government, and so on), the barrier to sampled persons’ likelihood to participate in a survey using a paper diary comes from the perceived burden of the task of filling out the paper diary. Respondents will be less likely to participate in a diary study if they think the paper diary requires too much of their time and effort. Take the Consumer Expenditure Diary Survey (CED) as an example (Bureau of Labor Statistics, 2022). CED is an independent survey designed to collect expenditure data on small and frequently purchased items that are considered to be difficult to recall. Once a household is recruited, the interviewer leaves a household a paper diary for them to record all expenditures incurred for a week. At the end of the first week, the interviewer comes back to pick up the diary and leaves a second diary for respondents to use for another week. In other words, two one-week diaries are placed with every recruited household. Response rate to the CED was about 75% in 2010 but dropped to 37% in quarter four of 2020 (Bureau of Labor Statistics, 2021).
Even after respondents have agreed to participate in the study, they may not always fill out the paper diary. For example, the first National Study of Food Acquisition (FoodAPS-1) asked respondents to record all food or drink items obtained for seven days on two versions of paper diaries (Economic Research Service (ERS), U.S. Department of Agriculture (USDA)). Red Pages are for food-away-from-home (FAFH) items whereas Blue Pages are used for food-at-home (FAH) items. About 5% of households never filled out either version of the food books and another 14% of households filled out only one version (ERS, USDA, 2013a).
Measurement. People can write anything in any way on a paper diary as real-time validation of responses is not possible. The free-form entry leads to spelling errors, unstandardized entries, incorrect entries, inconsistent values, out-of-range values, and so on. In addition, people can decide to not write anything or to skip a check box, leading to missing data. FoodAPS-1 found that item size and amount information was missing for 67% of FAFH items (ERS, USDA, 2013b), information on item prices, savings, and coupons was missing for 21% of FAH items (ERS, USDA, 2013c), and food place address was missing for 5% of FAH events (ERS, USDA, 2013c).
A limitation of a paper diary is the lack of process information to assess response behavior and data quality. For instance, researchers typically do not know who filled out the paper diary and when a paper diary was filled out. As a result, researchers can only take at face value the answers entered to the paper diary without additional information on the quality of the data.
Post-survey Processing. The free-form data entry as well as lack of cues and validation of the paper diary leads to costly and time-consuming post-survey processing of data from paper diaries. First, data from paper diaries have to be manually entered or scanned into a database before they can be used for analyses. Then the entered data have to be checked for completeness and edited for accuracy. In FoodAPS-1, post-survey processing involved removing duplicate food items entered on both Red Pages and Blue Pages, correcting spelling and standardizing spelling for food place name, address, and item description, correcting erroneous input (e.g., reporting quantity in the box for size and amount), and moving food items reported to the wrong diary (e.g., FAFH items were reported on Blue Pages), to name just a few examples (ERS, USDA, 2013a). CED showed that about 10% of reported expenditures were edited during 2010 to 2020 (Bureau of Labor Statistics, 2021). This extensive post-survey processing also increases the time it takes to obtain and publish the study’s findings after data collection ends.
Cost. Although the front-end process of creating and printing paper diaries may not be costly, the cost associated with manual data entry, data review, and data editing may increase the overall cost of studies using a paper diary.
Web Dairy
Coverage. Web diaries are browser-based diaries that can be accessed via a URL from any type of device (such as personal computers, smartphones, and tablets). Respondents will need a device and, more importantly, internet access to access a web diary. Among all households in the United States in 2018, 92% of them had at least one type of computer and 85% of them had a broadband Internet subscription (Census Bureau, 2021). In other words, assuming households do not go to a facility with internet connectivity such as a public library or coffee shop to respond, at least 15% of households would be under covered by a survey using a web diary. Digital divide – differences between people with internet access and people without internet access – are diminishing but still persists. Rural households, households with low income, and households with low education are less likely to have internet access and a computer (Census Bureau, 2021). As a result, a web diary has worse coverage of the general population than a paper diary.
Nonresponse. One additional factor contributing to nonresponse in surveys using a web diary is unfamiliarity with technology and equipment required to complete the web diary. Respondents who are not comfortable using a computer or a smartphone are probably less likely to participate in a survey using a web diary, and are less likely to use the web diary. A large-scale feasibility study conducted by CED invited participants to complete a web diary for 14 days (Krishnamurty, Kopp, and Jones, 2022). The overall response rate to the feasibility study was 47%. Furthermore, among the 445 participants who agreed to participate in the study and were shown how to access the web diary, 9% of them never attempted to log into the web diary and another 3% of them never successfully logged in, further increasing nonresponse. FoodAPS’ Alternative Data Collection Method Pilot (FoodAPS-ADCM) showed that participants aged 65 or more, participants with low education, and participants with low income were less likely to use the web diary than those aged 18 to 64, those with high education, and those with high income (Yan, Machado, Heller, Bonilla, Maitland, and Kirlin, 2017a).
In addition, specific protocols to get participants to use a web diary also play a role in nonresponse to the uptake of web diaries. UK Understanding Society Innovation Panel Spending Study II (Spending II) asked participants to first download an app and then offered a web diary to those who did not download the app (Jäckle, Wenz, Burton, and Couper, 2019). Participants recruited from a nonprobability online panel were invited to use a web diary immediately after they declined to use the app; 47% of those offered the web diary logged in at least once (Jäckle, Wenz, et al., 2019). By contrast, participants recruited from the Innovation Panel were sent several email reminders to download the app before being invited to the web diary through a letter. Only 3% of those invited used the web diary at least once (Jäckle, Wenz, et al., 2019).
Measurement. Web diaries take advantage of computerization to build in functionalities that could lead to better measurement and reduced respondent burden. For instance, it is easy to build in validation checks to catch, in real time, inconsistent values and out-of-range values. Another functionality to improve measurement is exemplified by the type-ahead feature utilized in FoodAPS-ADCM. The type-ahead feature offers suggestions of food places through Google Search based on the detected IP (Yan, Machado, Heller, Bonilla, Maitland, and Kirlin, 2017b). For instance, as a participant types “Mc,” a list of McDonald’s close to the participant are offered for them to choose from, which transforms the task of recalling a food place name and address to an easier task of recognition. In addition to simplifying the reporting task, the type-ahead yields accurate and standardized entry of food place names and addresses for 82% of grocery stores, 83% of restaurants and cafeterias, and 84% of club stores and superstores (Yan et al., 2017b). Similarly, look-up databases can be used at the backend of a web diary to simplify reporting tasks. FoodAPS-ADCM participants could enter a four-digit Produce Look Up (PLU) code typically found on fruits and vegetables to the web diary. The PLU code would then be matched in real time to a look-up database and, if matched, a standardized and accurate description of the food item would be returned to the respondent to validate (Yan et al., 2017b).
An important advantage of web diaries is the availability of rich paradata for researchers to use to better understand how the web diary is filled out. The CE large-scale feasibility study, for instance, showed that only 65% of respondents logged in the web diary for 5 or more days despite being asked to use the web diary for 14 days (Krishnamurty et al., 2022). Furthermore, respondents spent about five minutes each time they logged in (Krishnamurty et al., 2022).
Post-survey Processing. Web diaries eliminate the need to manually enter paper diary data to a database. They also reduce the need for extensive post-survey data processing due to the built-in functionalities to improve measurement. As shown earlier, the type-ahead feature using Google Search reduces the need to check and edit food place names and addresses for 82% of food acquisitions that occurred at a grocery store. As a result, web diaries can deliver the resulting diary data faster than paper diaries.
Cost. Even though it is expensive initially to build a web diary and to maintain the web diary site during the data collection period, the cost could be potentially offset by improved measurement and reduced post-survey processing.
App Diary
Coverage. An app diary is a native smartphone application that has to be downloaded and installed to a mobile device such as a smartphone or a tablet. In addition to internet access, people who do not have a smartphone or who have an older version of a smartphone are excluded from studies using an app diary. Although smartphone ownership has grown steadily in the past decades, 15% of Americans still do not have a smartphone in 2021 (Pew Research Center, 2021). In addition, smartphone ownership varies by demographic characteristics. Specifically, females, young people, people with high income, and people with a higher education are more likely to own a smartphone (Antoun et al., 2019; Couper et al., 2018; Jäckle, Burton, Couper, and Lessof, 2019; Keusch et al., 2020). The UK Understanding Society Innovation Panel Spending Study I (Spending I) invited panelists from the Innovation Panel to use an app diary to track their spending ( Jäckle, Burton, et al., 2019). A quarter of them were not covered because they did not have a smartphone (Jäckle, Burton, et al., 2019). When debriefing those panelists who reported having a smartphone but did not use the app diary, 54% of them mentioned at least one difficulty related to coverage – not having a smartphone or tablet that can download apps, insufficient storage space on their device to download the app, or the app not being compatible with their operating system (Jäckle, Burton, et al., 2019). Another 41.6% mentioned “lack of confidence”, either with using their mobile device for this kind of activity and/or with downloading apps (Jäckle, Burton, et al., 2019).
Nonresponse. Nonresponse to app diaries tends to be high, as shown through low participation rates, which are calculated as the ratio of the number of participants who used the app diary at least once and the number of participants invited to use the app diary. For instance, participation rates were 15% for Spending I (Jäckle, Burton, et al., 2019), 15% for Innovation Panel participants, and 14% for the nonprobability web panel participants in Spending II (Jäckle, Wenz, et al., 2019). The high nonresponse to the app diary is considered to be associated with unwillingness and inability to download and install the app, as well as unwillingness and inability to share and enable app features.
Measurement. The app dairy can take advantage of features of smartphones to further improve measurement. For instance, the app diary used for the FoodAPS-2 Field Test enables participants to use the phone camera to scan a barcode and to take a picture of food items (Page, 2022). The phone camera is also used to take pictures of receipts in several app diary studies (e.g., Spending I, Spending II, FoodAPS-2 Field Test). Electronic receipts stored on the phone can be uploaded to the app diary (e.g., FoodAPS-2 Field Test). The voice recorder and the phone microphone allow participants to provide speech input (e.g., Luo, 2022). Furthermore, an app diary enables passive collection of locations and movements through GPS and sensors (e.g., FoodAPS-2 Field Test). Interestingly, more participants chose to report spending through manual entry than using the receipt photo-taking and uploading option (Jäckle, Wenz, et al., 2019; Read, 2019). Regardless of which method participants used to report expenditure to the app diary, reported expenditure from the app diary was on par with benchmark expenditure estimates (Jäckle, 2020).
App diaries produce an even larger amount of paradata than the web diary. In addition to timing data, app diaries produce other types of paradata such as geolocation data on where people were when they used the app, and when and what push-notifications were sent, to name a couple examples. As an example using timing data from an app diary, Spending II showed that more than half of participants still used the app diary even 25 days later even though they did not use the app every day (Jäckle, Burton, et al., 2019)
Once an app diary is downloaded and installed, it can be used by a respondent to report a food event as it is occurred even when their mobile device is not connected to the internet. The reported information will be uploaded to the server when the mobile device is later connected to the internet again. This is an apparent advantage than a web diary that requires internet access in order for it to be used.
Post-survey processing. Similar to web diaries, diary data entered by respondents to the app diary do not require manual data entry and require less cleaning and editing than paper diaries, leading to a faster delivery of diary data. However, for other types of data (for instance, GPS data passively collected, electronic receipts downloaded to the app diary, and pictures of food items uploaded to the app), it is a costly endeavor to extract, clean, and process them to make them ready for analysis.
Cost. The cost of programming an app diary and maintaining the app diary is even higher than building a web diary. In addition, processing passively collected data and other types of data (such as images) could add to the cost of studies using an app diary.
Conclusions and Discussion
This paper reviewed three types of diaries used in surveys to collect food data. Table 1 summarizes the relative advantages and weaknesses of each type of diary with respect to component survey errors under the Total Survey Error paradigm. It is clear from Table 1 that no diary is perfect; they all have pros and cons. Paper diaries are inexpensive and easier to create and have great coverage of the general population, but they do not have good measurement properties in some respects and need extensive post-survey processing. By contrast, web diaries have worse coverage than paper diaries of the general population, but they have apparent advantages of improved measurement and reduced need for post-survey data collection. App diaries offer even more advantages in measurement at the expense of worse coverage and increased development cost. Passively collected data have the potential to reduce reporting burden and produce richer information, but processing of passively collected data is costly and time-consuming.
Table 1. Comparison of Diaries Used to Collect Food Data
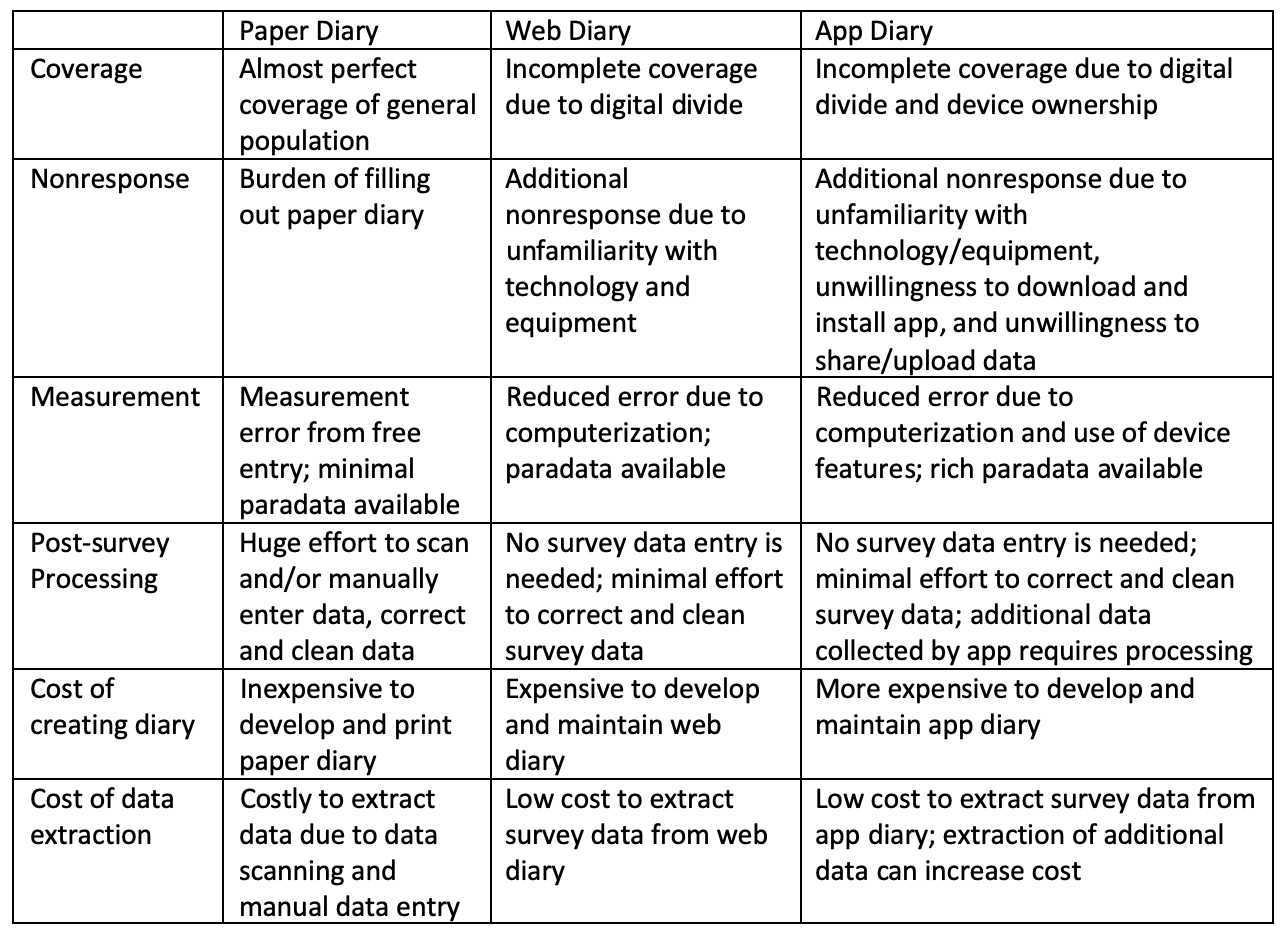
We discourage readers from using Table 1 as evidence to credit or discredit any study using any type of diary. There is no one-size-fits-all recommendation when it comes to deciding which type of diary to use for a particular study. Instead, we strongly recommend researchers and survey practitioners use Table 1 as a guide to carefully consider pros and cons of each diary type and to make an informed decision on which diary is the best for their particular study given the study’s target population, measurement requirements, budget, timeline, and resources. For example, a paper diary is a great choice for a study asking a sample of older respondents to record food expenditure for one day. Similarly, an app diary is a suitable choice for a study asking college students to take pictures of what they consume each day.
We also encourage researchers and practitioners to consider a multi-diary approach, based on best practices and lessons learned from multimode surveys literature. For instance, FoodAPS-ADCM made its web diary accessible through a URL and through an app (Yan, et al., 2017b). FoodAPS Field Test and Spending II adopted a sequential approach that first offered everyone an app diary, and then offered a web diary to those who declined to use the app diary (Jäckle, Wenz, et al., 2019; Page, 2022). Results from Spending II showed that offering two types of diaries reduced participation bias due to coverage and nonresponse (Jäckle, Wenz, et al., 2019).
Regardless of which type of diary is selected, researchers and practitioners should continue to conduct research on ways to reduce errors and to improve the quality of resulting estimates. To reduce coverage error associated with the use of a web diary or an app diary, studies can provide devices and internet access to those who do not have them. For instance, smartphones were provided to 39% of households, who would otherwise be excluded from FoodAPS-ADCM (Yan et al., 2017b). To encourage participation in diary studies, researchers should consider reducing the burden of using diaries and one way to do so is to reduce the number of days in which people are asked to use the diary. Similarly, to improve measurement, tough trade-off decisions have to be made when deciding what information to be collected through a diary. For instance, instead of asking participants to report item size and amount information for all food items acquired, they could be asked to provide a receipt and report item size and amount for selected food items. To further reduce the need for post-survey processing, researchers and practitioners should continue to explore alternative data sources to aid data collection.
We mentioned earlier and want to reiterate here that all decisions involve trade-offs and have implications on other aspects of data. For instance, the decision to reduce the number of diary days as an attempt to improve the diary completion rate may necessitate the need for a larger sample size and/or a longer field period in order to ensure the capture of less frequent behaviors or behaviors affected by different days of week or even different seasons of year.
By no means do we pretend that this review is exhaustive. Instead, we hope to use this paper to call for more empirical research to quantify the overall impact of using one type of diary (versus other types of diaries) on the resulting estimates as well as the magnitude of component errors. We further encourage researchers to explore how to best design diaries to improve their usability. Literature is scarce on best practices for diary design, especially for app diary designed to collect survey data. We believe that general principles of questionnaire design (Tourangeau et al., 2000; Bradburn, Sudman, and Wansink, 2004) and for mobile questionnaire design (Antoun, Katz, Argueta, and Wang, 2018) apply when designing a diary. A book is forthcoming on using apps, wearables, and sensors for data collection (Keusch, Struminskaya, Eckman, and Guyer, forthcoming), which would contribute to the literature on designing an app diary.
References
- Antoun, C., Conrad, F. G., Couper, M. P., and West, B. T. (2019). Simultaneous estimation of multiple sources of error in a smartphone-based survey. Journal of Survey Statistics and Methodology, 7, 93-117. doi:10.1093/jssam/smy002
- Antoun, C., Katz, J., Argueta, J., and Wang, L. (2018). Design heuristics for effective smartphone questionnaires. Social Science Computer Review, 36, 557-574.
- Bradburn, N., Sudman, S., and Wansink, B. (2004). Asking Questions: The Definitive Guide to Questionnaire Design — For Market Research, Political Polls, and Social and Health Questionnaires (Research Methods for the Social Sciences). Wiley and sons.
- Biemer, P. P., and Lyberg, L. E. (2003). Introduction to Survey Quality. Wiley and Sons.
- Bureau of Labor Statistics (2021). The Annual CE Data Quality Profile – 2020. Consumer Expenditure Surveys Program Report Series.
- Bureau of Labor Statistics (2022). Consumer Expenditures and Income: Overview. Accessed at: https://www.bls.gov/opub/hom/cex/home.htm.
- Census Bureau (2021). Computer and Internet Use in the United States, 2018. Accessed at https://www.census.gov/library/publications/2021/acs/acs-49.html.
- Couper, M. P., Gremel, G., Axinn, W. G., Guyer, H., Wagner, J., and West, B. T. (2018). New options for national population surveys: The implications of internet and smartphone coverage. Social Science Research, 73, 221-235. doi:10.1016/j.ssresearch.2018.03.008.
- Economic Research Service (ERS), U.S. Department of Agriculture (USDA) (2013a). National Food Study (FoodAPS): End of Survey Memorandum.
- Economic Research Service (ERS), U.S. Department of Agriculture (USDA) (2013b). National Food Study (FoodAPS): FAFH Item File.
- Economic Research Service (ERS), U.S. Department of Agriculture (USDA) (2013c). National Food Study (FoodAPS): FAH Events (Blue Pages) File and Data Quality.
- Economic Research Service (ERS), U.S. Department of Agriculture (USDA). National Household Food Acquisition and Purchase Survey (FoodAPS). Accessed at https://www.ers.usda.gov/foodaps.
- Groves, R. M. (1989). Survey Errors and Survey Costs. Wiley and sons.
- Jäckle, A. (2020). Using Mobile Apps for Data Collection: 10 Things We’ve Learnt from Experimental Testing on the Understanding Society Innovation Panel. Keynote speech at CIPHER 2020 Conference. Washington, DC. February 26, 2020.
- Jäckle, A., Wenz, A., Burton, J., and Couper, M. P. (2019). Increasing participation in a mobile app study: The effects of a sequential mixed-mode design and in-interview invitation (Understanding Society Working Paper, 2019-04). University of Essex.
- Jäckle, A., Burton, J., Couper, M. and Lessof, C. (2019). Participation in a mobile app survey to collect expenditure data as part of a large-scale probability household panel: Coverage and participation rates and biases, Survey Research Methods, 13, 23-44. doi:10.18148/srm/2019.v1i1.7297.
- Keusch, F., Bähr, S., Haas, G., Kreuter, F., and Trappmann, M. (2020). Coverage error in data collection combining mobile surveys with passive measurement using apps: Data from a German National Survey. Sociological Methods & Research. doi: 10.1177/004912412091492.
- Keusch, F., Struminskaya, B., Eckman, S., and Guyer, H. (forthcoming). Data Collection with Wearables, Apps, and Sensors. Chapman & hall/CRC Data Science Series.
- Krishnamurty, P., Kopp, B., and Jones, G. (2022). Using Online Diary Paradata to Evaluate Diary Design and Usability. Paper presented at the Joint Statistical Meeting. Washington, DC., August 8, 2022.
- Luo, Y. (2022). FoodScrap: Capturing Everyday Food Practice Through Speech Input. Paper presented at the International Food Acquisition Research and Methods (iFARM) Workshop. College Park, MD. October 20-21, 2022.
- Page, E. A. (2022). An Overview of Survey Development Activities for the Second National Food Acquisition and Purchase Survey (FoodAPS-2). Paper presented at the International Food Acquisition Research and Methods (iFARM) Workshop. College Park, MD. October 20-21, 2022.
- Pew Research Center. (2021). Mobile Fact Sheet. Accessed at https://www.pewresearch.org/internet/fact-sheet/mobile/
- Read, B. (2019). Respondent burden in a mobile app: evidence from a shopping receipt scanning study. Survey Research Methods, 13(1):45-71.
- Tourangeau, R., Rips, L. J., and Rasinski, K. (2000). The Psychology of Survey Response. Cambridge, England: Cambridge University Press.
- U.S. Department of Education. (2019). Adult Literacy in the United States. NCES 2019-179. Data Point. Accessed at https://nces.ed.gov/pubs2019/2019179/index.asp
- Wilde, P. (2022). That is Good to Know: The Policy Setting for Food Acquisition Research and Methods. Keynote Speech at International Food Acquisition Research and Methods (iFARM) Workshop. College Park, MD. October 20-21, 2022.
- Yan, T., Machado, J., Heller, A., Bonilla, E., Maitland, A., and Kirlin, J. (2017a). Gamifying Incentives: A Case Study. Paper presented at the annual conference of American Association for Public Opinion Research. New Orleans, LA, May 2017.
- Yan, T., Machado, J., Heller, A., Bonilla, E., Maitland, A., and Kirlin, J. (2017b) .The Feasibility of Using Smartphones to Record Food Purchase and Acquisition. Paper presented at the annual conference of American Association for Public Opinion Research. New Orleans, LA, May 2017.
-
Keywords
calibration CATI coverage coverage bias cross-national surveys data linkage data quality European Social Survey experiment face-to-face face-to-face survey Facebook hard to reach populations incentives item nonresponse measurement measurement error mixed-mode surveys multitasking non-probability samples Nonresponse nonresponse bias nonresponse rates paradata PIAAC Probability sample probability samples QR codes rare populations response rate Satisficing social desirability Social media survey survey-taking climate survey data survey management survey methods Telephone survey telephone surveys total survey error unit nonresponse validity web survey Web surveys weighting
