

Secondary Activities: Their Proximity to Primary Activities and Their Importance for Understanding Reports of Preparing and Consuming Meals
Rinderknecht, R.G., Doan, L. & Sayer, L.C. (2023). Secondary Activities: Their Proximity to Primary Activities and Their Importance for Understanding Reports of Preparing and Consuming Meals. Survey Methods: Insights from the Field, Special issue: ‘Food Acquisition Research and Methods’. Retrieved from https://surveyinsights.org/?p=17465
© the authors 2023. This work is licensed under a Creative Commons Attribution 4.0 International License (CC BY 4.0) 
Abstract
Time spent preparing and consuming meals is tracked closely by the USDA, and a growing literature shows how such time use relates to health and other important outcomes. Research has yet to consider the importance of assessing the relative sequencing of such production and consumption, potentially leading to inaccurate interpretations. We investigate this possibility and find that nearly a third of meal preparation episodes are not followed by eating and drinking. These patterns are consistent with responses in representative U.S. diary data. Further analysis using secondary activity measures reveals that respondents are at times reporting eating and drinking during or after meal preparation. We conclude by analyzing the demographic backgrounds of those who most typically report meal preparation and consumption in expected versus unexpected ways as a lens into group differences in how people conceive of meal preparation and consumption. Overall, our research highlights the importance of considering the sequencing of activities in time-use research and the value of collecting detailed secondary activity measures.
Keywords
data quality, meal preparation and consumption, secondary activities, time diaries, Web surveys
Acknowledgement
This research was supported by a National Science Foundation Doctoral Dissertation Improvement Grant (SES- 1904061) to the first two authors and a Dean's Research Initiative Dissertation Grant provided by the University of Maryland College of Behavioral & Social Sciences to the first author. Findings, opinions, and conclusions are those of the authors and do not necessarily reflect the views of the funders.
Copyright
© the authors 2023. This work is licensed under a Creative Commons Attribution 4.0 International License (CC BY 4.0)
Introduction
Researchers focus on time spent preparing and eating meals to better understand a range of outcomes, especially health related outcomes. This is typically achieved by utilizing time-diary data (e.g., Beatty et al. 2014; Kolodinsky and Goldstein 2011; Tajeu and Sen 2017; Zeballos and Restrepo 2018). Although time diaries have many strengths (Juster, Ono, and Stafford 2003), we demonstrate two unexplored challenges arising from this approach that may affect estimates of time spent preparing and eating meals. The first challenge is what we refer to as “colloquial double barreling.” Respondents complete a time diary by reporting each activity they engaged in sequentially over a previous 24-hour period. A double-barreled response in this context refers to reporting two separate, sequential activities in a single episode. Online diaries can utilize programmatic methods for detecting such behavior, such as by watching for “and” in a respondent’s verbatim response (Rinderknecht, Doan, and Sayer 2022). However, respondents’ statements such as “made lunch” technically means only meal preparation, yet more informally this phrase may refer to both making and eating lunch. Such responses, therefore, would overestimate time spent in meal preparation and underestimate time spent eating and drinking. The second challenge facing time diaries is that many activities are perceived as too inconsequential by respondents to be reported as their own episode. An alternative explanation for why “ate lunch” may not follow “made lunch” is that making lunch may have been perceived as a primary activity while eating lunch may occur during a subsequent activity perceived as more important than eating/drinking, such as watching television or commuting. If such “secondary” eating is not accounted for, such reporting would produce accurate measures of meal preparation but undercount time spent eating and drinking. We assess the potential extent of these problems by utilizing the detailed secondary activity measures in our diary data and, where possible, compare our findings to contemporaneous data from the American Time Use Survey (ATUS) to assess the extent to which these problems may extend to ATUS data.
The Importance of Time Spent Preparing and Consuming Meals
Since its inception, the ATUS has been a valuable source of data used by the USDA to track changes in time spent preparing and eating meals among the U.S. population (Anekwe and Zeballos 2019; Hamrick et al. 2011; Hamrick and Shelley 2005; Mancino 2007), and these findings are important given their connections to health, among other outcomes. For example, research shows that more time spent cooking associates negatively with BMI (Kolodinsky and Goldstein 2011). One explanation for this relationship is that spending less time cooking indicates greater reliance on relatively unhealthy forms of eating, such as consumption of fast food and ready-to-eat convenience foods (Poti et al. 2015; Taillie 2018). Amount of time spent cooking, by contrast, associates with consuming healthier foods (Monsivais, Aggarwal, and Drewnowski 2014; Taillie 2018).
Time spent cooking is also useful beyond its direct connection to health. Although understanding how time spent cooking varies between demographic groups is important for interpreting health outcomes between groups, time spent cooking may also reflect egalitarian ideals and their connection to educational attainment, as is potentially revealed by the unequal ways in which time spent cooking changed in the U.S. between 2003 and 2016 (Taillie 2018). Specifically, men with at least a high school education increased time spent cooking while men with less education decreased time spent cooking. For women, these results were largely reversed. Further, ATUS measures of meal preparation have also been used to assess the Supplemental Food Assistance Program (SNAP) by highlighting food preparation as a cost, similar to monetary costs (Davis and You 2010), and the importance of considering SNAP recipients’ time constraints, leaving them with little time to cook (Beatty et al. 2014).
Diaries have been a natural choice for the previously discussed research due to being viewed as providing the most accurate measures of respondents’ daily expenditure of time (Juster et al. 2003; Kitterød 2001). They are, however, highly burdensome, and tradeoffs must be made to avoid respondents dropping out of these studies. In ATUS, this takes the form of focusing on respondents’ primary activities while neglecting to capture the simultaneous completion of most other activities (Phipps and Vernon 2009). The consequences of not collecting these secondary activities vary depending on whether the activity is generally thought of as a primary activity. For example, estimates of time spent traveling is thought to be unimpacted by the absence of secondary activity measures (Phipps and Vernon 2009). By contrast, some activities are often experienced as secondary activities. Child care is a closely studied example (Phipps and Vernon 2009). In the present study, we contend that food preparation and consumption should be further studied and present preliminary evidence showing how current measures may lead to biased estimates of time spent preparing and consuming meals.
Although the burden and programmatic challenges of collecting secondary activity data in time diaries can be addressed, it also appears that time diaries are sensitive to design choices. Specifically, there is concern that providing respondents with the option of reporting secondary activities may reduce the amount of time spent in some primary activities (Kitterød 2001). There is some evidence for this in diaries from Norway, where days with secondary activity response options associated with less time spent in childcare as a primary activity for married women with children aged 0 to 15, relative to days where secondary activity data was not provided. It is unclear if the presence of secondary activity measures is responsible for this difference because although time spent in childcare seems to show a reduction with the inclusion of secondary activity measures, no such reduction in time spent engaging in housework, which may include meal preparation, is found. Likewise, time spent consuming food as a primary activity does not diminish when collecting secondary measures, though it does appear to increase slightly for some groups when secondary measures are collected. Given this uncertainty, researchers should be cognizant of the potential for shifting estimates of time spent in some primary activities when collecting secondary activity data.
Despite the potential downsides of collecting secondary activity data, neglecting to do so limits our understanding of daily life (Kitterød 2001; Phipps and Vernon 2009). The ATUS collected such data on eating and drinking in 2006-2008 and on eating in 2014-2016 as part of the Eating and Health Module. Research has so far treated such secondary eating and drinking measures as homogenous, in that they imply snacking rather than full meals (Hamermesh 2010; Tajeu and Sen 2017). Yet, such instances may imply a qualitatively different activity entirely if preceded by primary meal preparation. Similarly, USDA provides an exhaustive analysis of what people do during secondary eating and drinking but provides no assessment of how often such eating/drinking follows primary meal preparation (Anekwe and Zeballos 2019). To our knowledge, no previous research assesses secondary meal preparation at all.
In the present study, we utilize the sequencing of activities in our diary data and contemporaneous ATUS data to identify how often primary meal preparation is and is not followed by primary eating/drinking. We then use the detailed secondary activity information available in our diary to further understand those instances where eating/drinking are expected yet absent. A specific instance of meal preparation without subsequent food consumption is not necessarily unusual. A respondent may be cooking a meal for someone else, for example, and not for themselves. We therefore focus our analysis on respondents’ most typical forms of reporting. While a single instance of cooking without subsequent eating is not unusual, reporting this as more common than cooking followed by eating may be indicative of a respondent conceiving of meal preparation and meal consumption differently than researchers may expect. We then assess heterogeneity across demographic subpopulations in how primary and secondary eating/drinking and primary meal preparation are reported. We conclude by discussing the implications of our findings for future research.
Data and Methods
Sample
We use two data sources for this study: (1) original time diaries collected from U.S. residents via Amazon’s Mechanical Turk (MTurk) and Prolific and (2) time diaries collected via the American Time Use Survey (ATUS) (U.S. Bureau of Labor Statistics and U.S. Census Bureau 2022). Online respondents recruited via MTurk and Prolific completed their diaries using our online time-diary platform (Rinderknecht et al. 2022). Days reported by these online respondents range from February 7th to March 2nd, 2020. To strengthen our comparison with ATUS, we only include ATUS diary responses within this time span. Diary responses are limited to respondents aged 18 to 65 with at least a high school education. These exclusion criteria further strengthen comparability with ATUS, due to the low number of respondents outside of this range in MTurk and Prolific samples. We ensure high data quality from our MTurk and Prolific respondents by requiring positive reputations (Peer, Vosgerau, and Acquisti 2014). This means that respondents were required to have completed at least 500 previous tasks on MTurk or 20 previous studies on Prolific, and that at least 95% of this previous work was deemed as acceptable quality. Further, we follow procedures for excluding respondents using proxy servers to mask their IP address (Winter et al. 2019).
We employ quality criteria similar to criteria employed by Fisher and Gershuny (2013): diaries are only included if they consist of at least seven episodes and contain at least two of the following four activities: sleep, other personal care, eating/drinking, and travel/exercise. 95% of diaries meet these quality criteria. Our final samples consist of 721 diaries reported by 290 online respondents (i.e., respondents recruited from MTurk or Prolific provided multiple diaries), and 472 dairies reported by 472 ATUS respondents. Online respondents are 61% female, 75% white, 45% married, 37% have a child of their own in their household, and their average age is 38 (SD = 10.98). ATUS respondents are 61% female, 68% white, 57% married, 46% have a child of their own in their household, and their average age is 43 (SD = 12.28).
Diary instrument
Online respondents reported information about their daily lives using our online time-diary platform (Rinderknecht et al. 2022). Following initial recruitment and completion of the introductory survey, which collected demographic measures, we directed respondents to the diary platform. Respondents began participating the following day and completed their first diary the day after that. Respondents could complete up to three consecutive diary reports, one for each of the three days following their completion of introductory survey. Respondents completed the diary by reporting on the day in episodes, starting with the first episode that happened at midnight and ending with the last episode just before the following midnight, at 11:59pm, with each episode having a main activity and contextual information for the activity (unless they reported a personal care activity, such as sleep), including duration, who else was present, location, secondary activities, and emotions experienced during the activity.
Primary and secondary activities are reported in different ways. Primary activities refer to what the respondent was doing during a specific time, and respondents record these activities via a free-response textbox. Pre-provided options are then provided to the respondent as they type, though they can ignore these provided options and type a custom activity. If they provide a custom activity, they are then required to provide a basic coding of this activity. For primary eating/drinking activities, a coder reviewed all custom activities and recoded them to match the American Time Use Survey (ATUS) coding lexicon. By contrast, respondents were not asked to code their custom activities as including meal preparation but instead coded them in a broader category including all forms of household labor. We therefore read through all respondents’ verbatim responses to identify activities featuring meal preparation. Overall, 12% of episodes featuring eating/drinking and 17% of episodes featuring meal preparation as a primary activity featured a custom activity and were evaluated by our coder.
After reporting the primary activity, respondents were asked what else they were doing during the primary activity. Two response options included “Eating/drinking” and “Household Labor”. If either were selected, the respondent then reported the percent of the episode this secondary activity overlapped. Respondents therefore did not type out the activity when reporting these secondary activities. See the supplementary section for an overview of this reporting process, including task instructions and a list of the available primary and secondary activity options.
Our diary application differs from ATUS in important ways. ATUS data are collected through the phone. For each episode, the interviewer will ask what activity the respondent was engaging in. If a respondent provides multiple answers, the interviewer is instructed to require the respondent to select their primary activity. The other activities are not included in the final data (Phipps and Vernon 2009). In our diary, we instruct respondents to only report a single activity for each episode, and we alert respondents if it appears these instructions are being ignored (for example, we display a warning if the word “and” appears in their verbatim activity response). Since we lack an interviewer, we cannot strictly enforce this requirement. Therefore, if respondents report multiple activities as their primary activity (e.g., “Cooked dinner and watched TV”), we then coded only the first activity they mentioned. This difference between our data and ATUS data is unlikely to notably impact data quality since only 40 primary activities include multiple activities out of all 10,063 episodes reported by our online respondents. Beyond this, earlier years of ATUS collected secondary eating during non-personal care activities. Contemporaneous ATUS data lacks secondary eating measures.
Measures
Primary food preparation and eating/drinking. Online respondents reported food preparation by selecting a pre-provided activity, such as “Prepared Dinner,” or wrote a verbatim response, such as “Made Lunch,” which we coded as “Food Preparation.” Eating was reported similarly, either by selecting a pre-provided activity or by providing a verbatim response. In the ATUS data, food preparation corresponds to episodes with activity code 020201 and eating/drinking corresponds to codes 110101 and 110199 (U.S. Bureau of Labor Statistics and U.S. Census Bureau 2020).
Secondary eating/drinking. Secondary activities are reported as occurring during the time span of the primary activity. We examine secondary time spent eating/drinking. Following past work, we did not directly ask for reports of secondary food preparation. Although secondary household labor may include meal preparation, treating household labor as secondary meal preparation would be an assumption. Supplemental results, which we discuss later, show that such an assumption may yield useful insights, but future work would benefit from directly asking about secondary meal preparation.
Food preparation followed by eating/drinking. Food preparation followed by eating/drinking is defined differently depending on if these are primary or secondary activities. Primary food preparation is defined as being followed by primary eating/drinking if such eating/drinking occurs within the next two episodes. Primary food preparation is defined as being followed by secondary eating/drinking if such eating/drinking occurs during or immediately following primary food preparation. For example, a respondent my report making breakfast, then report commuting to work, and report secondary eating/drinking while commuting.
Response groups. As we discussed earlier, it appears unusual for meal preparation to not be followed by meal consumption and may imply respondents are reporting in ways researchers do not expect. This can take the form of some respondents reporting primary meal preparation and their eating as a secondary activity (PPre/SEat) or reporting no eating/drinking at all (PPrep/NEat). These contrast with many researchers’ expectations that respondents will report primary meal production followed by primary meal consumption (PPrep/PEat). We are interested in understanding for whom these three combinations are most typical. To do so, we report the modal reporting style for each respondent across their diary responses. In other words, if a respondent reports PPre/SEat twice and PPrep/NEat once across their diary responses, they would be coded as PPre/SEat. If the respondent instead reported PPre/SEat twice and PPrep/NEat twice, then the respondent would be coded as both PPre/SEat and PPrep/NEat. Ties between response groups are quite rare (see Table A2 in the appendix for more information).
There are six possible permutations representing the different ways respondents could report preparing and consuming meals: PPrep/PEat, PPrep/SEat, PPrep/NEat, NPrep/PEat, NPrep/SEat, NPrep/NEat. The most common response pattern for all respondents involves NPrep/PEat and NPrep/SEat. Given the focus of this paper, we give priority to instances of involving food preparation: PPrep/PEat, PPrep/SEat, and PPrep/NEat in our coding. If a respondent reports any form of food preparation, they would be coded into one of these three groups even if their modal response pattern involves eating/drinking not preceded by meal preparation.[1] As such, the remaining group in our analyses is a “catch-all” group of respondents who never report food preparation within the day.1 Using this coding scheme, this leaves us with three groups featuring some combination of primary and secondary activities reliant on the relative sequencing of meal preparation and food consumption and then the never prep group: PPrep/PEat, PPrep/SEat, PPrep/NEat, NeverPrep. Table 1 further clarifies the conditions under which an instance of meal preparation and eating/drinking would be assigned to one of these groups:
Table 1
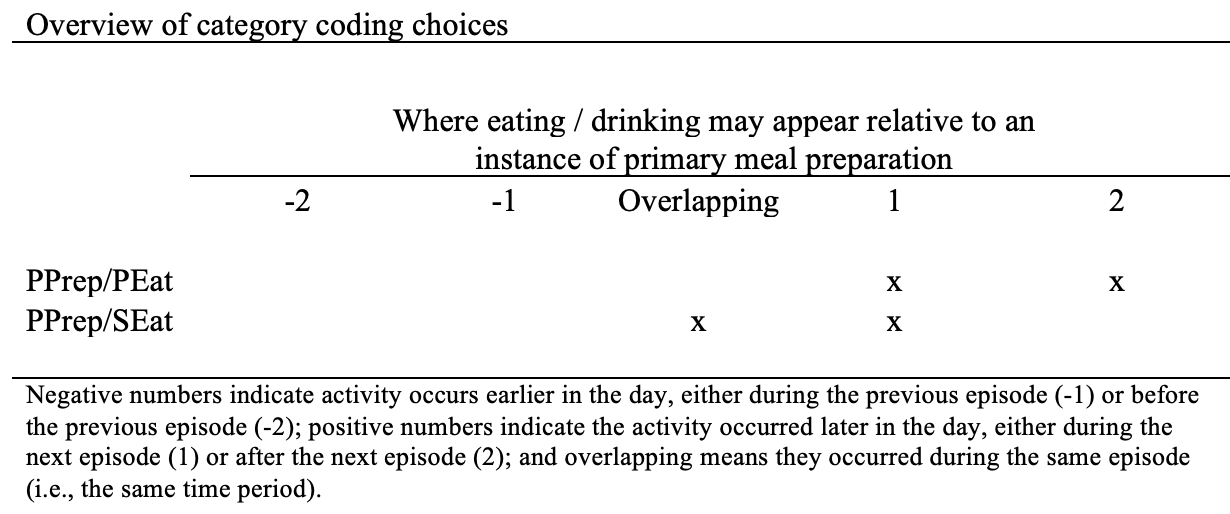
Our discussion of “colloquial double barreling” is represented the PPrep/NEat group in that they imply a tendency for respondents to conceive of meal production and consumption as the same activity. The NeverPrep group may also suggest colloquial double barreling but may also represent respondents who do not cook at all and instead order out or are cooked for by a family member. The PPrep/SEat group may appear to suggest double barreling without considering secondary activities, yet consideration of these secondary activities suggests these respondents tend to not see meal production and consumption as the same activity but rather that one or the other is generally less notable than whatever they report as their primary activity. Lastly, the PPrep/PEat group represents how most past research appears to expect respondents will report meal preparation and meal consumption. Although our coding scheme uses the modal responses, 36 respondents appear in multiple groups because these respondents report multiple forms of meal preparation and consumption at identical rates. Table A2 in the appendix for an overview of which groups share respondents with other groups.
Analytic strategy
Our analysis proceeds in three steps. First, we report how often instances of primary food preparation are followed by primary eating/drinking. We compare findings from our online sample with ATUS data to assess the extent to which our findings are similar to ATUS. Second, we examine the frequency of secondary eating/drinking following or overlapping with primary meal preparation. Third, we estimate logistic regressions to assess how demographic characteristics associate with reports of different combinations of primary and secondary meal preparation and eating/drinking. The second and third stages of our analyses use only diaries from our online sample because contemporaneous ATUS responses only record secondary time in childcare and eldercare activities. These findings indicate whose time use may be most misreported in data only measuring primary activities.
Results
Overall, our online respondents reported 485 instances of primary food preparation across all of their diary responses, approximately 69% of which are followed by eating/drinking as a primary activity. These findings are largely consistently with contemporaneous ATUS responses, which include 489 instances of primary food preparation, 62% of which are followed by eating/drinking as a primary activity. Although the odds of food preparation not being followed by eating/drinking is marginally higher in the ATUS data (OR = 1.29, p < .1, see Table A1 in the appendix), we take this as evidence that our online respondents are reporting meal preparation and eating/drinking in ways similar to ATUS respondents. In fact, this finding suggests that the following analyses of our online sample may present a conservative estimate of respondents’ tendencies to report food preparation and consumption in unexpected ways.
We now focus more closely on our online sample to better understand instances where meal preparation is not followed by eating/drinking. 35% of our online respondents always report eating/drinking as a primary activity after reporting meal preparation as a primary activity. The other 65% reported some mixture of primary and secondary eating/drinking and primary meal preparation. Specifically, respondents report 28 instances of secondary eating/drinking while producing meals as a primary activity, 27 instances of secondary eating/drinking in the episode after producing meals as a primary activity, and zero instances of both. In isolation, these instances are challenging to interpret. Consistently reporting either food consumption as primary activities, secondary activities, or not at all potentially implies respondents are interpreting these questions in unexpected ways, whereas inconsistencies may imply different circumstances shaping respondents’ interpretations. Interpreting respondents’ decision making is easier if we focus on how they most commonly respond, across all of their diaries, as we do in the next section.
We now consider what forms of reporting are most typical, and for whom are they most typical. Overall, Group 1 (PPrep/PEat) consists of 50% of respondents (144 in total), Group 2 (PPrep/SEat) consists of 8% of respondents (22), Group 3 (PPrep/NEat) consists of 15% of respondents (44), and Group 4 (NeverPrep) consists of 36% of respondents (106).
Table 2
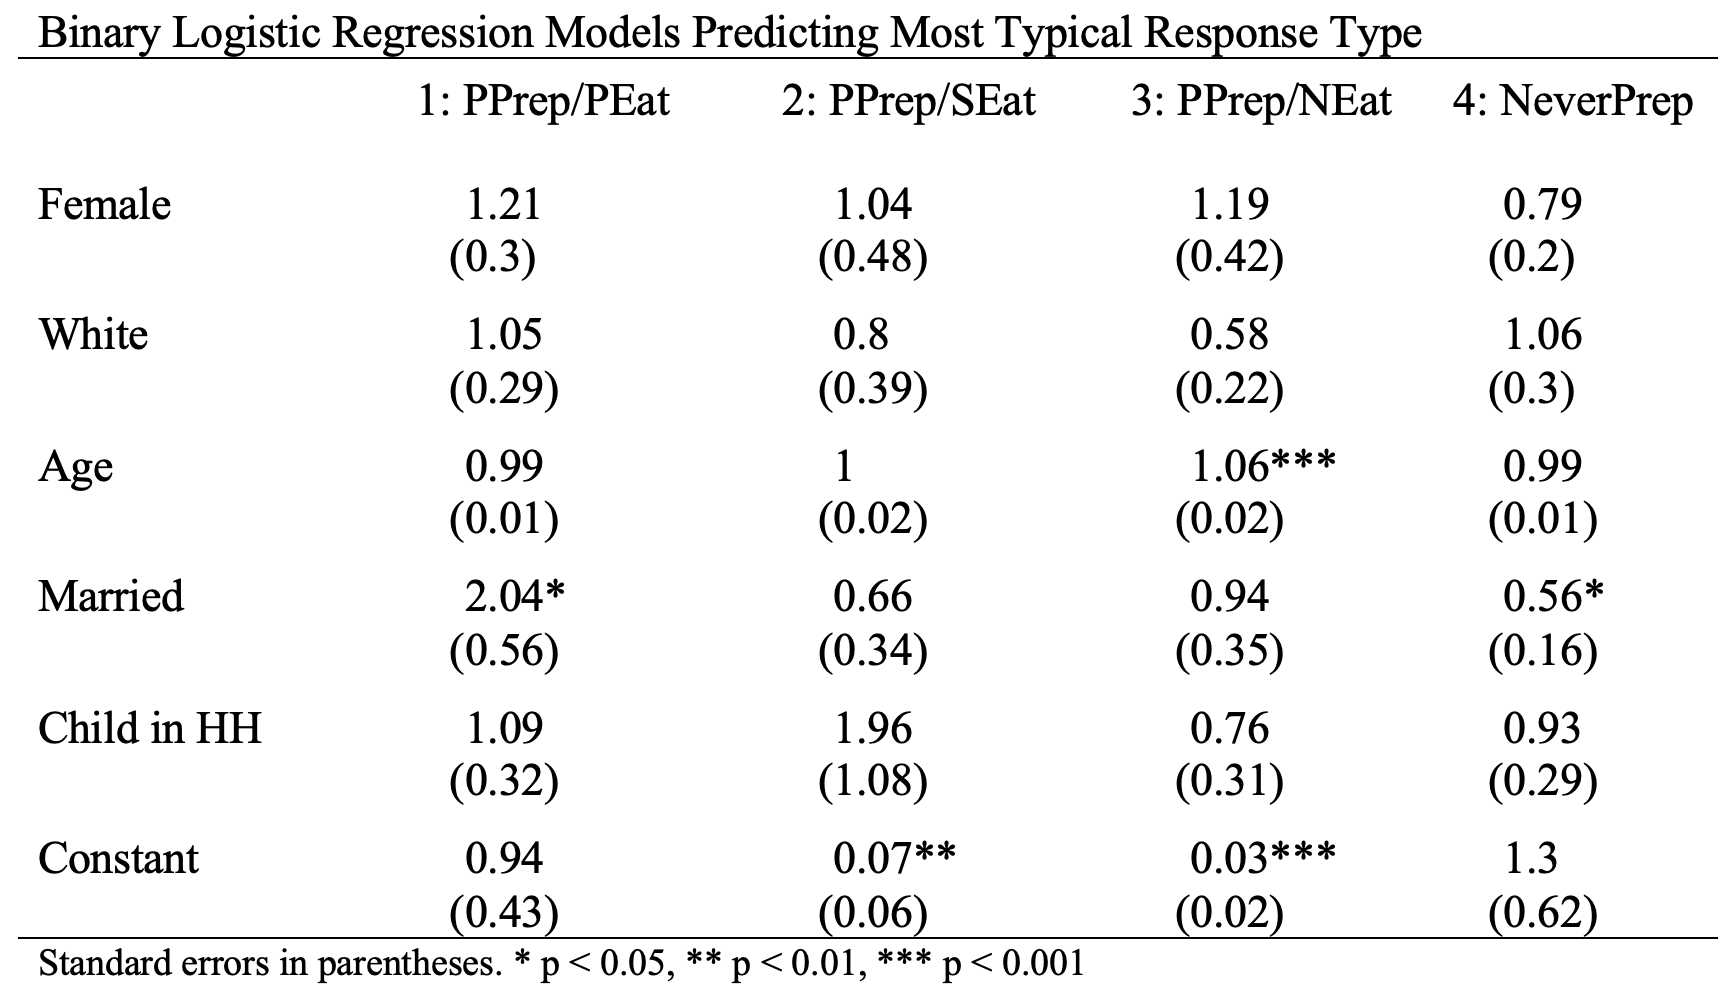
Table 2 shows that being married associates significantly with being in Group 1, which represents how researchers may expect respondents to report meal production and consumption. Being unmarried associates with Group 4, indicated unmarried respondents tend to report no meal preparation at all. These findings may be due to shared meals being a more significant event for married individuals while being comparatively unimportant for singles, as well as cooking potentially being a shorter activity for singles and less likely to be seen as primary. Beyond this, Group 3 tends to associate with older respondents, indicating older respondents tend to report primary meal preparation and no eating/drinking at all.
Given the relatively small sizes of Groups 2 and 3, our analysis may be underpowered for detecting some other relationships. For example, a larger sample may reveal significant associations between secondary rather than primary eating (Group 2) and the presence of children in the household.
Discussion
Our findings reveal that when our respondents report primary meal preparation, approximately half of them most typically report primary meal consumption. Yet, a non-negligible percent of respondents instead most typically report secondary eating (8%). These forms of reporting may highlight qualitatively different kinds of experiences—for example, whereas secondary eating not in proximity to meal preparation likely indicates snacking/grazing, secondary eating following primary meal preparation may hold a different meaning entirely, perhaps indicating consumption of a major meal while preoccupied by some other activity or task rather than snacking.
In contrast, some respondents most typically reported no eating at all after primary meal preparation (15%). This may represent what we referred to as “colloquial double barreling,” where an activity such as “made lunch” technically means meal production but is often considered to also include meal consumption. Similarly, a large percent of respondents (36%) appeared to never report meal preparation at all. As mentioned previously, these respondents may also be engaging in colloquial double barreling but may also be cooked for by others. We cannot distinguish between these possibilities in our current analysis. Overall, not accounting for secondary activities or the potential issue of colloquial double barreling may lead to inaccurate time-use estimates for these categories. A growing literature has revealed important correlates of time spent preparing and consuming meals (Bianchi et al. 2012; Bowen, Brenton, and Elliott 2019; Cairns, Johnston, and Baumann 2010; Fielding-Singh 2021). Our findings offer additional insights and useful new lines of inquiry that build on this line of work.
One potential avenue may relate to how respondents’ demographic backgrounds relate to how they report. Our findings do not allow us to delve deeply into the reasons married respondents are more likely to report primary meal preparation followed primary eating/drinking. As we suggested previously, cooking for multiple people may make such actions more time consuming because of higher standards and norms embedded in marriage as an institution. Yet, more generally, an activity may be more significant to the respondent and thus likely to be reported as an episode when it is done with someone, rather than alone. Eating and drinking, similarly, might be a more significant occasion to respondents if it occurs with someone, such as a spouse. This interpretation fits well with sociological research on the social organization of meals and the recent “subversion” of norms relating to commensality (Yates and Warde 2017). This work highlights how companionless meals are both simpler and quicker than shared meals, and that companionless meals are becoming more common as household size decreases. Although this work focuses on the U.K., the U.S. is facing similar demographic changes (U.S. Census Bureau 2018). The relationship between length and complexity of meals, commensality, and the likelihood of being reported as primary or secondary activities should be of interest to scholars interested in health and time-use. As household size and marriage rates continue to fall globally, both meal preparation and consumption may therefore become increasingly challenging to measure (Snell 2017). Although some activities are commonly reported as primary (Phipps and Vernon 2009), respondents’ rationale for reporting an activity as primary or secondary is not well understood, be it due to duration of the activity, perceived importance, or other factors.
Our findings also speak more generally to the importance of collecting detailed secondary activity information, given how such information can present a significantly different understanding of how people spend their time compared to only assessing primary activities. For example, recent diary research from the U.K. reveals that, in 2015, respondents reported spending approximately 30 minutes a day using computers as a primary activity, while at the same time reported spending 2 to 3 hours a day using digital devices as a secondary activity (Gershuny and Sullivan 2019). Rather than displacing time spent in other activities, as television had in earlier decades (Robinson and Godbey 1997), researchers are now beginning to view digital technology as complimenting other activities, leaving people perpetually connected to others (Vanden Abeele, De Wolf, and Ling 2018) but also, at times, potentially deteriorating in-person social engagement (Pouwels et al. 2021). If meal preparation and consumption increasingly fall to the background of other activities, they too may have unexpected effects on other aspects of daily life.
Indeed, secondary meal preparation may be valuable for future researchers to examine more directly. We are unaware of any time-diary data which has collected such measures, but our data hints at its possible importance. Although we did not directly collect secondary food preparation data, we did collect secondary household labor. If we assume that such household labor includes meal preparation when occurring during or just before primary meal consumption, then approximately 8% of respondents (24 in total) reported in this manner most frequently or as frequently as they reported via other forms (i.e., PPrep/PEat, PPrep/SEat, and PPrep/NEat). It may be fruitful for future researchers to directly measure such secondary behavior, its context, and for whom such reporting is most frequent.
Our findings highlight potential issues in how we conceive of measures of meal production and consumption. Although illustrative of the larger issue, this study is limited in what it can tell us about the extent to which these different forms of reporting will appear in more representative time-use data. Partly this is due to our recruitment of online respondents as opposed to conducting our data collection via phone interviews, as is done by ATUS. Perhaps more significantly, online samples tend to differ from the broader U.S. in ways we examine in our data, such as age (Shapiro, Chandler, and Mueller 2013), but also in ways beyond what we can address in our data, such as mental health (McCredie and Morey 2018). Despite its limitations, however, this study highlights the potential problems of colloquial double barreling and differential interpretations on the meaningfulness of activities such as meal preparation and consumption that survey practitioners should consider in future work.
Notes
- Our focus has been on instances where meal preparation was and was not followed by eating and drinking. A broader focus would reveal that the modal response of 68% our respondents (196 in total) would be eating and drinking not preceded by meal preparation in the previous two episodes as opposed to being categorized in the PPrep/PEat, PPrep/SEat, or PPrep/NEat groups. (NeverPrep would not be relevant in this comparison.) However, eating and drinking not preceded by meal preparation is not a particularly unusual form of reporting. For example, such reporting includes episodes where the respondent was cooked for by others or consumed a meal which required no preparation. We therefore do not explore it further in this analysis.
References
- Anekwe, Tobenna D., and Eliana Zeballos. 2019. ‘Food-Related Time Use: Changes and Demographic Differences’. US Department of Agriculture: Economic Research Services 1–63.
- Beatty, Timothy KM, M. Susie Nanney, and Charlotte Tuttle. 2014. ‘Time to Eat? The Relationship between Food Security and Food-Related Time Use’. Public Health Nutrition 17(1):66–72. doi: 10.1017/S1368980012005599.
- Bianchi, S. M., L. C. Sayer, M. A. Milkie, and J. P. Robinson. 2012. ‘Housework: Who Did, Does or Will Do It, and How Much Does It Matter?’ Social Forces 91(1):55–63. doi: 10.1093/sf/sos120.
- Bowen, Sarah, Joslyn Brenton, and Sinikka Elliott. 2019. Pressure Cooker: Why Home Cooking Won’t Solve Our Problems and What We Can Do About It. New York, NY: Oxford University Press.
- Cairns, Kate, Josée Johnston, and Shyon Baumann. 2010. ‘Caring About Food: Doing Gender in the Foodie Kitchen’. Gender & Society 24(5):591–615. doi: 10.1177/0891243210383419.
- Davis, George C., and Wen You. 2010. ‘The Thrifty Food Plan Is Not Thrifty When Labor Cost Is Considered’. The Journal of Nutrition 140(4):854–57. doi: 10.3945/jn.109.119594.
- Fielding-Singh, Priya. 2021. How the Other Half Eats: The Untold Story of Food and Inequality in America. First edition. New York: Little, Brown Spark.
- Fisher, Kimberly, and Jonathan Gershuny. 2013. ‘Coming Full Circle–Introducing the Multinational Time Use Study Simple File’. Electronic International Journal of Time Use Research 10:91–111. doi: 10.13085/eIJTUR.10.1.91-111.
- Gershuny, Jonathan, and Oriel Sullivan. 2019. What We Really Do All Day. UK: Penguin.
- Hamermesh, Daniel S. 2010. ‘Incentives, Time Use and BMI: The Roles of Eating, Grazing and Goods’. Economics & Human Biology 8(1):2–15. doi: 10.1016/j.ehb.2009.12.003.
- Hamrick, Karen S., Margaret Andrews, Joanne Guthrie, David Hopkins, and Ket McClelland. 2011. ‘How Much Time Do Americans Spend on Food?, EIB-86’. US Department of Agriculture: Economic Research Services 1–58.
- Hamrick, Karen, and Kristina J. Shelley. 2005. ‘How Much Time Do Americans Spend Preparing and Eating Food?’ US Department of Agriculture: Economic Research Services 10–11.
- Juster, F. Thomas, Hiromi Ono, and Frank P. Stafford. 2003. ‘2. An Assessment of Alternative Measures of Time Use’. Sociological Methodology 33(1):19–54. doi: 10.1111/j.0081-1750.2003.t01-1-00126.x.
- Kitterød, Ragni Hege. 2001. ‘Does the Recording of Parallel Activities in Time Use Diaries Affect the Way People Report Their Main Activities?’ Social Indicators Research 56:145–78.
- Kolodinsky, Jane M., and Amanda B. Goldstein. 2011. ‘Time Use and Food Pattern Influences on Obesity’. Obesity 19(12):2327–35. doi: 10.1038/oby.2011.130.
- Mancino, Lisa. 2007. ‘Who Has Time To Cook? How Family Resources Influence Food Preparation’. US Department of Agriculture: Economic Research Services 1–19.
- McCredie, Morgan N., and Leslie C. Morey. 2018. ‘Who Are the Turkers? A Characterization of MTurk Workers Using the Personality Assessment Inventory’. Assessment 107319111876070. doi: 10.1177/1073191118760709.
- Monsivais, Pablo, Anju Aggarwal, and Adam Drewnowski. 2014. ‘Time Spent on Home Food Preparation and Indicators of Healthy Eating’. American Journal of Preventive Medicine 47(6):796–802. doi: 10.1016/j.amepre.2014.07.033.
- Peer, Eyal, Joachim Vosgerau, and Alessandro Acquisti. 2014. ‘Reputation as a Sufficient Condition for Data Quality on Amazon Mechanical Turk’. Behavior Research Methods 46(4):1023–31. doi: 10.3758/s13428-013-0434-y.
- Phipps, Polly A., and Margaret K. Vernon. 2009. ‘Chapter 7, Twenty-Four Hours: An Overview of the Recall Diary Method and Data Quality in the American Time Use Survey’. Pp. 109–28 in Calendar and Time Diary: Methods in Life Course Research, edited by R. F. Belli, F. P. Stafford, and D. F. Alwin. SAGE Publications, Inc.
- Poti, Jennifer M., Michelle A. Mendez, Shu Wen Ng, and Barry M. Popkin. 2015. ‘Is the Degree of Food Processing and Convenience Linked with the Nutritional Quality of Foods Purchased by US Households?’ The American Journal of Clinical Nutrition 101(6):1251–62. doi: 10.3945/ajcn.114.100925.
- Pouwels, J. Loes, Patti M. Valkenburg, Ine Beyens, Irene I. van Driel, and Loes Keijsers. 2021. ‘Social Media Use and Friendship Closeness in Adolescents’ Daily Lives: An Experience Sampling Study.’ Developmental Psychology 57(2):309–23. doi: 10.1037/dev0001148.
- Rinderknecht, R. Gordon, Long Doan, and Liana C. Sayer. 2022. ‘MyTimeUse: An Online Implementation of the Day-Reconstruction Method’. Journal of Time Use Research 1:23–50. doi: 10.32797/jtur-2022-3.
- Robinson, John P., and Geoffrey Godbey. 1997. Time for Life: The Surprising Ways Americans Use Their Time. University Park, Pa: Pennsylvania State University Press.
- Shapiro, Danielle N., Jesse Chandler, and Pam A. Mueller. 2013. ‘Using Mechanical Turk to Study Clinical Populations’. Clinical Psychological Science 1(2):213–20.
- Snell, K. D. M. 2017. ‘The Rise of Living Alone and Loneliness in History’. Social History 42(1):2–28. doi: 10.1080/03071022.2017.1256093.
- Taillie, Lindsey Smith. 2018. ‘Who’s Cooking? Trends in US Home Food Preparation by Gender, Education, and Race/Ethnicity from 2003 to 2016’. Nutrition Journal 17(1):41. doi: 10.1186/s12937-018-0347-9.
- Tajeu, Gabriel S., and Bisakha Sen. 2017. ‘New Pathways From Short Sleep to Obesity? Associations Between Short Sleep and “Secondary” Eating and Drinking Behavior’. American Journal of Health Promotion 31(3):181–88. doi: 10.4278/ajhp.140509-QUAN-198.
- U.S. Bureau of Labor Statistics and U.S. Census Bureau. 2020. ‘American Time Use Survey Lexicon 2020’.
- U.S. Bureau of Labor Statistics, and U.S. Census Bureau. 2022. American Time Use Survey User’s Guide: Understanding ATUS 2003 to 2021.
- U.S. Census Bureau. 2018. ‘U.S. Census Bureau Releases 2018 Families and Living Arrangements Tables’. Retrieved (https://www.census.gov/newsroom/press-releases/2018/families.html#:~:text=In%202018%2C%20there%20are%2035.7,13%20percent%20of%20all%20households).
- Vanden Abeele, Mariek, Ralf De Wolf, and Rich Ling. 2018. ‘Mobile Media and Social Space: How Anytime, Anyplace Connectivity Structures Everyday Life’. Media and Communication 6(2):5–14. doi: 10.17645/mac.v6i2.1399.
- Winter, Nicholas, Tyler Burleigh, Ryan Kennedy, and Scott Clifford. 2019. ‘A Simplified Protocol to Screen Out VPS and International Respondents Using Qualtrics’. SSRN Electronic Journal. doi: 10.2139/ssrn.3327274.
- Yates, Luke, and Alan Warde. 2017. ‘Eating Together and Eating Alone: Meal Arrangements in British Households: Eating Together and Eating Alone’. The British Journal of Sociology 68(1):97–118. doi: 10.1111/1468-4446.12231.
- Zeballos, Eliana, and Brandon Restrepo. 2018. ‘Adult Eating and Health Patterns: Evidence From the 2014-16 Eating & Health Module of the American Time Use Survey’. US Department of Agriculture: Economic Research Services 1–53.
-
Keywords
calibration CATI coverage coverage bias cross-national surveys data linkage data quality European Social Survey experiment face-to-face face-to-face survey Facebook hard to reach populations incentives item nonresponse measurement measurement error mixed-mode surveys multitasking non-probability samples Nonresponse nonresponse bias nonresponse rates paradata PIAAC Probability sample probability samples QR codes rare populations response rate Satisficing social desirability Social media survey survey-taking climate survey data survey management survey methods Telephone survey telephone surveys total survey error unit nonresponse validity web survey Web surveys weighting
