

Usability of Augmented-Reality Portion Estimators During 24-hour Dietary Recall Interviews
DiGrande, L., Karns, S., Kinyara, E., & Pedrazzani, S. (2023). Usability of Augmented-Reality Portion Estimators during 24-hour Dietary Recall Interviews. Survey Methods: Insights from the Field, Special issue: ‘Food Acquisition Research and Methods’. Retrieved from https://surveyinsights.org/?p=17488
© the authors 2023. This work is licensed under a Creative Commons Attribution 4.0 International License (CC BY 4.0) 
Abstract
Dietary recall instruments are structured interviews that capture information on foods and beverages consumed by participants in the past 24 hours. These instruments often rely on tools to help estimate portion size such as three-dimensional food models or two-dimensional images in a booklet or on a computer screen. Two-dimensional tools are good alternatives to bulky food models but may have scale challenges. To circumvent this issue, we developed and tested a digital portion estimator tool by rendering three-dimensional digital images in a tablet using augmented reality (AR) technology. The tablet was pilot tested during 24-hour dietary recall interviews with community-dwelling, English-speaking adult participants to determine its usability. We assessed whether tablet use influenced interview time, participant satisfaction, and whether it produced similar dietary intake data to interviews using food models or a booklet. Our results indicate comparable completion times and satisfaction scores across portion estimator tools. Average daily intake of food groups and nutrients were also similar, regardless of whether food was eaten in or away from home. While some participants desired more AR image stability and tablet durability, the technology offers an innovative method for examining life-size objects in a digital format during dietary recalls.
Keywords
augmented reality, Automated Multiple-Pass Method, dietary recall, dietary surveys, food consumption, food models, portion size measurement
Acknowledgement
This study was supported by RTI International’s intramural funding program. We are grateful to Alanna Moshfegh and Donna Rhodes of the United States Department of Agriculture (USDA) for their guidance during the fielding and analysis phases of this research, as well as Melanie Hymes at USDA for her manual coding and quality control checks of our dietary intake data.
Copyright
© the authors 2023. This work is licensed under a Creative Commons Attribution 4.0 International License (CC BY 4.0)
Introduction
Dietary recall instruments are structured interviews designed to obtain detailed information about food consumption on a given day. (1) Participants report food and beverages consumed in the past 24 hours, typically from midnight to midnight the previous day. These data are linked to food composition databases to assess total dietary intake or to analyze specific features of participants’ diets. Dietary recalls are used to describe a population’s intake, examine relationships between diet and health, determine the effectiveness of interventions on diet, and set guidelines for dietary recommendations and food assistance programs (2)
Portion size estimation is a critical aspect to obtaining accurate serving sizes of consumed foods and beverages and application of standard nutritional profiles (e.g., per 100 grams). A variety of tools have been developed for portion estimation including sets of three-dimensional (3D) food models (e.g., measuring guides such as glasses, mugs, bowls, plates, food mounds of varying sizes) and the United States Department of Agriculture’s (USDA) food model booklet, both of which are used during interviewer-administered dietary recalls in the National Health and Nutrition Examination Survey (NHANES). (3) Alternatively, the Automated Self-Administered 24-hour Dietary Assessment Tool (ASA24) incorporates a large database of food-specific images into its software system which appear on a computer screen for point and click selection. (4)
The USDA booklet and ASA24 image database are good alternatives to bulky food models, but they still have challenges with visualization and/or scale. For example, images on a monitor or laptop screen used during the ASA24 are smaller than life size. Researchers have tested alternatives like digital photographic tools and image sensors, but these also require a reference object or ruler to appear near foods for scale or have issues with irregular shaped and/or multi-ingredient food. (5-9)
Using the emerging technology of augmented reality (AR), we developed and evaluated a new digital portion estimator tool. AR technology refers to a digital technology that overlays virtual elements, such as images, videos, or three-dimensional (3D) models, onto the real world, enhancing the user’s perception and interaction with their surroundings. (10) AR combines the virtual and real worlds, allowing users to interact with both simultaneously. AR typically requires a device, such as a smartphone or tablet that uses its camera and sensors to capture the real-world environment. The AR software then processes the captured data and superimposes digital content onto the user’s view, aligning it with the real-world objects. While the general public may be familiar with AR technology in gaming and retail, the technology has been used in other fields. (11) In education, AR technology has been shown to improve student learning, motivation and enhance group work in the classroom. (12) In medicine, AR technology has been used in preoperative planning and intraoperatively to improve surgical outcomes. (13)
For this study, we used AR technology to render images of food portion estimators (e.g., plates, bowls, glasses, cups) on a touchscreen tablet for use during dietary recall interviews. The AR food portion images appeared as life-size, 3D objects when looking at the tablet and were manipulable via screen touch. Our study, designed and executed before the widespread interruption of field surveys by the coronavirus pandemic, collected descriptive data to assess the usability of our tablet in a community setting. Our objectives were exploratory, not hypotheses driven, and designed to assess usability factors of learnability, task completion, and user satisfaction. We investigated whether study participants could use the tablet as easily as the food models or booklet, and whether the measures obtained during dietary intake interviews that used the tablet were comparable to those obtained with these standard tools.
Methods
Participant recruitment
We recruited community-dwelling adults for this study, defined as individuals 18+ years of age who resided in non-institutional dwellings (e.g., single family house, townhouse, apartment building) at the time of data collection. Our recruitment employed two-staged sampling and multi-staged recruitment which resembled NHANES sampling procedures. (14) First, we purposively selected United States Census block groups in Durham and Wake Counties in North Carolina to provide variability of population density, race-ethnicity, and education. Next, a random sample of residential addresses was selected within each block group to receive a lead letter by mail. Trained field interviewers visited these addresses within one week to screen potential participants. Contact information was obtained, and interview appointments were made with interested adults who were English-speaking, not pregnant, and not fasting.
Dietary recall interviews took place in participants’ homes over a four-month period beginning November 2019. Interviews were held on weekdays and weekends, though some dates were excluded to avoid risking atypical consumption due to holidays (i.e., November 27 through December 1, December 23 through January 3). Signed informed consent was obtained before the start of interview. We purposely simplified demographic questions with limited answer choices for age, sex, and education status to reduce respondent burden. Participants who completed the interview received $20 cash. RTI International’s Institutional Review Board approved the protocol. A description of the full protocol is described in our previously published manuscript which focused on whether 24-hour dietary recall interviews can successfully be administered in participants’ homes by both nutritionists and trained layperson interviewers. (15)
Instrumentation
We used the USDA’s Automated Multiple-Pass Method (AMPM), 2016 Version as our data collection instrument in this study. The AMPM is a research-based approach used for two decades to collect dietary intake data for What We Eat in America (WWEIA) via NHANES. (16) Like other dietary recall instruments, AMPM is a structured interview designed to capture detailed information about all the food and beverages consumed in the past 24 hours (i.e., midnight to midnight the previous day). A trained interviewer administers the AMPM via computer-assisted personal interviewing (CAPI) software developed by USDA. The participant receives cues to help remember and describe foods and beverages in five stages briefly described in Table 1. Standardized wording and multiple memory cues are used within the stages to elicit recall.
Design and use of augmented reality (AR) portion estimators
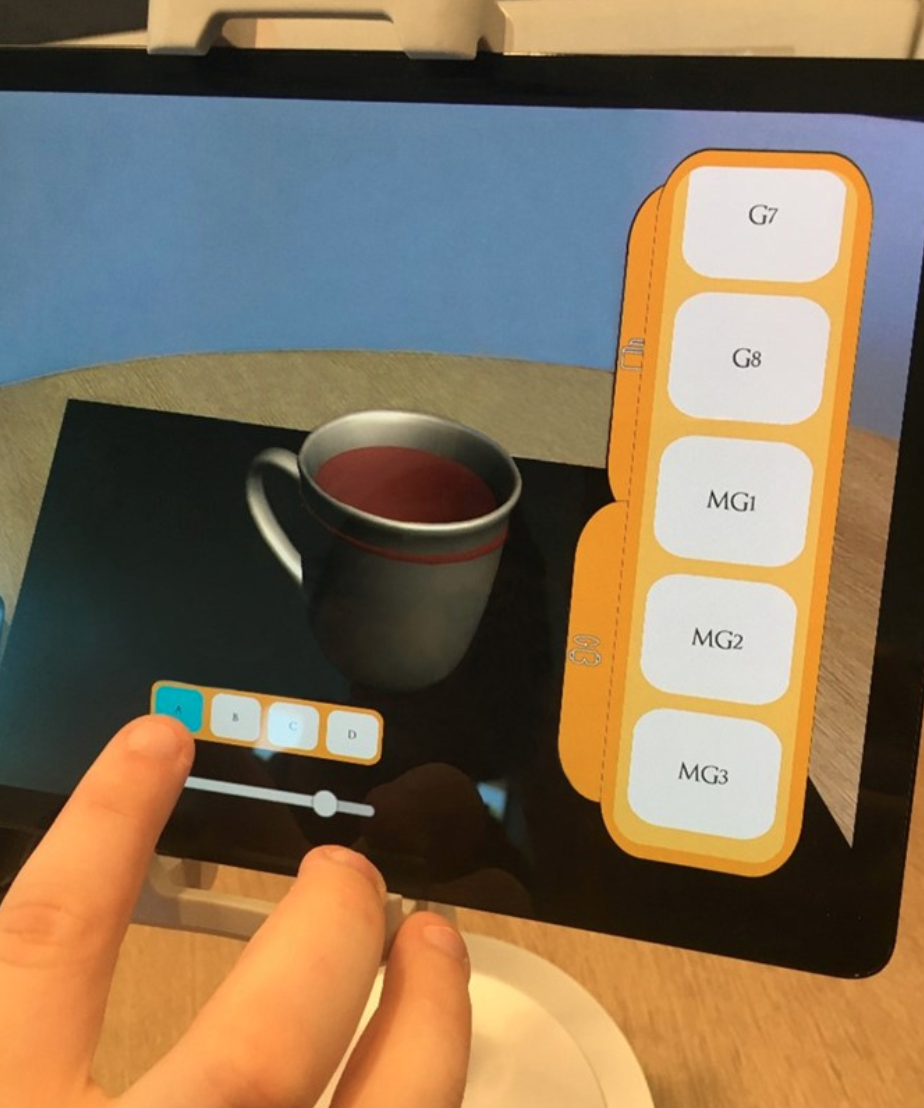
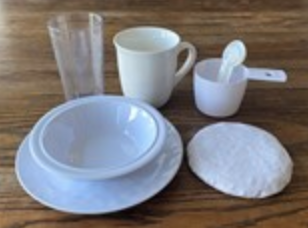
A tablet prototype with AR technology (referred herein as the AR tablet, Figure 1a) was developed by RTI International’s innovation lab based on 3D food models typically used in dietary intake interviews (i.e., drinkware, plateware, and measuring cups; Figures 1b and 1c, respectively). To develop the tablet, RTI computer scientists scanned each 3D food model, as well as its corresponding food model booklet image, to create virtual, 3D models within the tablet that appeared as life-size objects and in the viewer’s real-world environment. The AR objects within the tablet were organized and labeled the same as NHANES’ food models and USDA’s food model booklet to create consistency among the three portion estimator options used in the study. After internal testing, the prototype design was replicated on six tablets for use among four field interviewers.
During interviews, the tablet was attached to a stand to prevent it being dropped and damaged. The tablet was placed on a table in front of each participant while an interviewer sat next to them with a laptop to record estimated portion sizes of what they ate as reported through the AMPM. When participants assigned to use the tablet needed to consult an aid to estimate a portion for a food item they reported, the participant scrolled through a large-button, touch-screen menu on the right side of tablet. When the participant selected from glassware, flatware, and food mounds, the item appeared as a three-dimensional object within the tablet that could be rotated by touch. Participants could also touch the screen to select a fill line within each object. Illustrated in Figure 1a, this particular user selected a mug out of two glass and three mug choices, then proceeded to touch the screen to fill the chosen mug to the top. Labels on the menu corresponded to AMPM data entry codes that interviewers are required to use. For example, in Figure 1a, MG1, MG2, or MG3 is entered into the AMPM to indicate which size mug (MG) was chosen by the participant; a, b, c, or d is also entered into the AMPM to indicate which fill level was selected. The tablet’s labeling method for estimator type and fill line was the same one used for the food models and the booklet (Figure 1c).
Data processing
We evaluated the usability of the AR tablet using paradata and AMPM outcome data from foods and beverages reported during the interview. Paradata included the time it took to complete the dietary recall interview and participant satisfaction with the materials and experience. Satisfaction was recorded by participants on a short paper form away from interviewers and placed in an envelope to prevent disclosure. Since interviews were conducted in participants’ homes, our interviewers also recorded whether participants used items from their homes to assist with recall (e.g., yogurt cup from refrigerator, their “morning coffee mug”). These paradata were stratified by portion estimator (i.e., AR tablet vs. food models vs. booklet).
We also assessed the degree to which use of the AR tablet may have influenced AMPM outcome data including food group (e.g., added sugar, discretionary fats, dairy, fruits, vegetables) and nutrient intake (e.g., kilocalories, calcium, cholesterol, fiber). To accomplish this, we processed AMPM data according to the USDA’s Dietary Intake Data System. (17) First, the Post Interview Processing System (PIPS, Version 2.2) was used to auto-code entries. We then de-identified remaining data for manual coding by the USDA’s Food Survey Research Group (FSRG). Quality control checks performed by the USDA indicated that auto coding was successfully applied to 51% of entries and was consistent with NHANES cycle 2015-2016 data (50%) and NHANES cycle 2017-2018 (56%). (15) Next, the Food and Nutrient Database for Dietary Studies (FNDDS) was used to generate nutrient values for foods and beverages reported by participants.
Statistical analyses
Statistical analyses were completed with SAS, Version 9.4. Comparisons across the three types of portion estimators were made to identify statistically significant differences at α level of 0.05 and 0.01. Chi-square and Fisher’s exact tests were performed to determine whether participant demographics were unevenly distributed across portion estimators.
We next generated box and whisker plots to graphically demonstrate the spread of length of interview in minutes (Figures 2a-c) and participant satisfaction (Figures 3a-c). The participant satisfaction score was calculated as the sum of two five-point Likert scales (i.e., very dissatisfied to very satisfied) for overall satisfaction with the interview experience and satisfaction specifically with the materials used. These non-parametric displays showed variations across key demographics (i.e., age, education) without making assumptions about the underlying statistical distribution and allowed for quick visualization of the mean, median, interquartile range, minimum and maximum values, and potential outliers. (18)
AMPM nutrient outcomes were stratified by gender and were first compared with the USDA’s WWEIA data tables. (19) Food group intakes (e.g., fruit, vegetable, dairy, protein foods) were compared with the agency’s Food Patterns Equivalents Database tables (20) to determine whether values were plausible and consistent with national data collected with the 2016 AMPM instrument. Two-way ANOVA was performed to test for statistically significant differences in AMPM outcomes by portion estimator used.
Results
Sample characteristics
Our sample frame included 624 addresses selected for potential contact on a rolling basis. Field staff succeeded in screening 377 individuals with 161 making appointments for AMPM interviews. The final number of AMPM interviews completed in participants’ homes was 133. Using American Association of Public Opinion Research (AAPOR) outcome rate definitions, (21) we determined our contact rate to be 33% and cooperation rate to be 84%. Our overall response rate was 27%.
Table 2 displays the demographic characteristics of the final sample. Among 133 participants, 41% percent were male and 59% were female. The sample was mostly middle-aged with 57% between the ages of 35 and 64 years old. Most participants were non-Hispanic Black (59%). Most participants had attained a high school diploma or greater (88%). According to US Census data, 62% of participants’ addresses were classified as urban, while 37% were rural.
Table 2 also displays the demographics of participants stratified by the portion estimator used. Twenty-six percent (26%) of participants were assigned to the AR tablet, 33% to the food models, and 40% to the booklet. No statistically significant differences were observed in age, race-ethnicity, or education by portion estimator assigned. There was a statistically significant difference in neighborhood density (i.e., location of participant home address) by portion estimator: more urban addresses were assigned the AR tablet and booklet than rural addresses (57% vs. 45% for AR tablet and 78% vs 22% for booklet, chi-square = 9.8, p-value = .0071).
Usability of AR tablet
Interviews took place most often on weekdays (66.2%) and in the afternoon (56.4%) and were administered in the participant’s living room or den (52.0%) followed by the kitchen (22.0%) and dining room (16.3%). Interviewers reported that 45% of participants used at least one item from their home to facilitate recall. We observed no statistically significant differences by portion estimator assigned for day, time, or place of interview at α level of 0.05 (data not shown).
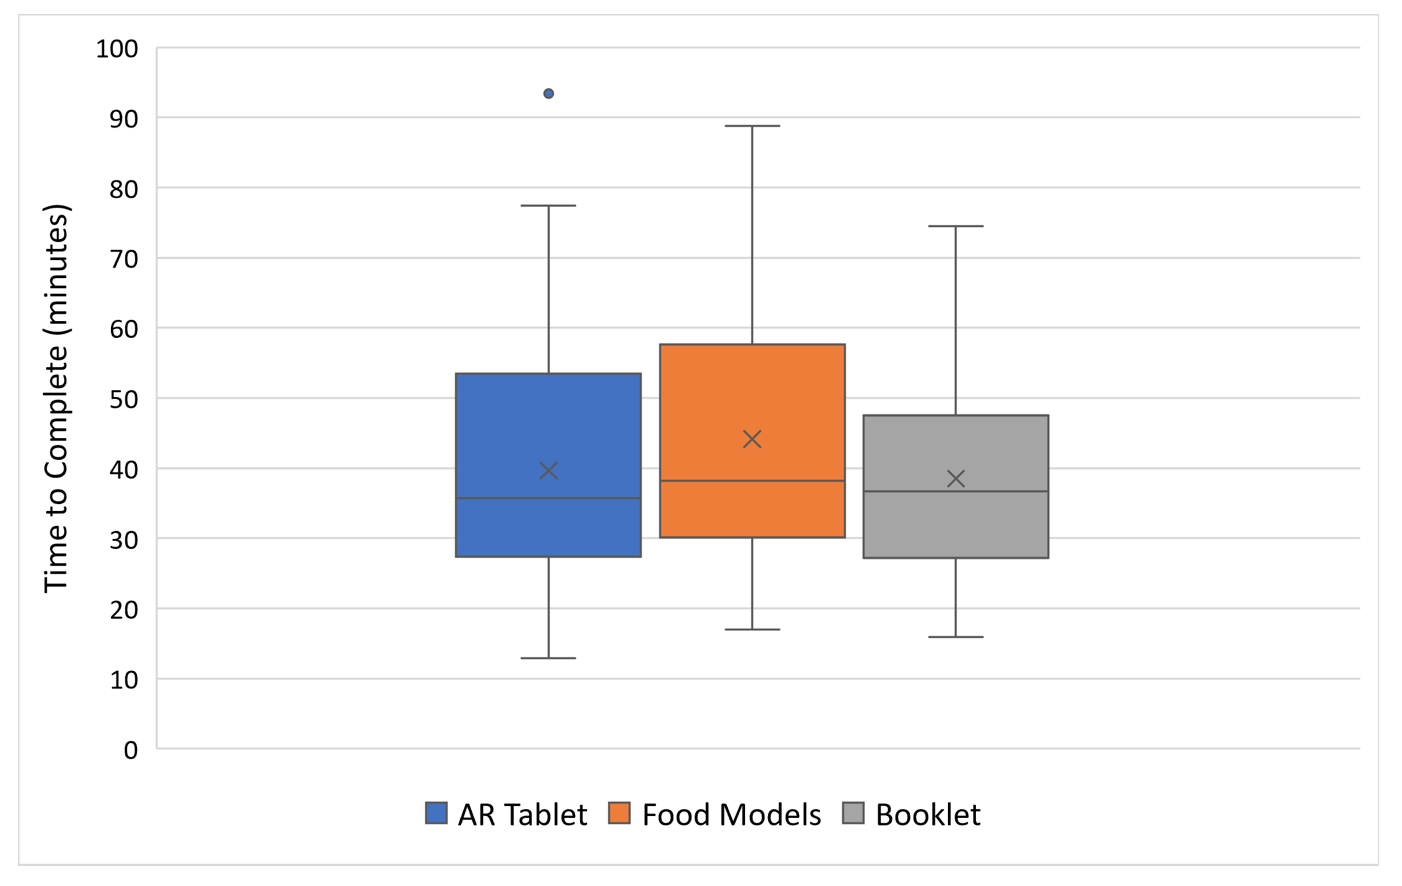
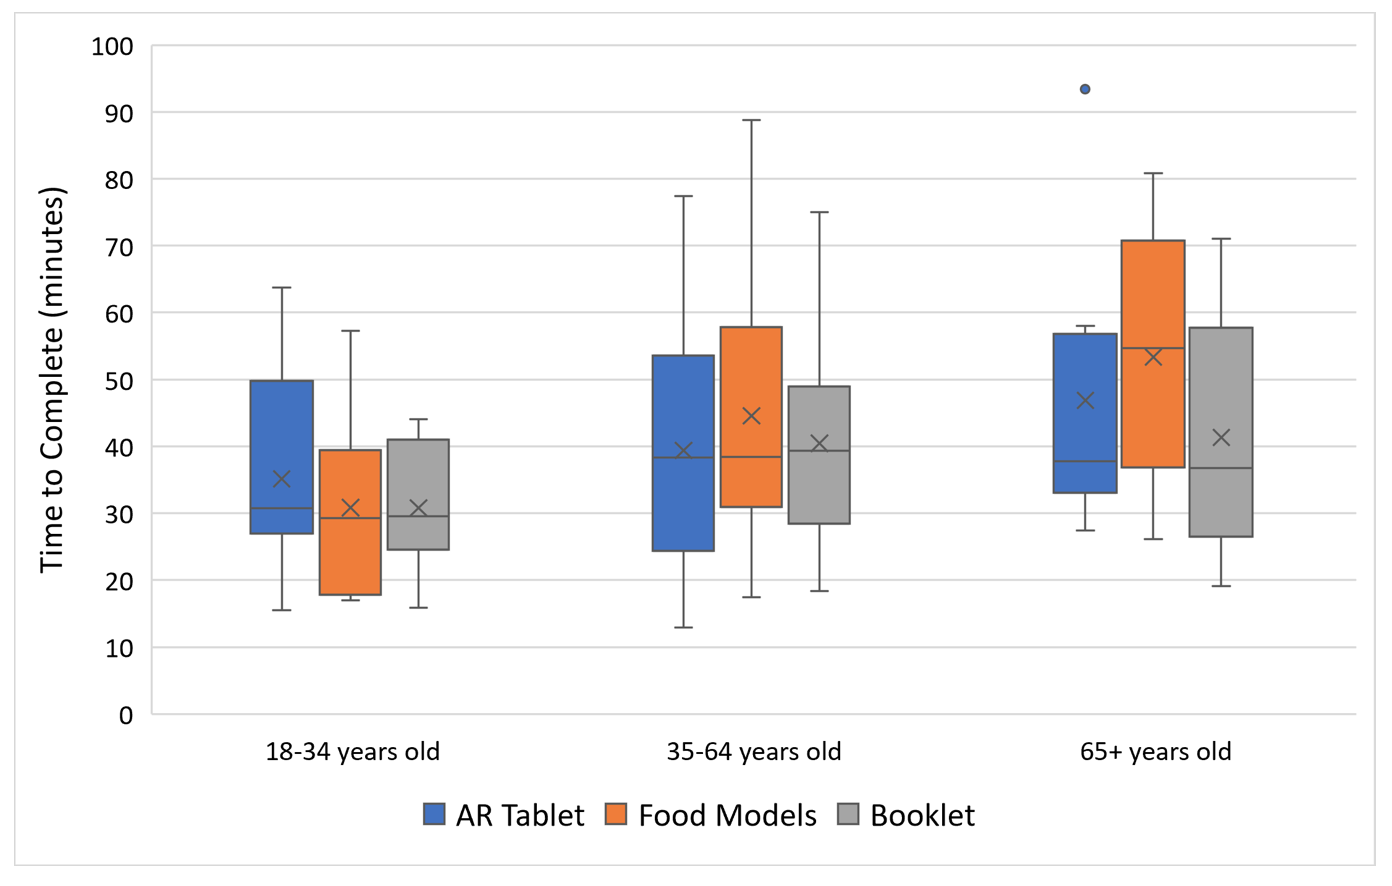
Overall, the average time to complete a dietary recall was 41 minutes and ranged from a minimum of 13 minutes to a maximum of 93 minutes with a standard deviation of 17 minutes. Figures 2a shows that completion times for interviews assigned to the AR tablet were similar to those using the food models and booklet. Further stratification of mode completion time by age group (Figure 2b) showed that the average time to complete the interviews was greatest for older adults, but results were not statistically significant at Comparisons of mode completion times within each age group also showed no significant differences. Stratification of mode completion time by education status also did not produce statistically significant differences at α level of 0.05 (Figure 2c).
Table 3 displays data on the use of materials from home to assist with recall. Among 55 participants who used materials, 19 completed their dietary interview with the AR tablet, 19 with food models, and 17 with the booklet. No statistically significant differences were observed by portion estimator used when stratified by age group or education.
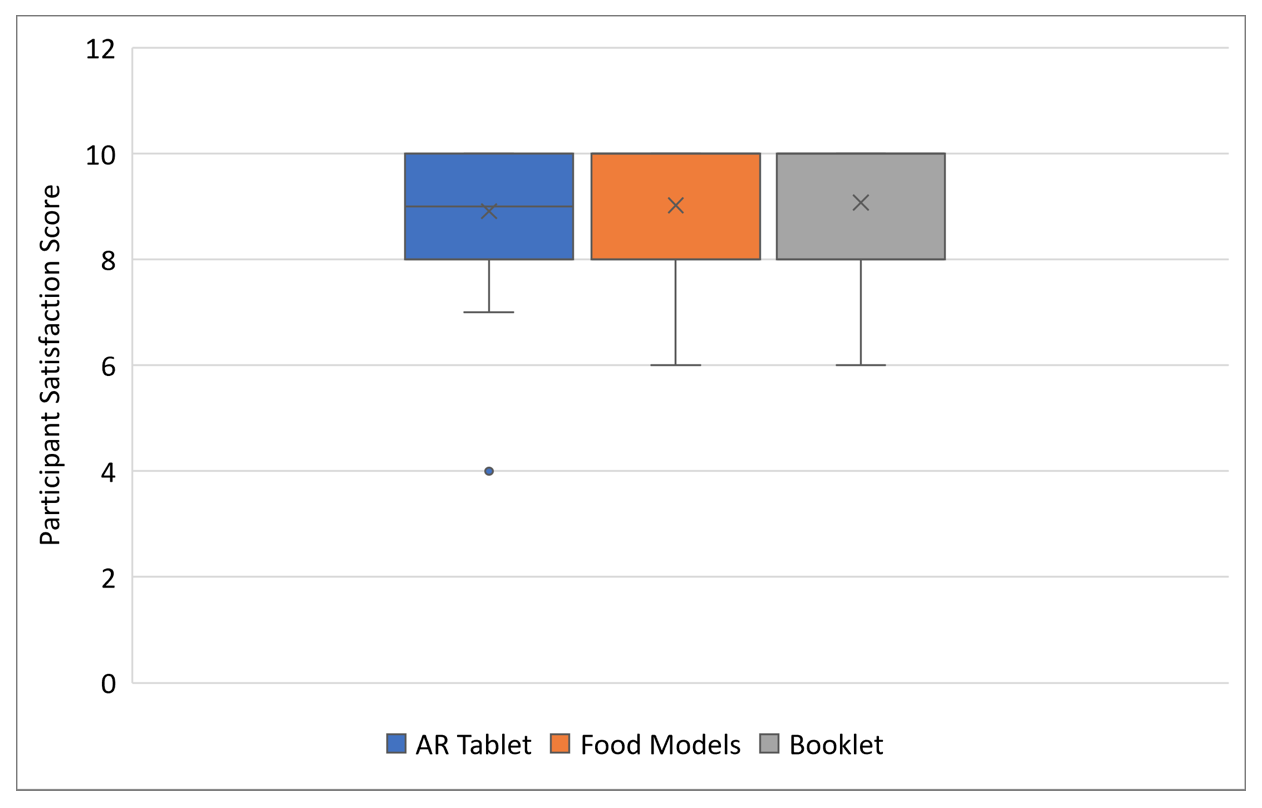
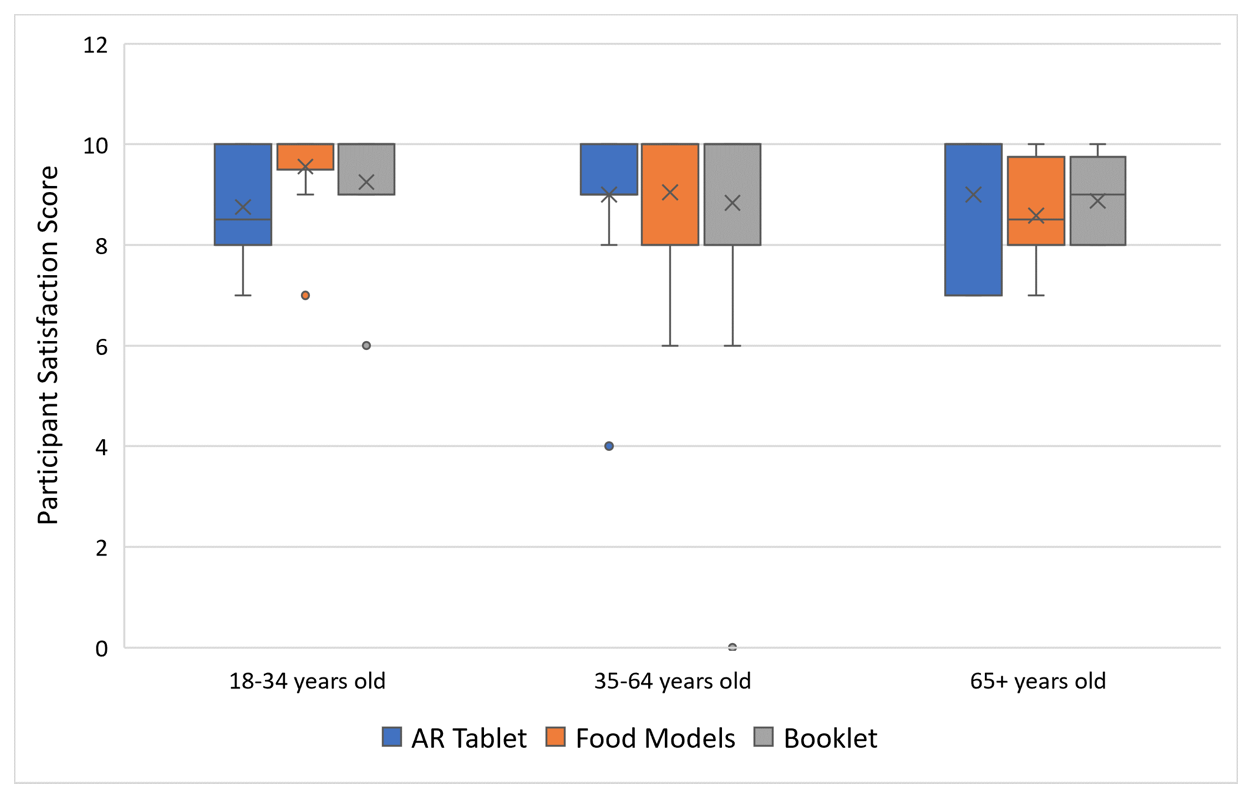
With regards to participant satisfaction, the overall mean score on a 10-point scale was 9.0 and ranged from a score of 4.0 to 10.0 with standard deviation of 1.2. Figure 3a displays the mean score stratified by portion estimator. No statistically significant differences were observed. Scores, even with transformation, were highly skewed to the left (i.e., tail at lower values) indicating high satisfaction with the AR tablet, food models, and booklet. No statistically significant pattern emerged when scores were further stratified by age (Figure 3b) or education (Figure 3c).
Comparisons of nutrient values
Food consumption values (i.e., average daily intake of food groups and average nutrient intake) were calculated after SurveyNet PIPS processing, auto coding, manual coding, and FNDDS processing. All food consumption values were within anticipated ranges except for a mean energy intake of 473 kilocalories (kcal) for one participant in the group assigned to use the AR tablet. Though unusual, this nutritional intake value was plausible and therefore kept in analyses.
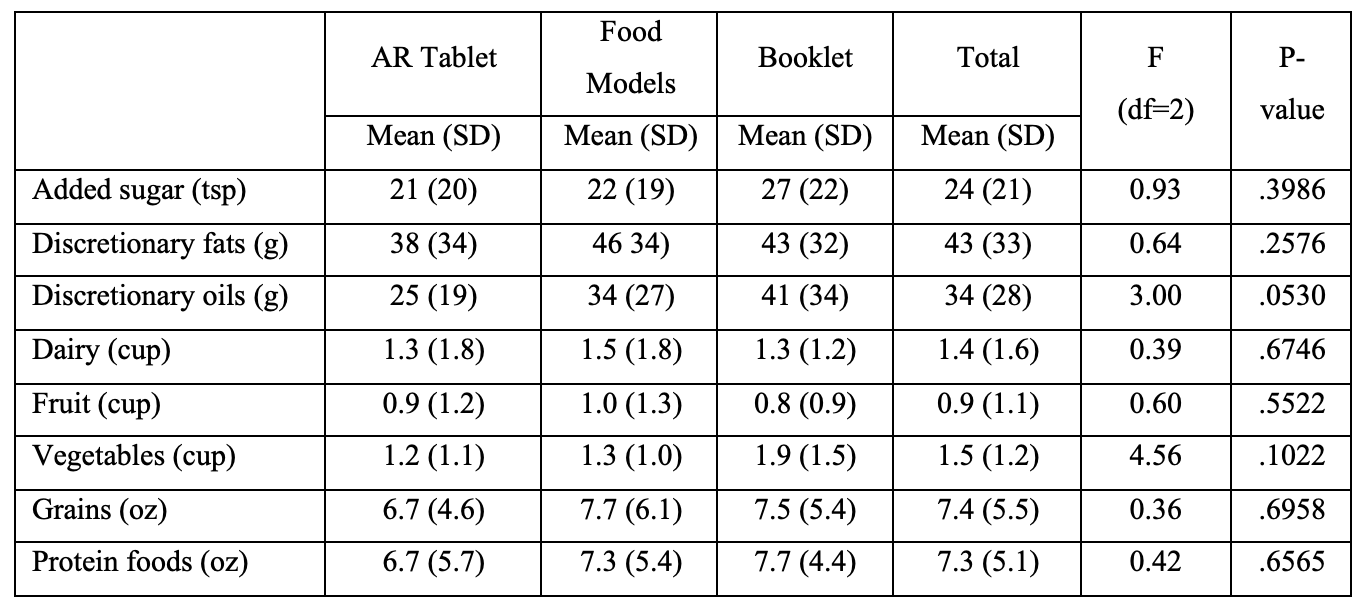
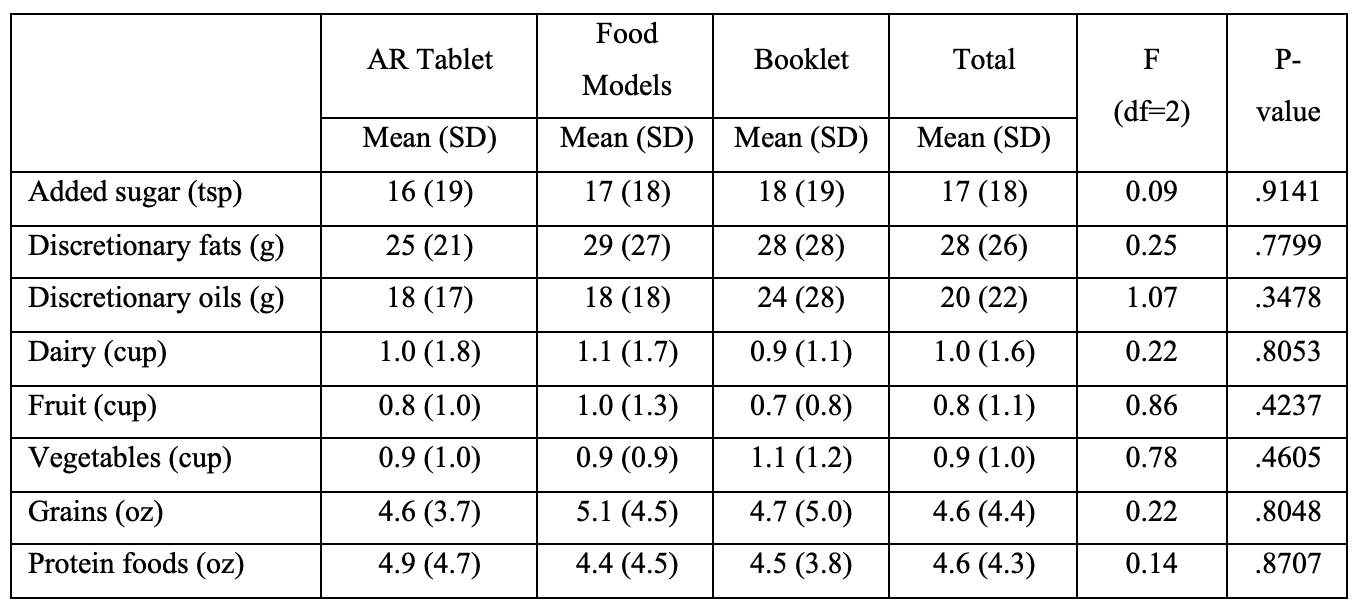
Tables 4a, 4b, and 4c present the means and standard deviations of average daily intake of food groups by portion estimator for all food eaten (Table 4a), food eaten at home (Table 4b), and food eaten away from home (Table 4c). The average values for discretionary oils among participants who used the AR tablet appeared lower compared to those who used food models and the booklet (p=.0530). No other statistically significant differences in daily intake of food groups were observed when the AR tablet was compared to the food models and booklet.
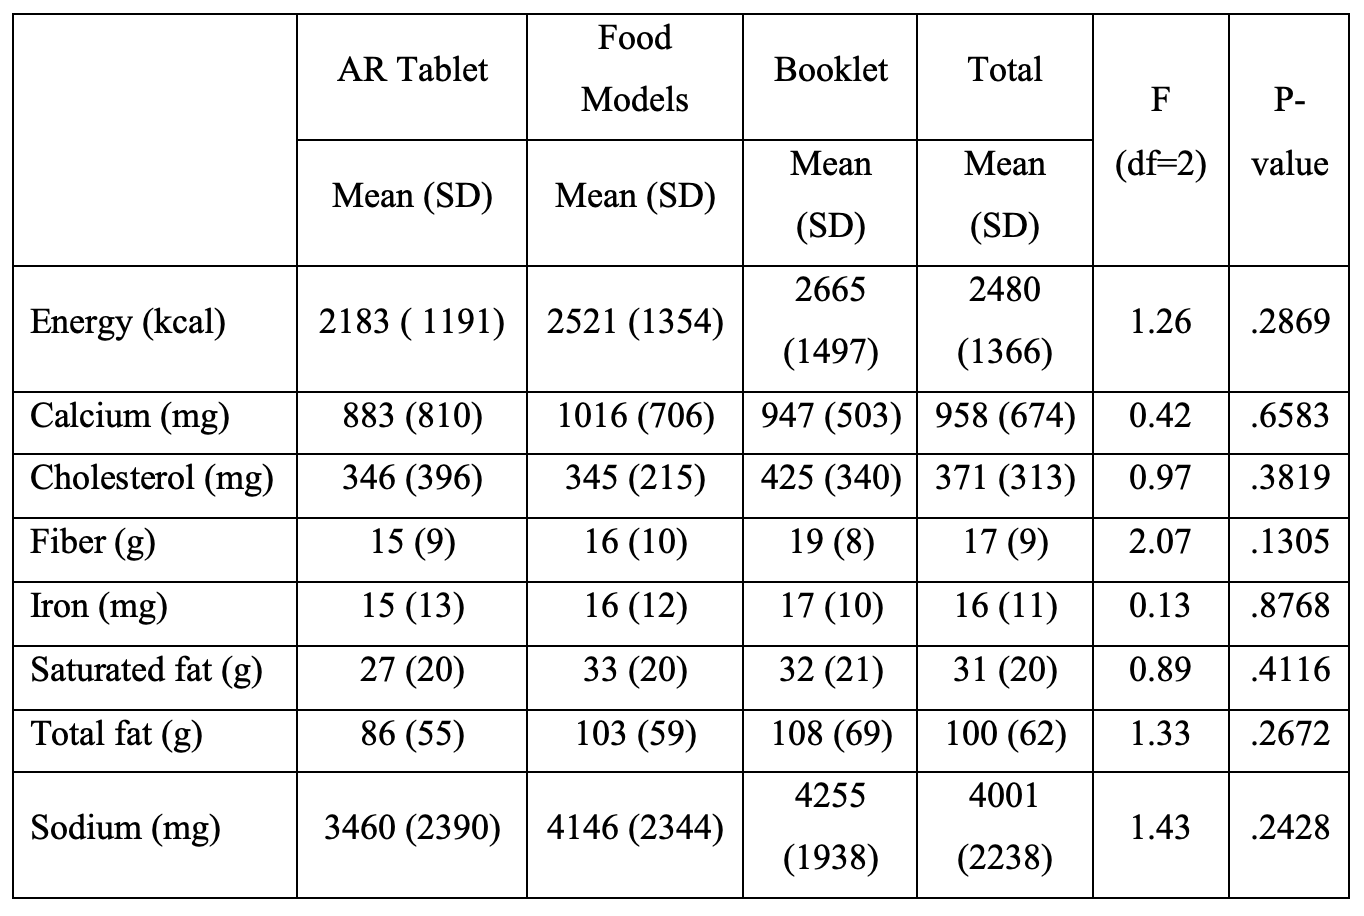
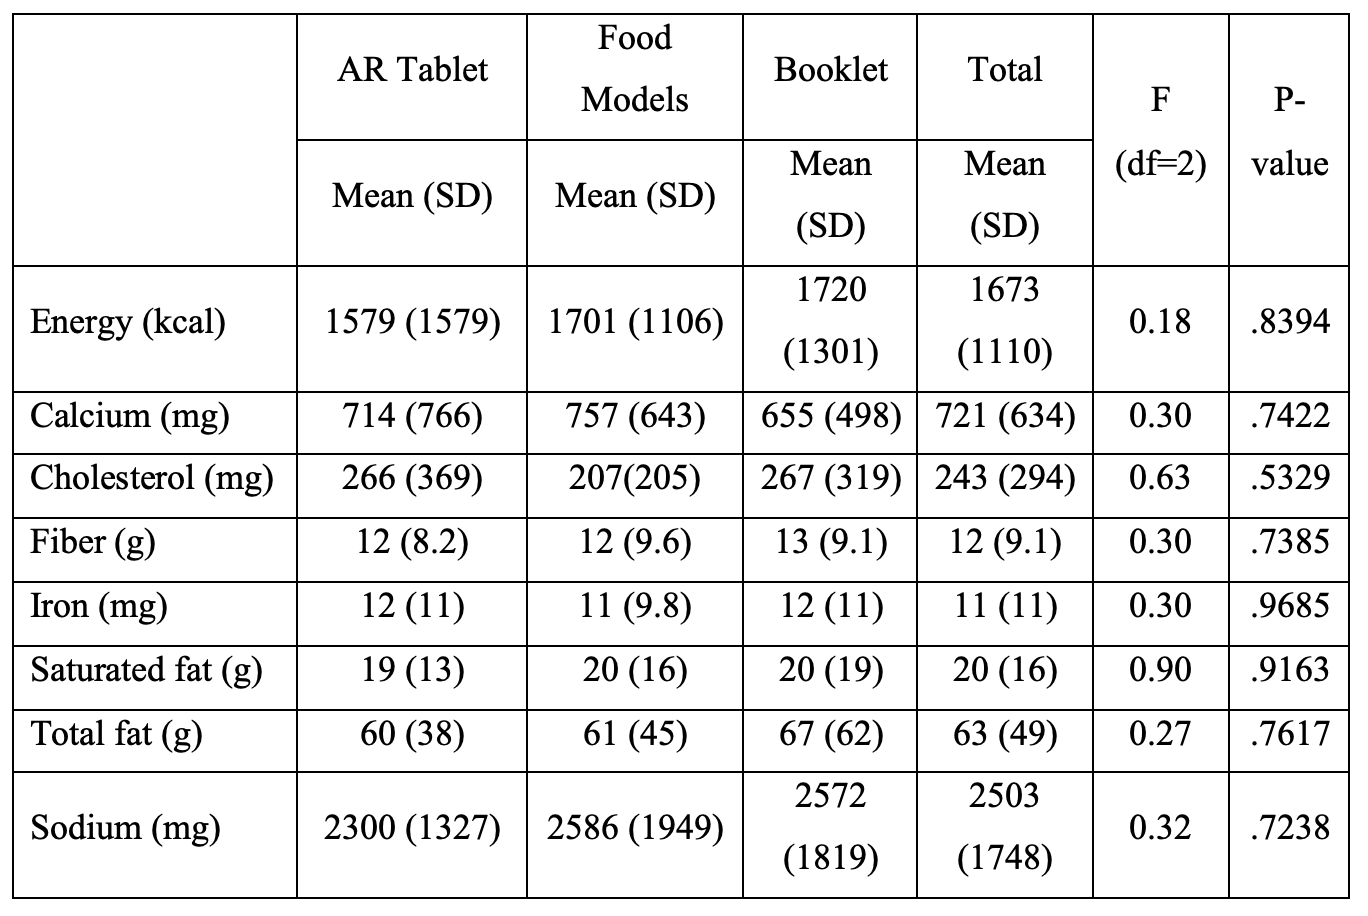
Tables 5a, 5b, and 5c present the means and standard deviations of average daily nutrient intake by portion estimator for all foods eaten (Table 5a), food eaten at home (Table 5b) and food eaten away from home (Table 5c). The average energy intake appeared to be lower among participants assigned to the AR tablet compared to those assigned to the food models and booklet. However, ANOVA tests did not produce statistically significant differences at α level of 0.05. Other mean nutrient values were similar across portion estimator assigned and where food was eaten except for a slightly lower, but not statistically significant, mean for cholesterol among AR tablet users for food eaten away from home.
Discussion
Debate on the use of digital technology in nutrition surveys has examined tools in their entirety and respondent willingness to use web-based tools or mobile devices. (22) Yet, for food consumption outcomes to be accurate, the specific component of any tool that is designed to capture portion size is critical. For example, Moshfegh and colleagues report that NHANES’ food models and the USDA booklet used during administration of the AMPM, along with commonly reported portions (e.g., slice of bread), contain over thirty thousand portion weights needed for the gram conversion of foods. (23)
This study found promise in the development of a transportable digital tool adapted from NHANES’ and USDA’s portion estimators. We met our objectives to determine the usability of an AR tablet and its comparability to traditional estimators. Tablet participants learned how to use the tablet to estimate their portions, completed AMPMs interviews, and reported satisfaction with the tablet. Though not normally a measure of usability, we extended our analyses with an examination of nutrient outcomes for all food, food eaten at home, and food eaten away from home. Investigating whether the AR tablet worked as well as food models or booklets to capture portions of food eaten at home or away from home merited study given the increasing reliance on fast food and limited-service restaurants that produce food high in calories, fat, and sodium. (24) Our results indicated there was negligible variation in average daily intake of various food groups and average nutrition intake by portion estimator. All values generated were plausible and within acceptable ranges whether the food was eaten at home or away from home.
Anecdotal information shared by interviewers during periodic debriefings with project investigators indicated participants’ ease with using the touch screen of the tablet to scroll through a variety of drinkware, dinnerware, and other estimators for selection, and the appeal of being able to examine the 3-dimensional objects at various angles in the AR environment. Still, some interviewers thought that older adults could find the tablet difficult to use as they were not accustomed to it or AR, but our results on time to complete and satisfaction among older participants did not indicate a usability issue for older adults. Interviewers also worried about the durability of the tablet and risk for breakage when transporting to multiple locations. Despite these concerns, no tablets sustained damage during our study. While traditional food models used with the AMPM have the advantage of being touched and held, transporting them and taking time for set up and breakdown can be a burden for interviewers; repeat use may also result in damage. The burden and effectiveness of sanitizing food models for use is also a concern given recent COVID-19 risks. Our study found participant satisfaction high across all interviews regardless of portion estimator assignment. Still, we believe that AR technology needs to advance before large-scale use due to occasional tablet “noise” (e.g., freezing of images). Future technological advances should focus on integration of the AMPM CAPI system with AR images on a tablet because, at the present time, using a laptop and tablet together seems to be unnecessarily complicated.
Our study has limitations including a lack of generalizability due to our sample size drawn from English-speaking adults living in North Carolina. Regional demographics, culture, and language prevent direct comparison to NHANES data publicly available for our year of data collection. Still, the USDA FSRG determined the dietary intake data obtained from this study were plausible and within expected limits. The study also faced a few challenges with suboptimal conditions observed in some participants’ homes (i.e., distractions and lack of table in about one-third of homes). These issues were allayed by experienced interviewers, but future studies could compare usability during AMPMs administered in the home to those administered in a more controlled setting such as an office or clinic. Finally, since this was a usability study of limited scope and funds, only one portion estimator was assigned per participant. A more robust study design could have each participant complete more than one dietary recall interview with different equipment. Although such a design might create issues with repeated measures, randomization and ample time between scheduled appointments may help address these potential problems.
We chose to use the USDA’s AMPM dietary recall instrument for this usability study of AR technology given its use at the national level in NHANES, but other 24-hour dietary recall instruments, food records, food frequency questionnaires, and screeners may also benefit from integrating AR technology (25). We conclude that augmented reality is an innovative method worth further investigation. As members of the public become more accustomed to advancements in digital technology, we hope investments in research on the part of data scientists, survey researchers, and nutritional epidemiologists will build upon lessons learned in this study to determine whether the technology can be used on a larger scale in community settings.
Table 1. Stages of the USDA’s computer-based Automated Multiple-Pass Method
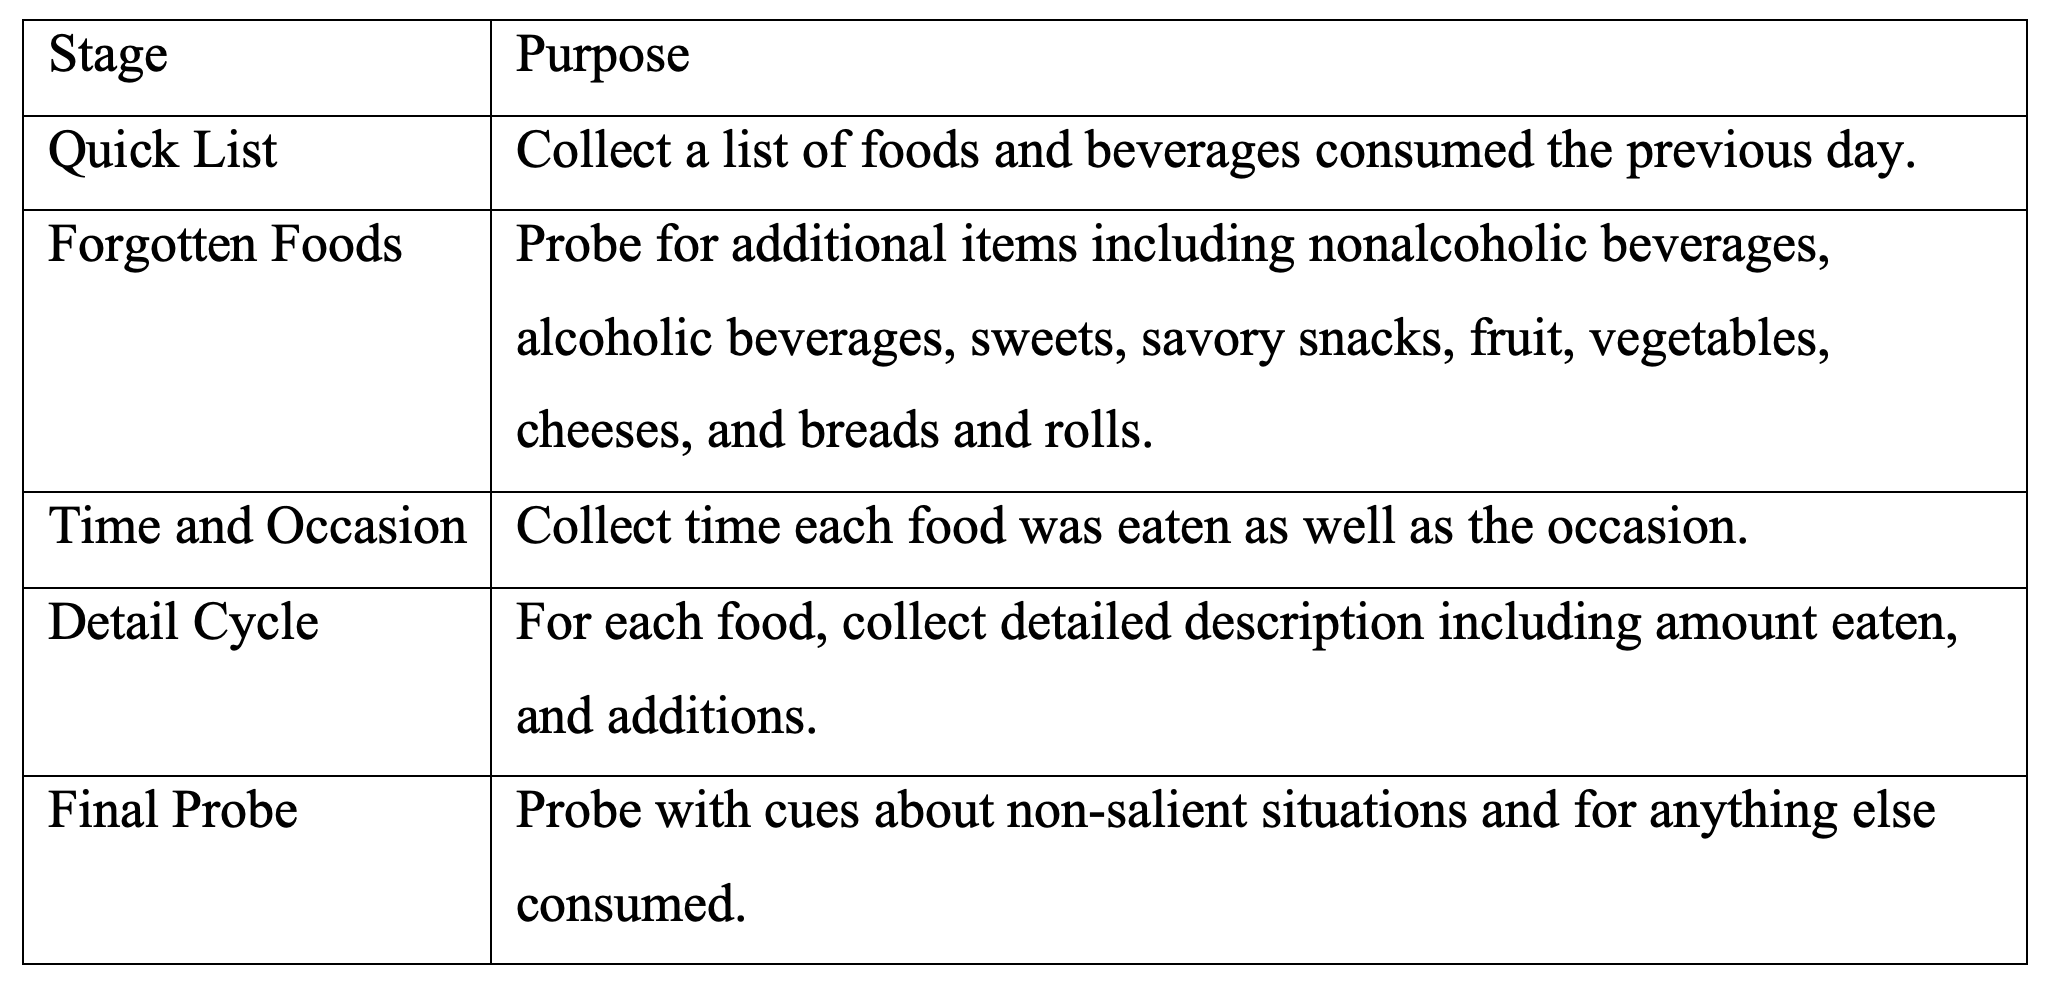
Figure 1. Portion estimators
1a. Augmented reality (AR) tablet demonstrating scrollable menu and participant selection of a mug and fill line
1b. Examples of 3D food models including plate, glass, mug, measuring tools, and a food mound
1c. Page illustrating three glass sizes and fill lines in Tab 4 of the USDA Food Model Booklet
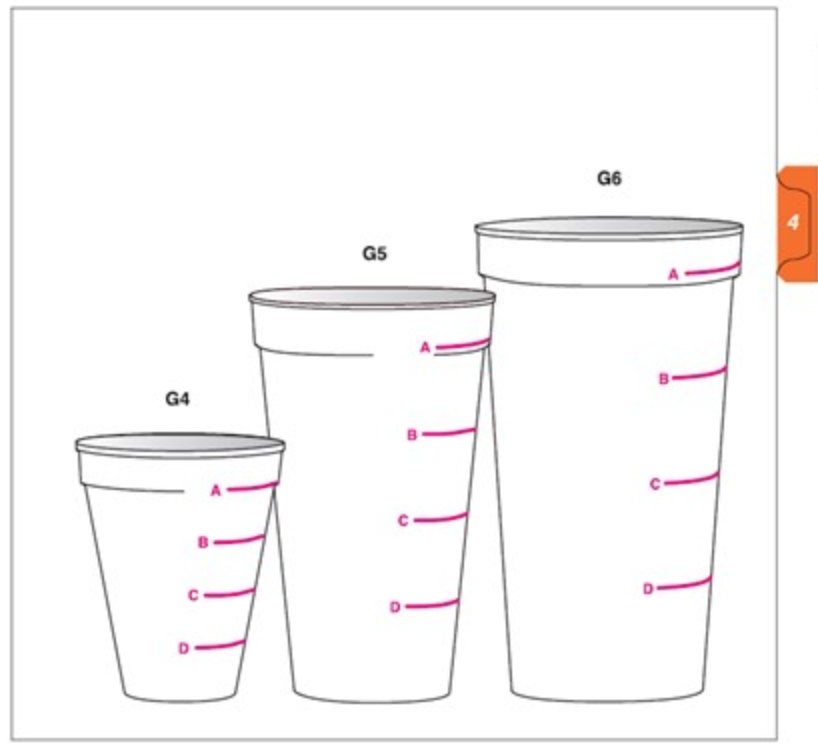
Table 2. Demographic characteristics of study sample by portion estimator
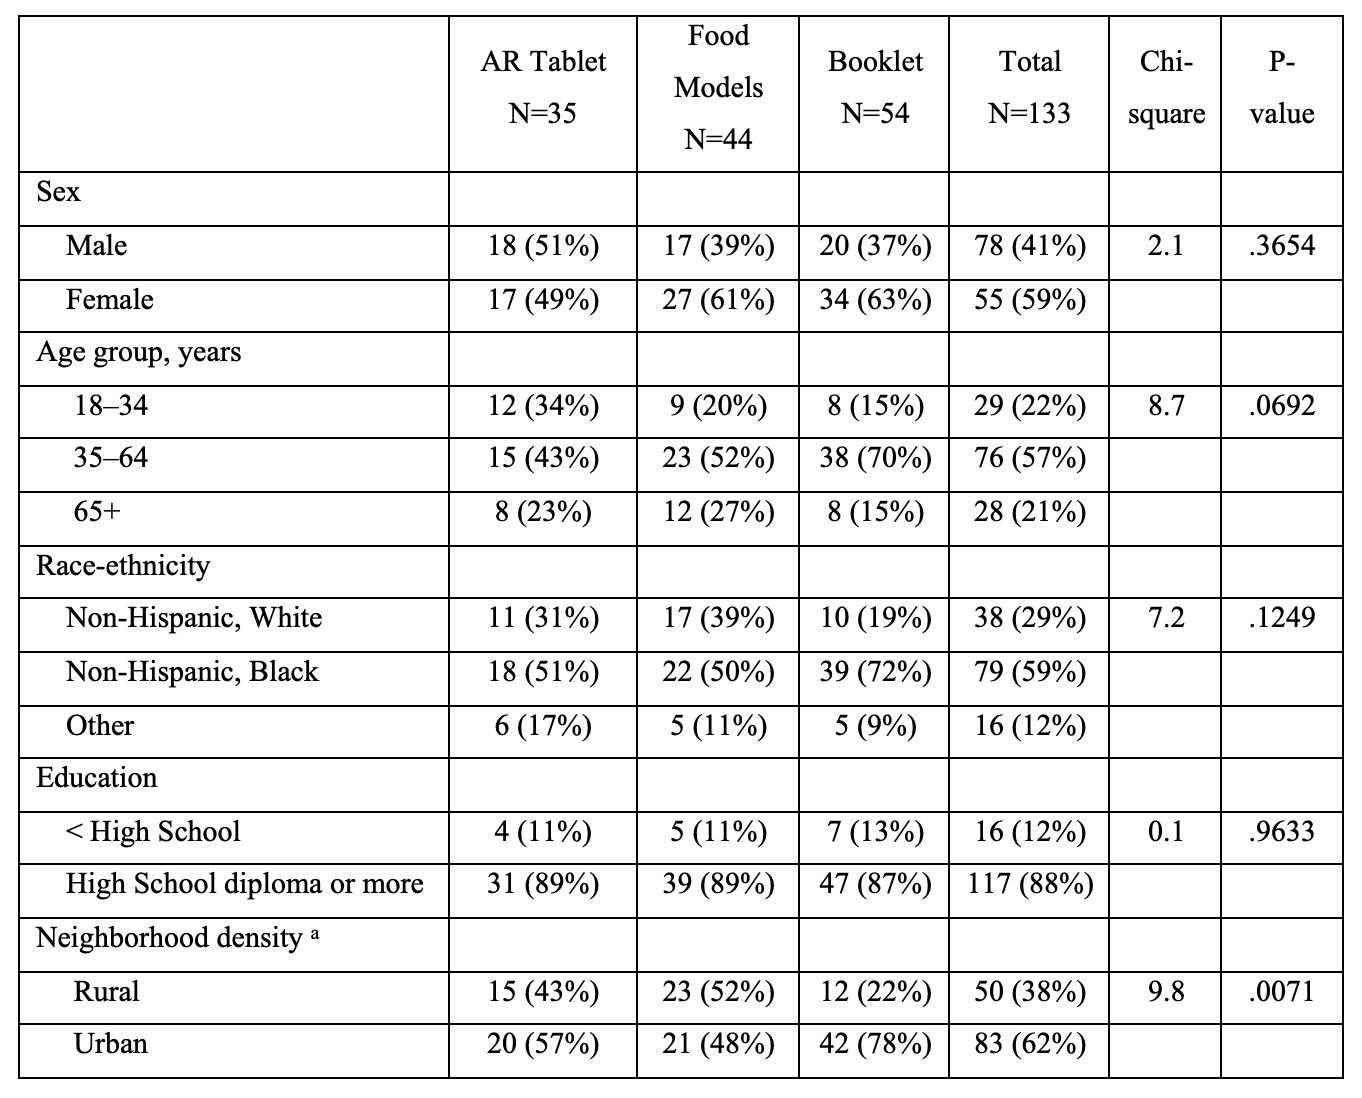
a Source: US Census Bureau, 2010.
Figure 2. Box and whisker plot representations a of time to complete AMPM by portion estimator (2a) and age group (2b) or education (2c)
2a. Portion Estimator
2b. Age Group
2c. Education
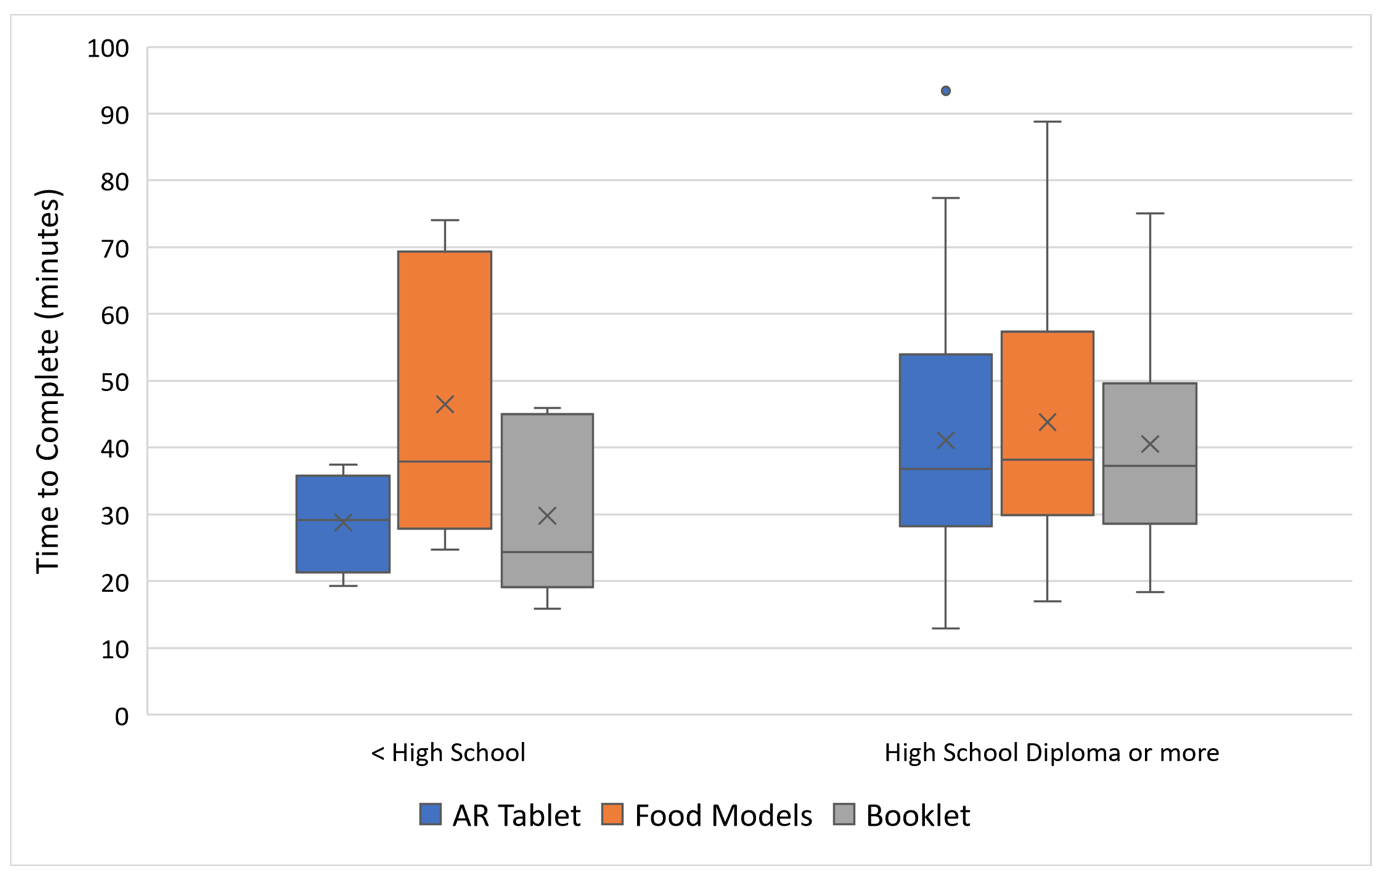
a Boxes represent the lower and upper fourth of a distribution while the line and ”X” within the box represent the median and mean, respectively. The lines at the top and bottom of the whiskers represent lower and upper extreme values. Dots outside boxes and whiskers represent outliers.
Table 3. Use of materials from home to assist with recall by portion estimator, age group, and education
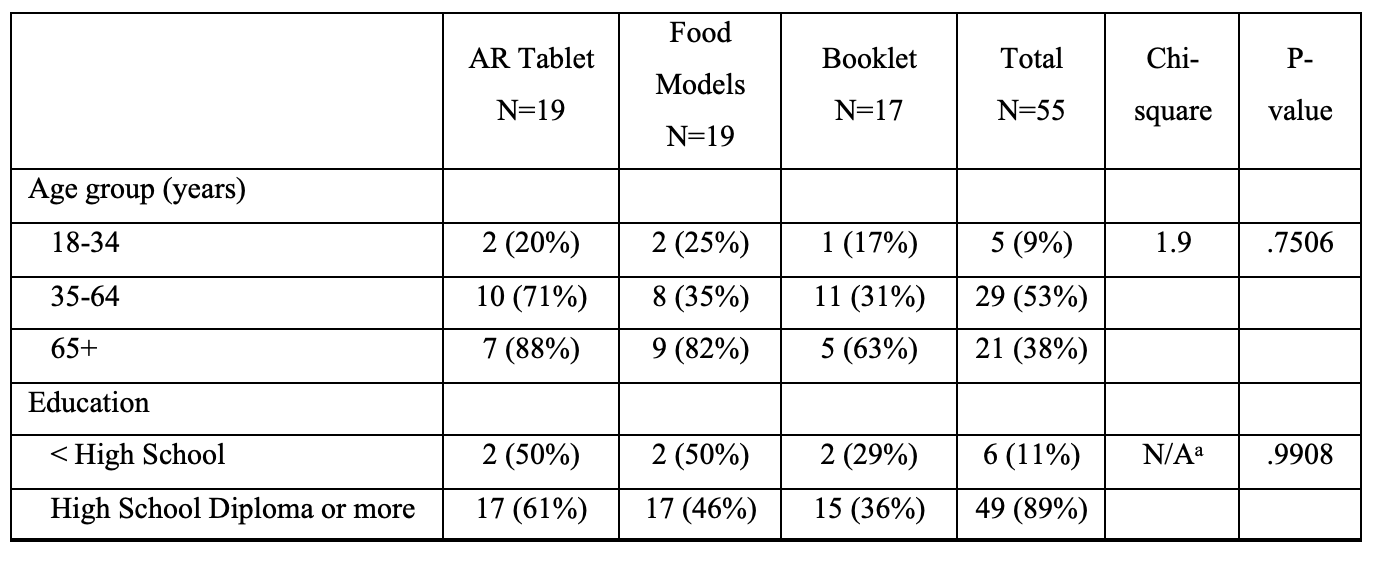
a Fisher’s exact test was performed due to small cell sizes.
Figure 3. Box and whisker plot representations a of participant satisfaction by portion estimator (3a) and age group (3b) or education (3c)
3a. Portion Estimator
3b. Age Group
3c. Education
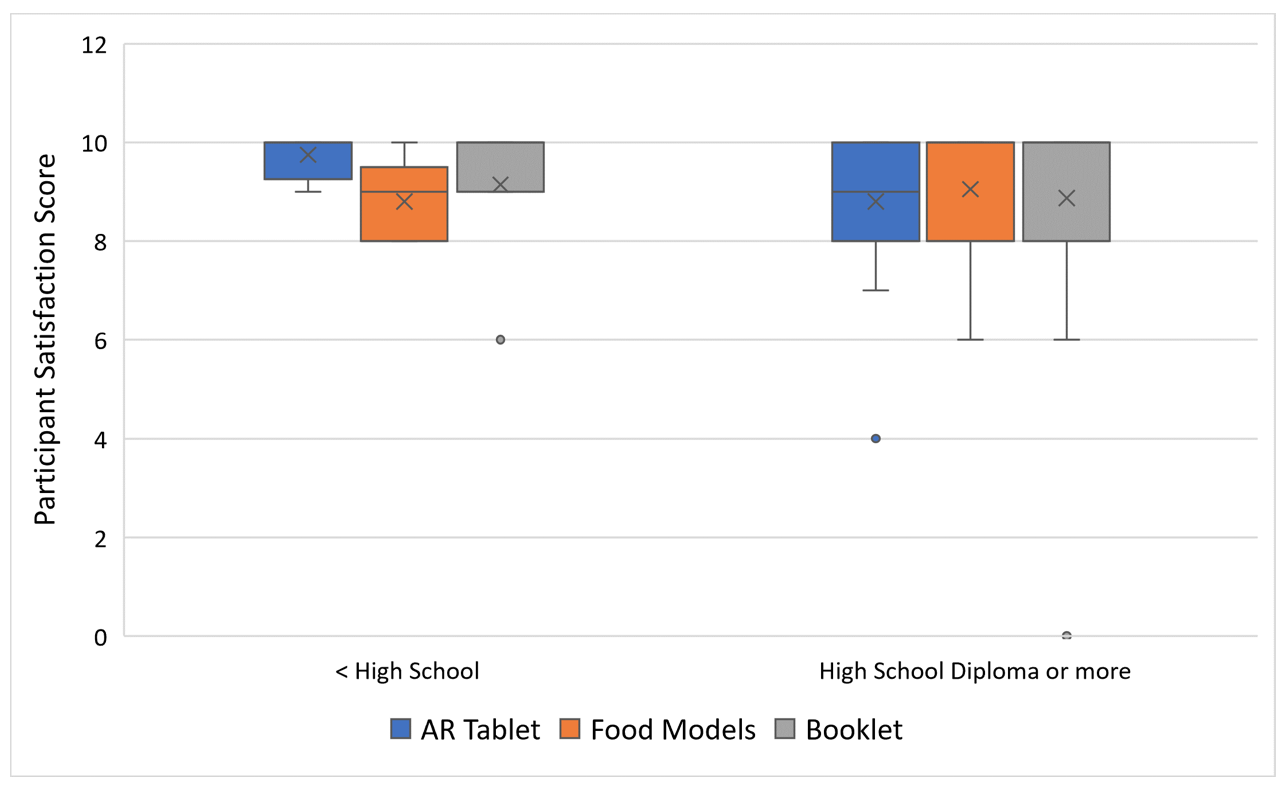
a Boxes represent the lower and upper fourth of a distribution while the line and “X” within the box represent the median and mean, respectively. The lines at the top and bottom of whiskers represent lower and upper extreme values. Dots outside boxes and whiskers represent outliers. High satisfaction scores have skewed the data such that upper whiskers are sometimes not included.
Table 4. Average daily intake of food groups by portion estimator and where food was eaten
4a. All food eaten
4b. Food eaten at home
4c. Food eaten away from home
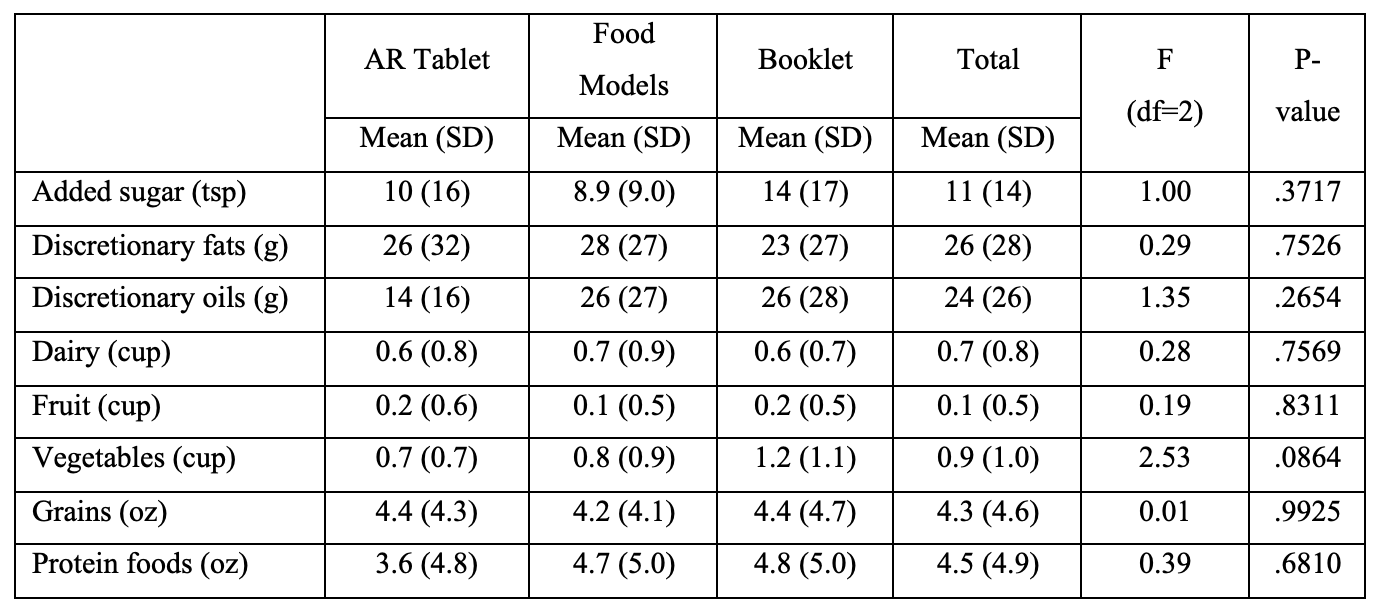
Abbreviations: tsp=teaspoons, g=grams, oz=ounces, df=degrees of freedom, SD=standard deviation.
Table 5. Average daily nutrient intake by portion estimator and where food was eaten
5a. All food eaten
5b. Food eaten at home
5c. Food eaten away from home
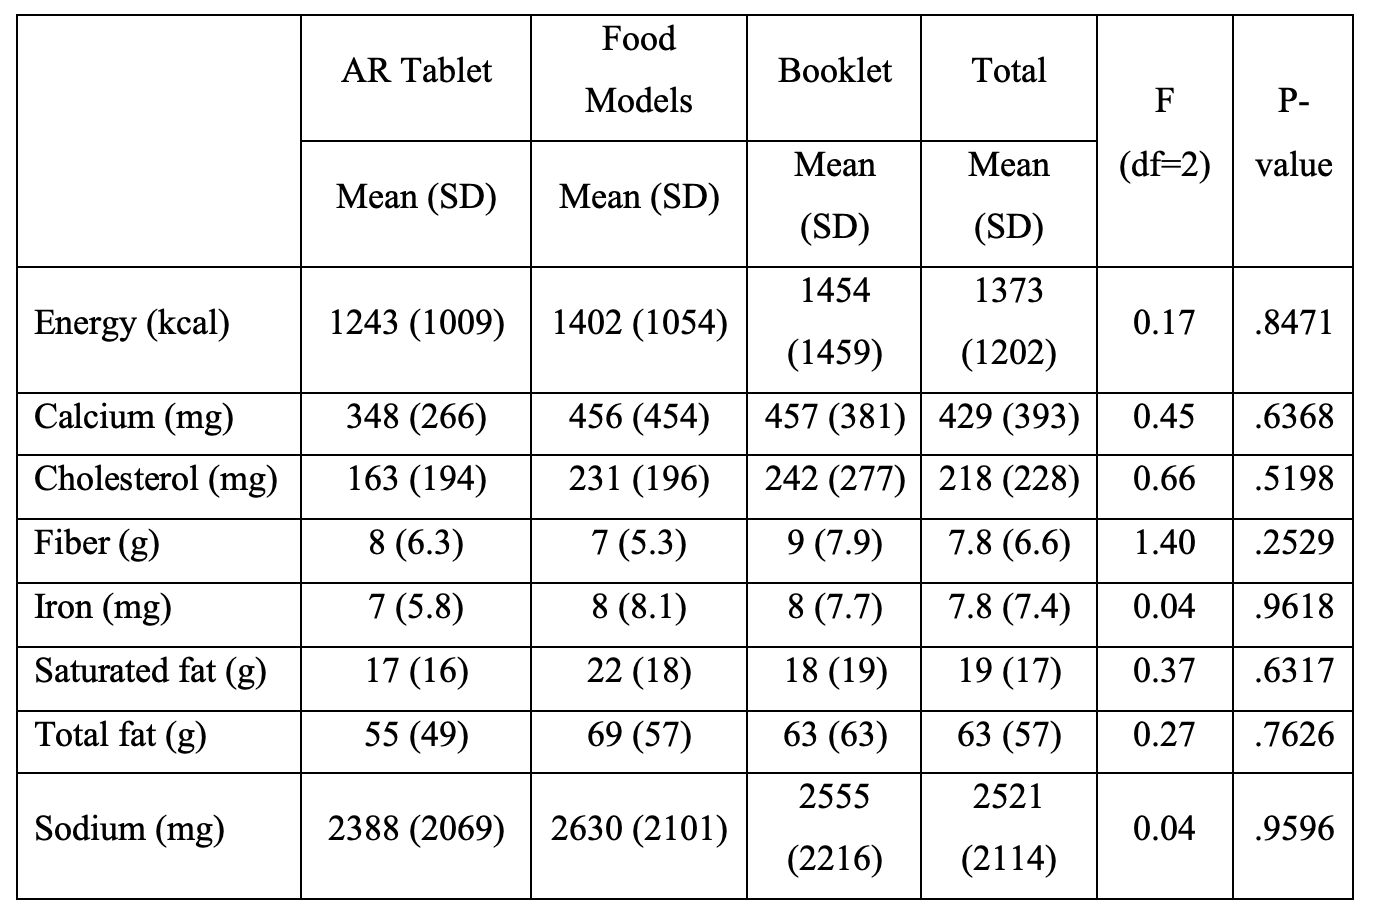
Abbreviations: kcal=kilocalories, mg=milligrams, g=grams.
References
- Castell, G.S., Serra-Majem, L., Ribas-Barba, L. What and how much do we eat? 24-hour dietary recall method. Nutricion hospitalaria. 2015 Feb 26;31 Suppl 3:46-8.
- Naska A., Lagiou A., Lagiou P. Dietary assessment methods in epidemiological research: current state of the art and future prospects. F1000Res. 2017 Jun 16; 6:926.
- Measuring Guides for the Dietary Recall Interview. National Health and Nutrition Examination Survey, Centers for Disease Control and Prevention. https://www.cdc.gov/nchs/nhanes/measuring_guides_dri/measuringguides.htm (accessed on October 31, 2022).
- ASA24 Portion Size Image Database. National Cancer Institute. https://epi.grants.cancer.gov/asa24/resources/portionsize.html (accessed on October 31, 2022).
- Stumbo P.J. New technology in dietary assessment: a review of digital methods in improving food record accuracy. Proceedings of the Nutrition Society. 2013 Feb;72(1):70-6.
- Martin C.K., Nicklas T., Gunturk B., Correa J.B., Allen H.R., Champagne C.J. Measuring food intake with digital photography. Hum Nutr Diet. 2014 Jan;27 Suppl 1(0 1):72-81.
- Höchsmann C., Martin C.K. Int J Obes (Lond). Review of the validity and feasibility of image-assisted methods for dietary assessment. 2020 Dec;44(12):2358-2371.
- Doulah, A., McCrory, M.A., Higgins, J.A., Sazonov, E. A Systematic Review of Technology-Driven Methodologies for Estimation of Energy Intake. IEEE Access. 2019 (7):49653-49668.
- Raju, V.B. and Sazonov, E. A systematic review of sensor-based methodologies for food portion size estimation. IEEE Sensors Journal 21.11, 2020: 12882-12899.
- Minaee S., Liang X., Yan S. Modern Augmented Reality: Applications, Trends, and Future Directions. arXiv preprint arXiv:2202.09450. 2022 Feb 18.
- Villagran-Vizcarra D.C., Luviano-Cruz D., Pérez-Domínguez L.A., Méndez-González L.C., Garcia-Luna F. Applications Analyses, Challenges and Development of Augmented Reality in Education, Industry, Marketing, Medicine, and Entertainment. Applied Sciences. 2023 Feb 21;13(5):2766.
- Kaviyaraj R., Uma M. Augmented Reality Application in Classroom: An Immersive Taxonomy. In2022 4th International Conference on Smart Systems and Inventive Technology (ICSSIT) 2022 Jan 20 (pp. 1221-1226). IEEE.
- Bollen, E., Awad, L., Langridge, B., Butler, P.E.M. The intraoperative use of augmented and mixed reality technology to improve surgical outcomes: A systematic review. Int J Med Robot. 2022 Dec; 18(6): e2450.
- Rahman M.M., Tabash M.I., Salamzadeh A, Abduli S., Rahaman M.S. Sampling techniques (probability) for quantitative social science researchers: conceptual guidelines with examples. Seeu Review. 2022;17(1):42-51.
- DiGrande, L., Pedrazzani, S., Kinyara, E., Hymes, M., Karns, S., Rhodes, D., and Moshfegh, A. Field Interviewer-Administered Dietary Recalls in Participants’ Homes: A Feasibility Study Using the US Department of Agriculture’s Automated Multiple-Pass Method. RTI Press Publication No. MR-0045-2105. Research Triangle Park, NC: RTI Press, 2021.
- Moshfegh, A.J., Rhodes, D.G., Baer, D.J., Murayi, T., Clemens, J.C., Rumpler, W.V. et al. The US Department of Agriculture Automated Multiple-Pass Method reduces bias in the collection of energy intakes. Am J Clin Nutr 2008; 88(2):324–32.
- Raper N., Perloff B., Ingwersen L., Steinfeldt L, Anand J. An overview of USDA’s dietary intake data system. Journal of food composition and analysis. 2004 Jun 1;17(3-4):545-55.
- Wickham H., Stryjewski L. 40 years of boxplots. Am. Statistician. 2011 Dec:2011.
- What We Eat in America. Food Surveys Research Group, US Department of Agriculture. https://www.ars.usda.gov/northeast-area/beltsville-md-bhnrc/beltsville-human-nutrition-research-center/food-surveys-research-group/docs/wweianhanes-overview (accessed on April 12, 2021).
- Bowman S.A., Clemens J.C., Friday J.E., Lynch K. L, Moshfegh A.J. Food Patterns Equivalents Database 2013–14: methodology and user guide. Beltsville, MD: Food Surveys Research Group. 2017 May 26.
- Association for Public Opinion Research. Standard definitions: final dispositions of case codes and outcome rates for surveys. 9th ed. Washington (DC): AAPOR; 2016.
- Amoutzopoulos, B., Steer, T., Roberts, C., Cade, J.E., Boushey, C.J., Collins, C.E., et al. Traditional methods v. new technologies – dilemmas for dietary assessment in large-scale nutrition surveys and studies: a report following an international panel discussion at the 9th International Conference on Diet and Activity Methods (ICDAM9), Brisbane, 3 September 2015.
- Moshfegh, A.J., Rhodes, D.G., Martin, C.L. National Food Intake Assessment: Technologies to Advance Traditional Methods. Annual. Review of Nutrition. 2022; 42:401–22.
- Saksena, M.J., Okrent, A..M, Anekwe, T.D., Cho, C., Dicken, C., Effland, A., et al. America’s Eating Habits: Food Away from Home, EIB-196, Saksena, M., Okrent, A.M., and Hamrick, K.S., eds. U.S. Department of Agriculture, Economic Research Service, September 2018.
- Dietary Assessment Instrument Profiles. Dietary Assessment Primer, National Cancer Institute, https://dietassessmentprimer.cancer.gov/profiles/. Accessed on October 31, 2022.
-
Keywords
calibration CATI coverage coverage bias cross-national surveys data linkage data quality European Social Survey experiment face-to-face face-to-face survey Facebook hard to reach populations incentives item nonresponse measurement measurement error mixed-mode surveys multitasking non-probability samples Nonresponse nonresponse bias nonresponse rates paradata PIAAC Probability sample probability samples QR codes rare populations response rate Satisficing social desirability Social media survey survey-taking climate survey data survey management survey methods Telephone survey telephone surveys total survey error unit nonresponse validity web survey Web surveys weighting
