

Design of multiple open-ended probes in cognitive online pretests using web probing
Neuert, C. & Lenzner, T. (2023). Design of multiple open-ended probes in cognitive online pretests using web probing. Survey Methods: Insights from the Field. Retrieved from https://surveyinsights.org/?p=17866
© the authors 2023. This work is licensed under a Creative Commons Attribution 4.0 International License (CC BY 4.0) 
Abstract
When asking multiple open-ended probes on the same target question in a cognitive online pretest, they can either be displayed on a subsequent survey page (scrolling design), on separate following pages (paging design), or on the same page as the target question (embedded design). This paper examines how multiple probes to the same target question should be implemented in web probing studies. Based on a sample of 2,300 respondents from an online access panel, we compared the three designs in terms of data quality (dropouts, probe nonresponse, uninterpretable answers, word count) and the response distribution of the target questions. Overall, we found none of the designs to be clearly superior to the others with regard to the data quality indicators. Comparing the three designs depending on the device used to answer the survey, we found differences in the probability to abandon the survey, which was significantly higher for respondents on mobile devices compared to PC respondents in the paging design, while there was no difference between devices for the embedded and scrolling designs. Item nonresponse to the target question was significantly higher for some items in the embedded design than in the paging design, but other than that, we found no differences in response distributions of the target question between designs.
Keywords
(web) probing, cognitive online pretest, implementation of probes, open-ended questions, visual design
Copyright
© the authors 2023. This work is licensed under a Creative Commons Attribution 4.0 International License (CC BY 4.0)
Introduction
Today, it is generally acknowledged that newly developed survey questions require some form of pretesting before they are fielded. Survey methodologists have several methods at hand for evaluating survey questions, with cognitive interviewing being the most popular one for examining respondents’ cognitive processes (Beatty & Willis, 2007; Presser et al., 2004). In cognitive interviewing, respondents are asked to think aloud or to answer probes with the aim of understanding how they arrive at their answer to a question and whether they interpret it as intended by the question designers (Beatty & Willis, 2007; Collins, 2015; Willis, 2004). A more recent method to evaluate survey questions, which evolved from cognitive interviews, is web probing (Lenzner & Neuert, 2017; Meitinger & Behr, 2016). In this method, the follow-up questions typically used in cognitive interviews are implemented as open-ended or closed probes in a self-administered web survey (Behr et al., 2012, 2017). Usually, one probe targets one specific aspect of the question under evaluation. Thus, if several aspects of a question or item are of interest or several items of an item battery are tested, multiple follow-up probes must be asked (Meitinger et al., 2018).
Common cognitive probes are comprehension probes on the meaning of a specific term (e.g., What does the term x mean to you?), recall probes (e.g., How did you remember that you went to the doctor x times in the past 12 months?), general probes, in which respondents elaborate on their response in more detail (e.g., How did you arrive at your answer?), or category-selection probes on the reasons why a certain answer category was chosen (e.g., You said that you ‘fully’ agree with this statement. Why did you choose this answer?; Prüfer & Rexroth, 2005; Willis, 2004).
In contrast to ‘in-person’ cognitive interviewing, web probing does not involve a cognitive interviewer, and respondents have to answer the probes in a self-administered form. Hence, the visual design of the probes is crucial to guide the respondents and to facilitate the response task (Dillman et al., 2014). This is particularly the case as the majority of probes in web probing studies are implemented as open-ended questions, which pose an additional burden on respondents (e.g., Meitinger et al., 2018; Neuert, Meitinger & Behr, 2021). Compared to closed questions and probes, open-ended ones suffer from lower data quality, such as higher item nonresponse (Neuert et al., 2021; Reja et al., 2003) and dropout rates (Crawford et al., 2001).
To improve the quality of the responses, it is generally recommended that open-ended probes be designed in a way that they are perceived as part of the question sequence and that the burden on respondents is kept to a minimum by not requiring additional effort beyond answering (Behr et al., 2012; Holland & Christian, 2009). This includes, for instance, that when the probe is displayed on the following page, the target item and the respondents’ answers should be repeated together with the probe (Behr et al., 2012). For the same reason, web probing studies typically apply concurrent probing, meaning that respondents first answer a survey question followed by one or more probes on the next survey page(s) instead of retrospective probing, in which respondents only receive the probes after answering the entire questionnaire (i.e., Lenzner et al., 2018; Neuert & Lenzner, 2014). With the latter approach, however, there is less concern that the probes will impact the answers to the survey questions (Fowler & Willis,2020). While the popularity of web probing is growing, there are still open questions regarding the ideal design of the probes. The one we address in this article is how multiple open-ended probes on the same target question should be implemented and presented to respondents to provide the most valuable insights.
In the following, we first present previous research on asking multiple (open-ended) questions and then introduce our research question and hypotheses. In the methods section, we outline the design of the experiment, describe our sample and data collection procedures, and the questions and data quality indicators used. Finally, we report the results for each indicator and discuss the implications of the findings.
Literature Review
Using open-ended questions can provide rich information on respondents’ attitudes and evaluations (Singer & Couper, 2017), which helps improve the data quality of questions under evaluation. However, implementing open-ended questions or probes often comes at the cost of a higher response burden as answering them is cognitively more demanding for respondents. Respondents have to report their answer in their own words and, in self-administered surveys, type/write it manually into a text box (Dillman, Smyth, Christian, 2009).
The use of open-ended questions leads to higher rates of missing data, probably due to the higher effort involved in reporting answers in one’s own words (Dillman et al., 2009; Reja et al. 2003) and the related ability and motivation of respondents to do this conscientiously (Schmidt et al. 2020; Scholz & Zuell 2012; Schuman and Presser 1979). Nevertheless, several studies demonstrated that respondents provide high-quality answers in response to open-ended probes, even if the effort required from them is high (Lenzner & Neuert, 2017; Behr & Meitinger, 2016; Kunz & Meitinger, 2022). For example, Neuert and Lenzner (2021) have found that asking more open-ended probes in a survey added an additional burden on respondents. The authors varied the overall number of probes asked in a web survey experiment and found that more respondents in the condition with the higher number of probes abandoned the survey. However, they found no differences in several other response quality indicators (e.g., amount of probe nonresponse, number of words, response times) between the two conditions with lower and higher numbers of probes.
When asking more than one probe per question, another aspect that might affect the quality of the probe responses is the presentation format (Peytchev et al., 2006). For example, multiple probes can be presented on one subsequent survey page (scrolling design) or on separate subsequent survey pages (paging design). In the scrolling design, respondents need to scroll down on the page to see and answer all probes, but they are presented jointly and independently of the survey question. In the paging design, each probe is shown on a separate page, and respondents only notice the number and types of probes after clicking through the consecutive pages. The scrolling design contains more information on one screen, increasing complexity which might contribute to a higher perceived respondent burden (Couper et al., 2013; Mavletova & Couper, 2014). Both designs have in common that respondents first see only the survey question to be tested without knowing that one or multiple probes will follow (Luebker, 2021).
A third alternative is to implement the probes on the same page as the question to be tested, referred to as embedded design (Luebker, 2021). The embedded design has the advantage that the probes relate directly to the survey question, and the answer process is more likely to be still present in the respondent’s memory. On the downside, with target question and probes on one screen, the complexity of the response task might increase, lowering respondents’ performance, and this could also affect how respondents answer the survey question presented on the same page (Couper, 2013; Luebker, 2021).
Using exclusively closed survey questions, Mavletova and Couper (2014) compared a paging and a scrolling design in a web survey. The authors observed mixed results regarding break-off rates. While the break-off rate was higher for the paging than for the scrolling design in the course of the questionnaire, the break-off rate on the first page was significantly higher in the scrolling version. Satisfaction with the survey was higher in the scrolling design, and there were no differences in item nonresponse between both designs. However, the authors indicated that the latter finding could result from the common survey practice of the panel provider, where respondents usually have to answer all questions. In a second study, Mavletova and Couper (2016) varied whether they presented 30 items on one screen (scrolling design) or on several pages with 15 or 5 items each. The 30-item per page condition produced higher overall item nonresponse and shorter completion times but no differences in break-off rate or data quality (indicated by substantive responses to open-ended questions and the proportion of non-substantive responses to closed items).
Meitinger et al. (2021) investigated whether probe order (category-selection probe or specific probe first) and probe presentation (one or two subsequent screens) affected response behavior. With regard to probe presentation, they found that respondents mentioned fewer themes at the second probe in the one-screen (scrolling) condition compared to the two-screen (paging) condition. Furthermore, respondents were more likely to provide uninformative responses (“it depends”) when two probes were asked on one screen, while probe presentation did not have much impact on respondents’ motivation (i.e., on the share of respondents complaining that they have already answered the probe).
By implementing a probe on the same survey page as the survey question (embedded design), asking it separately on the following survey page (paging design) or asking no probe at all, Luebker (2021) analyzed what effect an added open-ended probe had on survey break-off, item nonresponse, and the meaningfulness of the answers in response to the probe. The experiment was implemented on a German salary comparison website, which offers people the opportunity to compare their salary to others in the same occupation. The findings showed that the open-ended probe increased item nonresponse to the survey question in the embedded design and led to more survey break-offs in both the embedded and the paging design. We build on the study by Luebker (2021) and transfer it to a general web survey setting, in which probes are asked as follow-ups to attitudinal questions. We also extend the study by implementing more than one probe per target question.
Research Questions and Hypotheses
The experiment presented here investigates how multiple open-ended probes should be implemented in cognitive online pretests to obtain the most informative data when evaluating questions. Specifically, we investigate whether multiple probes should be presented on the same page as the question to be tested (embedded design), on one subsequent page requiring respondents to scroll (scrolling design), or on separate consecutive questionnaire pages (paging design; see Figure 1). We compare the three formats in terms of the following four data quality indicators: dropouts, probe nonresponse, uninterpretable answers, and word count. Moreover, we examine whether the different formats are associated with different response distributions of the target question (see section on data quality indicators and analytical strategy below for more information on the dependent variables).
Given that the complexity of a task, and hence response burden, increases with the amount of information to be processed, we expect that presenting questions and/or probes on the same survey page makes it more difficult to answer them and therefore leads to lower quality. Accordingly, we expect that presenting the probes in a paging design, in which the target question and each probe are presented on separate pages, will lead to the highest data quality followed by the scrolling design, in which the target question and the probes are presented on separate pages, and finally the embedded design, in which all information is presented on one survey page (Hypothesis 1).
Due to the growing number of respondents participating in web surveys via mobile devices (Revilla & Ochoa, 2016), we will also examine whether response behavior and data quality between the presentation formats differ by device. Mobile devices (e.g., smartphones and tablets) are usually smaller than PCs, requiring more scrolling, and they have touchscreens instead of keyboards which might affect whether respondents are willing to answer open-ended probes and how many words they are willing to write when answering the open-ended probes. Hence, we expect the detrimental effects of presenting more information on a survey page in the embedded and scrolling designs to be stronger among respondents participating with a mobile device than those completing the survey on a PC (Hypothesis 2).[i]
Data and Method
Design
We implemented a 3×2 factorial between-subjects design. Respondents were randomly assigned to one of three conditions: (1) a paging design that presents the probes separately on the subsequently following pages, (2) a scrolling design that presents the probes together on the following page, and (3) an embedded design that presents the probes on the same screen as the survey question (see Figure 1 for an illustration). To control for possible content effects of the probe, we varied the probe order within each condition.
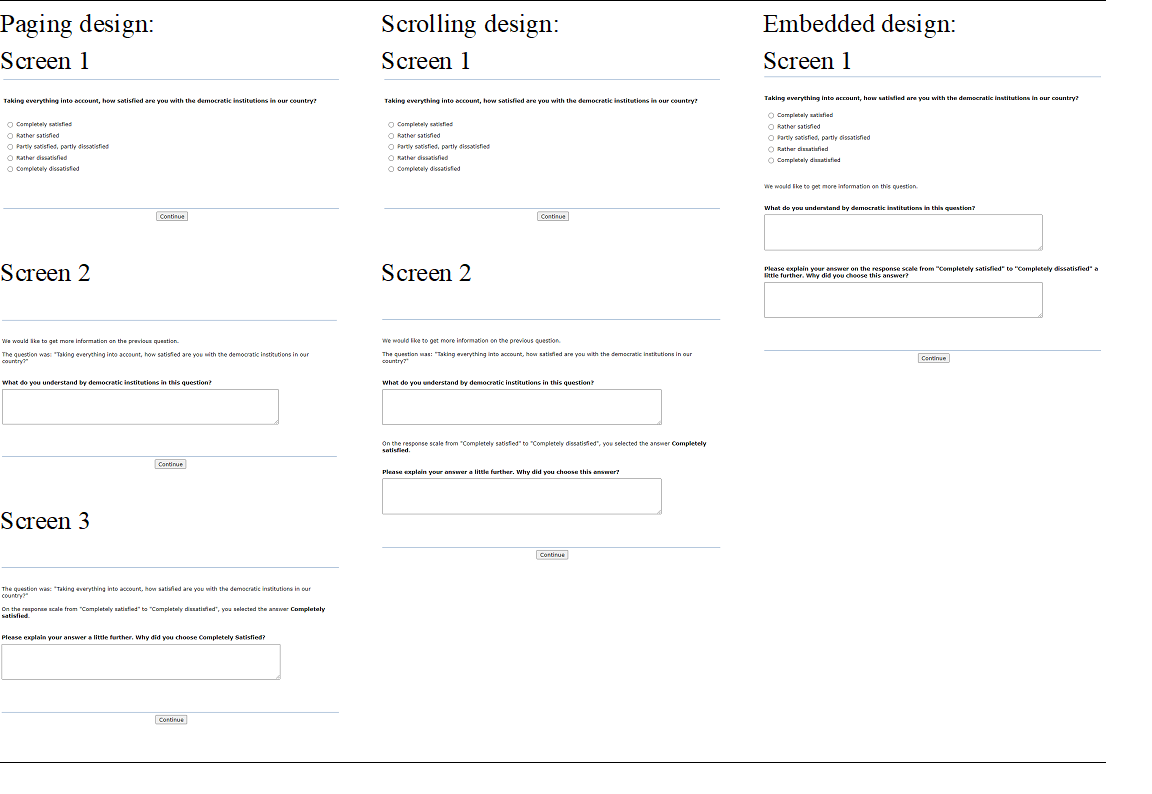
Figure 1: Exemplary screenshots of the experimental designs
Note: Shown are screenshots in English based on our own translation; see Appendix B for the original wording of the questions and probes in German.
Sample and data collection
The web experiment was conducted with respondents from the German nonprobability online access panel of the Respondi AG and was fielded between November 20 and December 2 in 2020. The questionnaire included several unrelated experiments which were independently randomized. A total of 2,300 respondents started answering questions from the experiment reported here. During answering, 95 respondents abandoned the survey (see results on dropout below). Hence, some of our analyses are restricted to the remaining 2,205 respondents who completed our experiment.
Out of the 2,300 respondents who started answering questions from our experiment, 49.2 percent were female, and 26.9 percent had graduated from a lower secondary school, 31.3 percent from an intermediate secondary school, and 40.0 percent from a college preparatory secondary school. Further 1.8 percent still attended school, had finished without a diploma, or did not report their highest level of education. Respondents were between 18 and 85 years of age with a mean age of 45 (SD = 14.9). Respondents were allowed to participate via any computer device. Overall, 64.4 percent responded via desktop PC, 8.0 percent used a tablet, and 27.5 percent answered with a mobile phone. Due to the comparatively low numbers of tablet users, we combined smartphones and tablets to ‘mobile devices’ for later analyses.
The mean duration for completing the whole questionnaire was 18.5 minutes. Panelists received an incentive in the form of points corresponding to a monetary value of about one Euro if they completed the entire survey. The experiment reported here was implemented in the middle of the survey after respondents had received a variety of questions on topics such as satisfaction with life, familial obligation, and financial knowledge. It should be noted that half of the respondents had already received open-ended probes before our experiment, while the other half had not [ii].
To evaluate the effectiveness of random assignment and the sample composition between the three experimental conditions, we conducted chi-square tests. The results showed no significant differences regarding sex [X2 (df = 4, N = 2,300) = 2.535, p = .638], age [X2 (df = 8, N = 2,300) = 2.870, p = .942], educational qualification [X2 (df = 10, N = 2,300) = 8.056, p = .623], and device ([X2 (df = 4, N = 2,299) = 1.400, p = .844].
Questions
We asked one single question and one grid question with four items (CSES, 2022). The single question (Q1) was “Taking everything into account, how satisfied are you with the democratic institutions in our country?” Five response options were presented vertically which ranged from “completely satisfied” to “completely dissatisfied” with “rather satisfied,” “partly satisfied, partly dissatisfied,” and “rather dissatisfied” in between. The grid question (Q2) asked respondents to indicate their agreement with the following statements: (a) You feel that you understand the most important political issues of this country; (b) In a democracy it is important to seek compromise among different viewpoints; (c) Having a strong leader in government is good for Germany even if the leader bends the rules to get things done; (d) The people, and not politicians, should make our most important policy decisions. The vertically presented response options were “strongly agree,” “somewhat agree,” “neither agree nor disagree,” “somewhat disagree,” and “strongly disagree.” We implemented two probes (one comprehension probe and one category-selection probe) for each question, respectively, resulting in four probes in total per respondent. The comprehension probe following the single question on democratic institutions was “What do you understand by democratic institutions in this question?”. The category-selection probe asked “Please explain your answer a little further. Why did you choose [response option]?”. Following the grid question, respondents were asked a comprehension probe targeting item (c) that read as “What do you understand by a strong leader in this statement?”. The category-selection probe targeting item (b) asked respondents to elaborate on their answer choice with the same wording as for the single question. Each probe was presented as an open-ended question followed by a text box [see Figure 1].
We implemented so-called soft-prompts in our web survey, which automatically check whether the respondent has answered a question. If respondents did not enter any text in the text box, a message was displayed stating, “Please answer all questions”. Nevertheless, respondents could decide to skip the probe without answering by checking a box indicating that they wanted to leave the text box blank.
Data quality indicators and analytical strategy
To assess which probe presentation format provides the best data quality, we compared the different designs with respect to the following data-quality indicators that have been used in previous experimental studies (e.g., Behr at al., 2012; Meitinger et al., 2018; 2022): number of dropouts, amount of probe nonresponse, number of uninterpretable answers, and average number of words respondents type in to answer the probes. All of these indicators point to potential limitations in the analysability of web probing data. Additionally, we compared response distributions of the target question including item nonresponse to the survey question.
Number of dropouts corresponds to the number of respondents who abandoned the survey during the experiment reported here. Probe nonresponse on open-ended questions can occur in several variants, such as (a) complete nonresponse, which refers to respondents who skip the probe question (including the soft prompt) or who do not write a word (“-”); (b) respondents who explicitly refuse to answer (e.g., “no”) or who give responses that do not consist of a word (e.g., “sdkjogej”); and (c) respondents who express insufficient knowledge (e.g., “I don’t know,” “?”). In our analyses, we define probe nonresponse as having occurred if respondents did not answer at least one of the four probes. Uninterpretable answers are defined as responses that are incomplete or uninterpretable in the context of the probing question (e.g., “Democracy works,” “Life is good”). In our analyses, we treat uninterpretable answers as given when respondents provided at least one uninterpretable response to one of the probes. Average number of words is the number of words respondents entered in response to all probes divided by the number of probes they answered. This indicator allows to evaluate respondents’ productivity in answering probes depending on the device used. The analysis is based on respondents who did not break off and answered at least one of the probes. When analyzing response distributions, we compare them between the embedded design and the paging or scrolling design, respectively. The rationale behind this approach is that presenting probes on the same page as the target question may affect respondents’ response process and lead to different interpretations of the target question (Scanlon, 2019). When either the paging or scrolling design is used, respondents first see only the target survey question without knowing that an open-ended probe will follow. This should not affect the responses to the target question.
Analyses were carried out using Stata 17. We report Pearson’s chi-square tests of independence for drop out, probe nonresponse, and uninterpretable answers. When expected frequencies are below five, we report results of Fisher’s exact test. When pairwise comparisons were significantly different between the experimental probe formats, we report them additionally. For word count, we conducted an analysis of variance (F-test) with Bonferroni corrections. To assess H2, we ran regression models with the data quality indicators as dependent variables. As respondents in our study were free to choose on what type of device they participate and because device choice varies systematically across demographic groups, we control for socio-demographic differences in device use by including respondents’ sex (0=male and 1=female), age (in years) and educational qualification (0=no university entrance qualification, 1=university entrance qualification) as control variables in all models. A dummy variable indicated whether respondents used a mobile device or not (0=desktop PC and 1=mobile device). The analyses to compare word count, probe nonresponse, and uninterpretable responses were performed together for all four open-ended probes. To compare response distributions, we conducted Pearson’s chi-square tests for Question 1 and each item of Question 2 as well as mean comparisons using analyses of variance (F-tests) with Bonferroni corrections for pairwise comparisons.
Results
Number of dropouts
Overall, 2,300 respondents were randomly assigned to the experimental conditions with 767 respondents in the paging and embedded condition, respectively, and 766 respondents in the scrolling condition. During the experiment, 4.1 percent of the respondents (n = 95) abandoned the questionnaire. As shown in Table 1 and contrary to our first hypothesis, the dropout rate did not differ significantly between the three conditions with 4.3 percent in the paging condition, 4.1 in the scrolling condition, and 4.0 percent in the embedded condition [iii].
Table 1: Proportion of response quality indicators dropouts, probe nonresponse, uninterpretable answers, and mean of the response quality indicator word count by experimental condition
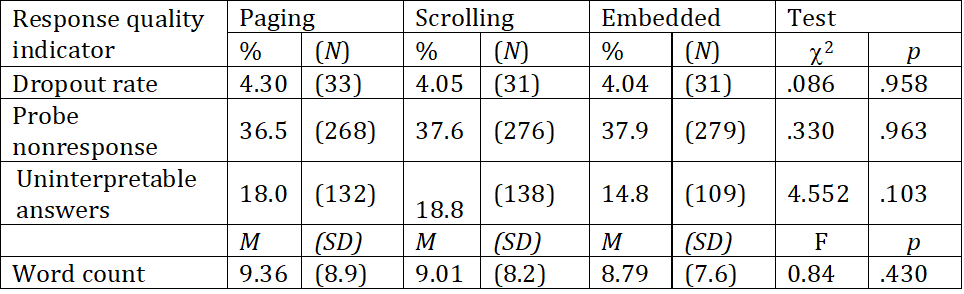
Note. M = mean; SD = standard deviation
To test the impact of the device used (Hypothesis 2), we ran a binary regression with probe design and device included as main predictors as well as an interaction effect between design and device. Socio-demographic covariates were included as described above (see section on data quality indicators and analytical strategy). The results of the binary logistic regression showed that the probability of survey break-off was significantly higher for respondents answering on mobile devices compared to PC respondents in the paging condition (see Table A.2 in the Appendix). In contrast, the probability was not significantly different in the scrolling and embedded conditions. These findings do not support our second hypothesis. Figure 2 depicts the effects of the device on the predicted probability of survey break-off across the three experimental conditions.
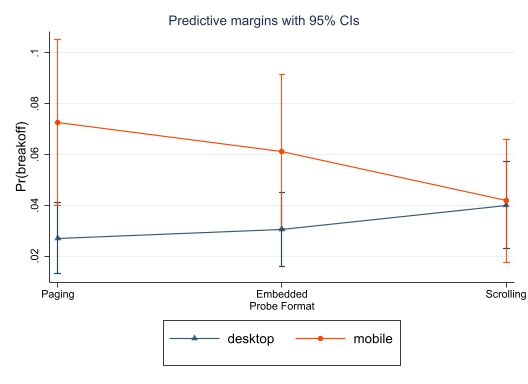
Figure 2: The effect of device used on the predicted probability of break-off in the three experimental conditions.
Note. Shown are predicted probabilities with 95% confidence intervals for desktop PC or mobile device users in the three experimental conditions; see Appendix Table A.2, Model 1 for the logistic regression model that was used to compute predicted probabilities.
Amount of probe nonresponse
In all three conditions, the amount of probe nonresponse was comparatively high with between 36.5 percent and 37.9 percent (see Table 1). However, we did not find significant differences in probe nonresponse between the three conditions, neither when comparing nonresponse over all probes nor over the two probes asked per question (see also Table A.1 in the Appendix). Only for the category selection probe following Q1, we found significant differences (see Table A.1). For this probe, the amount of probe nonresponse was significantly higher in the scrolling (25.6 %) and the embedded design (26.5 %) than in the paging design [20.8 %; X2 (df = 1, N = 1,469) = 4.617, p = .032, Cramer’s V = .06 and X2 (df = 1, N = 1,470) = 6.492, p = .011, Cramer’s V = .07], while there was no difference between the scrolling and the embedded design. Overall, we found only small differences and thus little evidence to confirm our first hypothesis stating that both the embedded design and the scrolling design are more complex, resulting in a higher amount of probe nonresponse than the paging design.
In the logistic regression, there were no significant interaction terms of device and format (see Table A.2, Model 2). Hence, Hypothesis 2 cannot be confirmed for probe nonresponse.
Number of uninterpretable answers
Contrary to our expectations, the proportion of respondents who provided an uninterpretable answer to at least one of the probes did not differ significantly between the three experimental designs (see Table 1) with 18.0 % in the paging, 18.8 % in the scrolling, and 14.8 % in the embedded design. Pairwise comparisons revealed significant differences between embedded and scrolling design [X2 (df = 1, N = 1,471) = 4.140, p = .042], a trend toward a significant difference between paging and embedded at a significance level of p < .1 and no significant differences between paging and scrolling design [X2 (df = 1, N = 1,470) = 2.701, p = .100; X2 (df = 1, N = 1,469) = .154, p = .695]. Results of the logistic regression showed no significant differences in the probability of providing uninterpretable responses between the three designs (Table A.2, Model 3) and no significant differences with regard to the device used. This does not support Hypothesis 2.
Number of words respondents type in per probe
Contrary to our expectations, the average number of words respondents typed in when answering the probes did not differ significantly between the three experimental probe designs (see Table 1 and Appendix Table A.2, Model 4). When comparing mobile and PC users within designs, PC users wrote generally more words than mobile-device users which is in line with previous research. This difference was statistically significant in the paging and scrolling format (predictive margins: paging: 9.91 vs. 8.11, p =.006; scrolling: 9.71 vs. 7.89, p = .005; embedded: 9.26 vs. 8.11, p = .084).
Response distributions of the target questions
Finally, we examined whether presenting the probes on the same page as the target question (embedded design) affected responses to the target questions. Table 2 shows the substantive answers to the single question by experimental condition (Means and differences are presented in Table 3). For the single question, response distributions of substantive answers between embedded and paging [X2 (df = 4, N = 1,466) = .799, p = .937] and embedded and scrolling design [X2 (df = 4, N = 1,464) = 0.646, p = .958] did not differ significantly. Comparing item nonresponse on the single question, we also did not find any significant differences between the three formats [X2 (df = 2, N = 2,205) = 1.752, p = .416].
Table 2: Response distribution of the substantive answers for the single target question by condition

In terms of substantive answers to the grid (Question 2), we did not observe significant differences in means between the three conditions (see Table 3). Comparing item nonresponse on the grid question showed no significant differences between designs for item a) [X2 (df = 2, N = 2,205) = 5.134, p = .077] and item b) [X2 (df = 2, N = 2,205) = .103, p = .950]. When answering item c) and d), significantly more respondents in the embedded design selected no response compared to respondents in the paging condition [item c): 1.1% vs. 0.1%; X2 (df = 1, N = 1,470) = 5.459, p = .019; item d): 1.5% vs. 0.3%; X2 (df = 1, N = 1,470) = 6.262, p = .012]. Differences between the embedded and the scrolling design were not statistically significant.
Table 3: Mean differences (Δ) in the substantive answers for the target single and grid questions between conditions

Note: P = Paging, S = Scrolling, E = Embedded. The far-right column contains the results of the analyses of variance (F-tests). Bonferroni post-hoc tests revealed no significant differences between paging and embedded and paging and scrolling designs for neither of the comparisons.
Discussion
The value of open-ended questions is being more widely recognized again (Singer & Couper, 2017). In cognitive online pretests, open-ended probes are used to get deeper information about the respondents’ response process and the understanding of the survey questions to be tested. Therefore, the quality of the answers to these probes is crucial when assessing the quality of survey questions. One potential element affecting the quality of the responses to multiple probes on the same target question is how (and when) they are presented to respondents. In a paging design, multiple probes are presented on separate pages, and the number and types of probes are only visible after clicking through the pages. In a scrolling design, multiple probes are presented on one page so that respondents have to scroll down on the page to see and answer the probes. In an embedded design, the probes are presented together with the survey question on the same page which also requires scrolling depending on screen size.
Comparing the three designs in terms of data quality, we found no differences in dropout rates, the number of respondents giving uninterpretable probe answers and the number of words they provided when answering the probes. For the data quality indicator probe nonresponse, we found only slight differences between the three probe presentation formats. In one of the four probes, probe nonresponse was significantly lower in the paging than in the scrolling and embedded design.
Embedding probes on the same page as the survey question did not influence the substantive answers to the target question. However, the proportion of respondents who did not answer two of the five target items was higher in the embedded design than in the paging condition. One possible explanation could be that the amount of information presented on one page is highest in the embedded design. This might have increased information density, leading to confusion, so the probability of overlooking probes increased while motivation to answer them decreased. However, this was only observed in two items and the amount of nonresponse was rather low. Hence, more research is needed to investigate this finding and possible causes.
We expected that the effect of the probe design on data quality would be more pronounced among mobile-device users than PC respondents. Contrary to our second hypothesis, we found no differences between mobile-device and PC respondents within designs with respect to probe nonresponse and uninterpretable answers. The dropout rate was higher among respondents who used mobile devices, but only in the paging condition. Finally, PC respondents answered the probes with more words than mobile device respondents. However, the differences in word count were small and statistically significant only for the paging and scrolling formats.
All in all, none of the three designs clearly stands out as less burdensome or more effective in eliciting high-quality answers to multiple probes in cognitive online pretests with regard to the data quality indicators used.
The present study does not come without limitations. For one, the experiment was implemented in a non-probability online panel. It might be the case that panelists are more persistent against response burden than other survey respondents, because they have a particular interest in completing the survey to receive the incentive they are getting paid after survey completion. Although it appears unlikely that probabilistic samples are to be used for cognitive online pretests in the future, it would be a research question worth investigating whether differences between the three designs emerge when comparing probabilistic and non-probabilistic samples, or panel providers who use different incentivization strategies.
Second, the experiment was also limited to two questions covering political issues. Therefore, it is not possible to generalize the findings to different web surveys and topics. As the topic of the questions is related to the willingness to respond to open-ended questions, future research could investigate whether other topics, such as family or gender roles, result in similarly high nonresponse rates (Holland & Christian, 2009).
Third, we only examined (comparatively) indirect indicators of data quality in this study. We encourage future research to investigate whether the different probe presentation formats lead to differences in the number and types of themes mentioned by respondents and the number of question problems detected. A potential research design would allow comparing the different probe formats on target questions where the problematic issues are already known to examine whether these are uncovered or not, even with smaller sample sizes as typical in cognitive pretesting studies.
Finally, we did not inform respondents on the welcome page that the web survey contains several open-ended probes, and we did not motivate respondents in particular in answering them (e.g., by emphasizing the importance of the open-ended responses to the research goals in cognitive online pretests). While this should not have affected the data quality between our implementation designs, it could be an important additional factor in reducing the proportion of probe nonresponse in future studies.
The proportion of respondents who did not answer the probes at all was very high across all three probe implementation designs. In contrast, the number of respondents who do not provide an answer to probes in face-to-face cognitive pretests is very small (Lenzner & Neuert, 2017). In view of this, more research is needed on how to motivate respondents to answer more (or multiple) open-ended questions in self-administered surveys. There are already efforts to have respondents answer open-ended responses via voice recording, which might be more convenient, particularly for respondents answering without keyboards (Revilla et al., 2020). Other research focuses on technologies to make web surveys more similar to interviewer-administered surveys by including interactive features (e.g., using avatars, Conrad et al., 2015; or text-to-speech technology; Couper et al., 2016). Also, recent research has shown that statements emphasizing the importance of the questions increased data quality (Chaudhary & Israel, 2016; Smyth et al., 2009). For instance, Smyth and colleagues found that including an introduction compared to no introduction increased response quality, indicated by increased response length, number of themes, and response time (Smyth et al., 2009). It would be worth investigating whether adding an information note about the importance of answering the open-ended probes on the welcome page of a questionnaire might reduce survey dropout and probe nonresponse. Also, whether targeted motivation messages can decrease probe nonresponse and increase data quality for open-ended questions remains an important question. Hence, further experimentation and research is needed on how respondents can be motivated to provide rich and descriptive information in web surveys, and particularly in cognitive online pretests.
[i] One exception are response distributions as we do not expect differences by device used.
[ii] A chi-square test revealed no significant differences in whether respondents had already answered open-ended probes or not and their assignment to experimental conditions [X2 (df = 2, N = 2300) = .112, p = .945].
[iii] Among those who dropped out of the survey, the proportion of respondents who had not yet received open-ended probes was higher than for respondents who had already received some (63.2% vs. 36.8%) but did not differ between the experimental conditions [X2 (df = 2, N = 95) = .419, p = .811].
Appendix
Appendix A:
Table A.1: Proportion of probe nonresponse, by question, probe and probe design
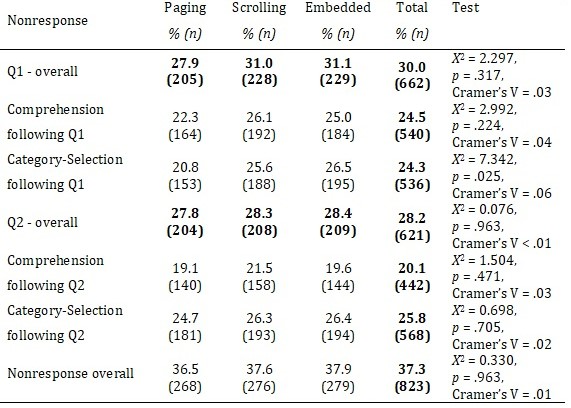
Note: ‘Q1/Q2 overall’ refers to respondents who gave at least one nonresponse at either the comprehension probe or the category-selection probe following Q1 and Q2, respectively. ‘Nonresponse overall’ refers to respondents who gave at least one nonresponse at one of the probes.
Table A.2: Logistic and linear regressions on indicators of data quality
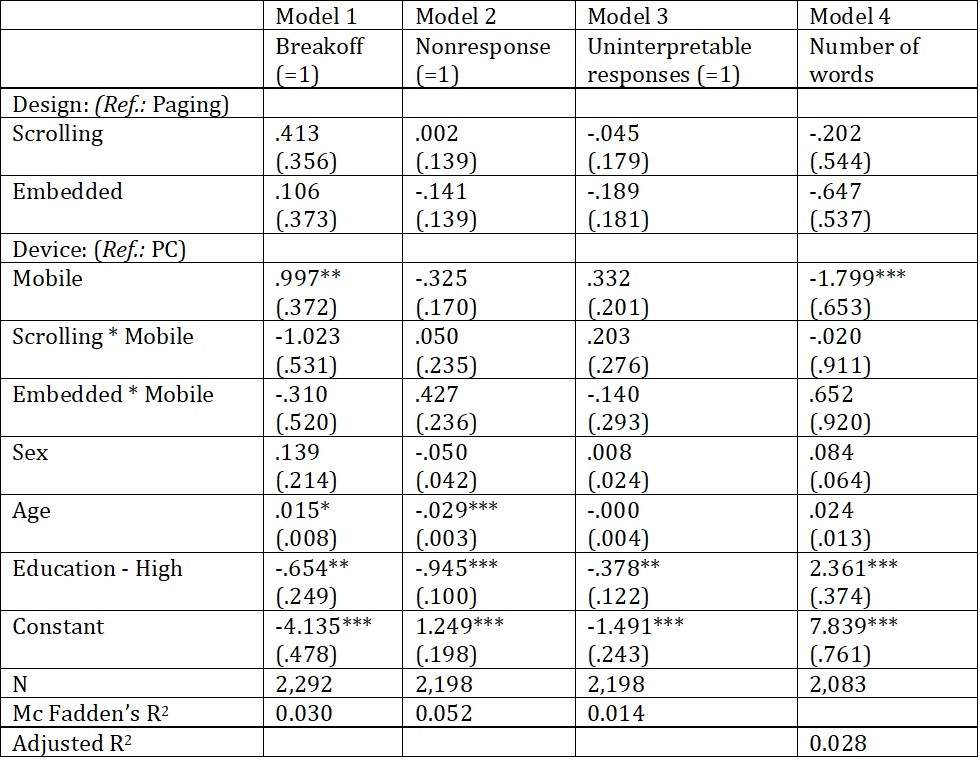
Note: * p < 0.05, ** p < 0.01, *** p < 0.001. Model 1, 2 and 3 are logistic regressions, and Model 4 is a linear regression. Cell entries are unstandardized regression coefficients with standard errors in parentheses.
Appendix B: Original wording in German of the target questions and the probes
Q1 – Single question:
Alles in allem – wie zufrieden oder unzufrieden sind Sie mit den demokratischen Einrichtungen in unserem Land? (Response options: Ganz und gar zufrieden; Eher zufrieden; Teilweise zufrieden, teilweise unzufrieden; Eher unzufrieden; Ganz und gar unzufrieden)
Probes following single question:
Wir möchten zu der vorherigen Frage gerne noch nähere Informationen erhalten. Die Frage lautete: „Alles in allem – wie zufrieden oder unzufrieden sind Sie mit den demokratischen Einrichtungen in unserem Land?“
Comprehension Probe: Was verstehen Sie in dieser Frage unter demokratischen Einrichtungen?
Category-Selection Probe: Auf der Antwortskala von „Ganz und gar zufrieden“ bis „Ganz und gar unzufrieden“ haben Sie die Antwort [Response] ausgewählt. Bitte erläutern Sie Ihre Antwort noch etwas näher. Warum haben Sie sich für diesen Wert entschieden?
Q2 – Grid question:
Inwieweit stimmen Sie den folgenden Aussagen zu oder nicht zu?
a) Ich glaube, dass ich die wichtigsten politischen Themen in diesem Land verstehe.
b) In einer Demokratie ist es wichtig, Kompromisse zwischen verschiedenen Ansichten zu suchen.
c) Eine starke Führungspersönlichkeit in der Regierung zu haben ist gut für Deutschland, auch wenn diese sich nicht so genau an die Regeln hält, um Dinge Vorwärts zu bringen.
d) Das Volk, und nicht die Politikerinnen und Politiker, sollte unsere wichtigsten politischen Entscheidungen treffen.
(Response options: Stimme voll und ganz zu; Stimme eher zu; Weder noch; Stimme eher nicht zu; Stimme überhaupt nicht zu)
Probes following grid question:
Wir möchten zu der vorherigen Frage gerne noch nähere Informationen erhalten.
Comprehension Probe targeting item c): Eine Aussage lautete: „Eine starke Führungspersönlichkeit in der Regierung zu haben ist gut für Deutschland, auch wenn diese sich nicht so genau an die Regeln hält, um Dinge Vorwärts zu bringen.“
Was verstehen Sie in dieser Frage unter einer „starken Führungspersönlichkeit“?
Category-Selection Probe targeting item b): Eine andere Aussage lautete: „In einer Demokratie ist es wichtig, Kompromisse zwischen verschiedenen Ansichten zu suchen.“ Ihre Antwort lautete: [Response]
Bitte erläutern Sie Ihre Antwort noch etwas näher. Warum haben Sie sich für diese Antwort entschieden?
References
- Al Baghal, T., & Lynn, P. (2015). Using motivational statements in web instrument design to reduce item missing rates in a mixed-mode context. Public Opinion Quarterly, 79(2), 568-579.
- Beatty, P. C., & Willis, G. B. (2007). Research synthesis: The practice of cognitive interviewing. Public Opinion Quarterly, 71(2), 287–311. https://doi.org/10.1093/poq/nfm006
- Behr, D., Kaczmirek, L., Bandilla, W., & Braun, M. (2012). Asking probing questions in web surveys: which factors have an impact on the quality of responses? Social Science Computer Review, 30(4), 487–498. https://doi.org/10.1177%2F0894439311435305
- Behr, D., Meitinger, K., Braun, M., & Kaczmirek, L. (2017). Web probing – Implementing probing techniques from cognitive interviewing in web surveys with the goal to assess the validity of survey questions (GESIS – Survey Guidelines). GESIS – Leibniz-Institute for the Social Sciences. https://doi.org/10.15465/gesis-sg_en_023
- Callegaro, M., & DiSogra, C. (2008). Computing response metrics for online panels. Public Opinion Quarterly 72(5), 1008–1032. https://doi.org/10.1093/poq/nfn065
- Chaudhary, A. K., & Israel, G. D. (2016). Influence of importance statements and box size on response rate and response quality of open-ended questions in web/mail mixed-mode surveys. Journal of Rural Social Sciences, 31(3), 140–159.
- Collins, D. (2015). Cognitive interviewing practice. Sage.
- Conrad, F. G., Schober, M. F., Jans, M., Orlowski, R. A., Nielsen, D., & Levenstein, R. (2015). Comprehension and engagement in survey interviews with virtual agents. Frontiers in Psychology, 6, 1578. https://doi.org/10.3389/fpsyg.2015.01578
- Couper, M. P. (2013). Research note: Reducing the threat of sensitive questions in online surveys? Survey Methods: Insights from the Field. Retrieved from https://surveyinsights.org/?p=1731. https://doi.org/10.13094/SMIF-2013-00008
- Couper, M. P., Berglund, P., Kirgis, N., & Buageila, S. (2016). Using text-to-speech (TTS) for audio computer-assisted self-interviewing (ACASI). Field Methods, 28(2), 95–111. https://doi.org/10.1177/1525822X14562350
- Couper, M. P., Tourangeau, R., Conrad, F. G., & Zhang, C. (2013). The design of grids in web surveys. Social Science Computer Review, 31(3), 322–345. https://doi.org/10.1177%2F0894439312469865
- Crawford, S. D., Couper, M. P., & Lamias, M. J. (2001). Web surveys: Perceptions of burden. Social Science Computer Review, 19(2), 146–162. https://doi.org/10.1177%2F089443930101900202
- CSES – The Comparative Study of Electoral Systems (2022). CSES Module 5 Advance Release 4. GESIS, Köln. ZA7557 Datenfile Version 4.0.0, https://doi.org/10.7804/cses.module5.2022-03-01.
- De Leeuw, E. D., Hox, J. J., & Boevé, A. (2016). Handling do-not-know answers: Exploring new approaches in online and mixed-mode surveys. Social Science Computer Review, 34(1), 116-132.
- DeRouvray, C., & Couper, M. P. (2002). Designing a strategy for reducing “no opinion” responses in web-based surveys. Social Science Computer Review, 20(1), 3-9.
- Dillman, D. A., Smyth, J. D., & Christian, L. M. (2014). Internet, phone, mail, and mixed-mode surveys: the tailored design method. John Wiley & Sons.
- Fowler S., Willis G. B. (2020). The practice of cognitive interviewing through web probing. In Beatty P. C., Collins D., Kaye L., Padilla J. -L., Willis G. B., Wilmot A. (Eds.), Advances in questionnaire design, development, evaluation and testing(pp. 451–469). Wiley.
- Holland, J. L. & Christian, L.M. (2009). The influence of topic interest and interactive probing on responses to open-ended questions in web Social Science Computer Review, 27(2), 196–212. https://doi.org/10.1177%2F0894439308327481
- Kunz, T., & Meitinger, K. (2022). A Comparison of Three Designs for List-style Open-ended Questions in Web Surveys. Field Methods, 34(4), 303-317. https://doi.org/10.1177/1525822X221115831
- Lenzner, T., & Neuert, C. E. (2017). Pretesting survey questions via web probing – Does it produce similar results to face-to-face cognitive interviewing?. Survey Practice, 10(4), 2768. https://doi.org/10.29115/SP-2017-0020
- Lenzner, T., Neuert, C., Hadler, P., & Menold, N. (2018): Internet of Things (English Version). Cognitive Online-Pretest. GESIS Project Reports. Version: 1.0. GESIS – Pretestlab. Text. http://doi.org/10.17173/pretest71
- Luebker, M. (2021). How much is a box? The hidden cost of adding an open-ended probe to an online survey. Methods, Data, Analyses: A Journal for Quantitative Methods and Survey Methodology (mda), 15(1), 7–42. https://doi.org/10.12758/mda.2020.09
- Mavletova, A. & Couper, M. P. (2014). Mobile web survey design: Scrolling versus paging, SMS versus e-mail invitations. Journal of Survey Statistics and Methodology, 2(4), 498–518. https://doi.org/10.1093/jssam/smu015
- Mavletova, A., & Couper, M. P. (2016). Grouping of items in mobile web questionnaires. Field Methods, 28(2), 170–193. https://doi.org/10.1177/1525822X15595151
- Meitinger, K., & Behr, D. (2016). Comparing cognitive interviewing and online probing: Do they find similar results?Field Methods, 28(4), 363–380. https://doi.org/10.1177%2F1525822X15625866
- Meitinger, K., Braun, M., & Behr, D. (2018). Sequence matters in web probing: The impact of the order of probes on response quality, motivation of respondents, and answer content. Survey Research Methods, 12(2), 103–120. https://doi.org/10.18148/srm/2018.v12i2.7219
- Meitinger, K., Toroslu, A., Raiber, K., & Braun, M. (2021). Perceived burden, focus of attention, and the urge of justify: the impact of the number of screens and probe order on the response behavior of probing questions. Journal of Survey Statistics and Methodology, online first. https://doi.org/10.1093/jssam/smaa043
- Neuert, C. E., & Lenzner, T. (2021). Effects of the number of open-ended probing questions on response quality in cognitive online pretests. Social Science Computer Review, 39(3), 456–468. https://doi.org/10.1177%2F0894439319866397
- Neuert, C. & Lenzner, T. (2014): A Ranking Measure of Life Satisfaction (RankMe) (English Version). Cognitive Online-Pretest. GESIS Project Report. Version: 1.0. GESIS – Pretest lab. http://doi.org/10.17173/pretest91
- Neuert, C., Meitinger, K. & Behr, D. (2021). Open-ended versus closed probes: Assessing different formats of web probing. Sociological Methods & Research (Online first). http://dx.doi.org/10.1177/00491241211031271
- Peytchev, A., Couper, M. P., McCabe, S. E., & Crawford, S. D. (2006). Web survey design: Paging versus scrolling. Public Opinion Quarterly, 70(4), 596–607. https://doi.org/10.1093/poq/nfl028
- Presser, S., Couper, M. P., Lessler, J. T. Martin, E., Martin, J., Rothgeb, J., Singer, E. (2004). Methods for testing and evaluating survey questions, Public Opinion Quarterly, 68(1), 109–130. https://doi.org/10.1093/poq/nfh008
- Prüfer, P., & Rexroth, M. (2005). Kognitive Interviews [cognitive interviews]. ZUMA How-to-Reihe 15. Retrieved March 11, 2021, from https://www.gesis.org/fileadmin/upload/forschung/publikationen/gesis_reihen/howto/How_to15PP_MR.pdf
- Reja, U., Manfreda, K. L., Hlebec, V., & Vehovar, V. (2003). Open-ended vs. close-ended questions in web questionnaires. Developments in Applied Statistics, 19(1), 159-177.
- Revilla, M., & Ochoa, C. (2016). Open narrative questions in PC and smartphones: Is the device playing a role? Quality & Quantity, 50, 2495–2513. https://doi.org/10.1007/s11135-015-0273-2
- Revilla, M., Couper, M. P., Bosch, O. J., & Asensio, M. (2020). Testing the use of voice input in a smartphone web survey. Social Science Computer Review, 38(2), 207–224. https://doi.org/10.1177%2F0894439318810715
- Scanlon, P. (2019). The effects of embedding closed-ended cognitive probes in a web survey on survey response. Field methods, 31(4), 328-343. https://doi.org/10.1177/1525822X198715
- Singer, E., & Couper, M. P. (2017). Some methodological uses of responses to open questions and other verbatim comments in quantitative surveys. Methods, Data, Analyses: A Journal for Quantitative Methods and Survey Methodology (mda), 11(2), 115–134. https://doi.org/10.12758/mda.2017.01
- Smyth, J. D., Dillman, D. A., Christian, L. M., & Mcbride, M. (2009). Open-ended questions in web surveys: Can increasing the size of answer boxes and providing extra verbal instructions improve response quality? Public Opinion Quarterly, 73(2), 325–337. https://doi.org/10.1093/poq/nfp029
- Willis, G. B. (2004). Cognitive interviewing: A tool for improving questionnaire design. Sage publications.
-
Keywords
calibration CATI coverage coverage bias cross-national surveys data linkage data quality European Social Survey experiment face-to-face face-to-face survey Facebook hard to reach populations incentives item nonresponse measurement measurement error mixed-mode surveys multitasking non-probability samples Nonresponse nonresponse bias nonresponse rates paradata PIAAC Probability sample probability samples QR codes rare populations response rate Satisficing social desirability Social media survey survey-taking climate survey data survey management survey methods Telephone survey telephone surveys total survey error unit nonresponse validity web survey Web surveys weighting
