

Designing Effective Mobile Phone Surveys: Insights from Mozambique on Optimizing Call Attempts and Evaluating Response, Refusal, and Contact Rates among Refugees and Asylum Seekers
Bozdag I. & Park, H. (2024). Designing Effective Mobile Phone Surveys: Insights from Mozambique on Optimizing Call Attempts and Evaluating Response, Refusal, and Contact Rates among Refugees and Asylum Seekers. Survey Methods: Insights from the Field. Retrieved from https://surveyinsights.org/?p=18437. The research dataset will be accessible post-anonymization at this link: https://microdata.unhcr.org/index.php/home
© the authors 2024. This work is licensed under a Creative Commons Attribution 4.0 International License (CC BY 4.0) 
Abstract
This study aims to provide a detailed analysis of the call attempts and sample design phase in Computer Assisted Telephone Interviewing (CATI) when applied to forcibly displaced populations. The sampling frame consisted of 680 individuals from initial batch and 1400 individuals from the latter which was currently updated, all refugees and asylum seekers. Data was collected from 400 individuals using the UNHCR registration database, ProGres.The initial focus was on assessing response, refusal, contact, and cooperation rates. Additionally, the study examined the impact of survey length on refusal rates. This analysis was followed by a comparison of respondent profiles with the sampling frame to estimate representativity of the final sample. To optimize the ideal number of calls, the study assessed call attempts, particularly emphasizing differences in reasons for non-responses specific to forcibly displaced populations. Only 30 percent of call attempts resulted in phone contact, and among those, only 18 percent successfully completed the surveys. Kaplan Meier survival estimations were employed to illustrate the likelihood of reaching respondents based on the number of attempts. The findings underscore the importance of a meticulous sampling design to ensure data quality and minimize bias when employing CATI for forcibly displaced populations.
Keywords
CATI, forced displacement, Mozambique, non-settlements, phone-surveys, Refugees, survival analysis, UNHCR
Acknowledgement
We would like to express our gratitude to UNHCR Mozambique Office and CS research for carrying out this survey. We would like to also mention that our contribution to this article in our own personal capacity. These views expressed are our own and do not necessarily represent the views of the United Nations High Commissioner for Refugees.
Copyright
© the authors 2024. This work is licensed under a Creative Commons Attribution 4.0 International License (CC BY 4.0)
Introduction
The number of forcibly displaced and stateless populations expected to reach 117.2 million in 2023 according to Global Appeal of UNHCR (United Nations High Commissioner for Refugees) (UNHCR, 2023). Due to the increasing numbers of forcibly displaced and stateless populations, it is more important than ever having access to high quality data to better inform policy makers, international organizations and governments institutions. However, forcibly displaced populations which includes refugees, asylum seeker and internally displaced persons (IDPs) pose unique challenges to the selection of probability sample (Eckman & Kristen, 2022).
According to UNHCR, only 22 percent of the refugees are living in the camps which is roughly 6.6 million people (UNHCR, 2021). Moreover, around 60 percent of the refugees, and 80 percent of IDPs estimated to live in urban environments (UNHCR, 2021). Out of camps refugees and IDPs are particularly difficult to have a good sampling frame due to higher mobility compared to refugees in camps. This is particularly true for out-of-camp refugees as they are dispersed mostly in urban locations with the host community as opposed to camps which makes difficult to use methods such as random walk in the absence of a sampling frame. As a result, technical challenges to surveys of hard-to-reach populations as such (rare, no known sampling frames) have been, for some years, the object of methodological reflection (Marpsat & Razafindratsima, 2010).
Since the COVID-19 pandemic, in the era of erupted household surveys, remote data collection methods gained even more importance than before which is still implemented and promoted by many organizations such as World Bank with High Frequency Phone Surveys or Mobile Vulnerability Analysis and Mapping that is implemented by World Food Programme to track food security all around the world as it’s cost-efficient, flexible and can provide data from unstable and hard-to-reach areas. (Lavrakas, 2009; WFP, 2016; World Bank, 2020).
This transition from face-to-face to remote data collection methods happened just in a few weeks shortly after COVID-19 for many ongoing or already planned surveys, yet this also mobilized researchers and practitioners alike to learn new systems, adapt instruments, and engage in a great deal of trial and error. (Wolf, Aurino, Brown, Tsinigo, & Edro, 2022). For instance, High Frequency Phone Surveys of World Bank is a good example which was launched right after COVID-19 with an aim to monitor and track socio-economic impacts of such a shock in the absence of face-to-face surveys.
UNHCR aims to become a trusted leader on data related to forcibly displaced and stateless populations as part of UNHCR’s Data Transformation Strategy of 2020 to 2025. Household surveys are crucial in that sense to have snapshot on the living conditions of these populations even in areas that are not reachable. As a result, also for UNHCR phone surveys have become an indispensable tool for data collection of household surveys with an increasing usage since COVID-19. Yet, having a representative sample for household surveys becomes more challenging which requires new and creative ways of collecting data in an efficient way even more so for telephone surveys (Davern, et al., 2010). In that regard, developing sound methodologies for mobile data collection is crucial and requires different types of efforts to find solution for its unique challenges
Phone surveys continue to be a constant part of data collection tool for UNHCR and other organization due to inaccessibility of some areas, cost-efficiency and speed for forcibly displaced populations. Today, almost three years after COVID-19 related confinements, where in a period everything has already been back to ‘normal’, it is important to focus on the methodological aspects of phone surveys to improve along with its limitations particularly for forcibly displaced populations. The limitations and bias of phone surveys are not unfamiliar to researchers working in survey field, in this paper, however, we will have a focus on the overall response, contact and refusal rates and its relation to respondent’ profile, length of survey and finally the number of call attempts required to optimize the efficiency.
Literature Review
Mobile phone penetration
According to International Telecommunications Union data on mobile cellular subscriptions per 100 people), the global average is 110 (International Telecommunication Union, 2023). The data shows that the rate is 100 for lower-middle income countries, and 60 for low-income countries according to World Bank classifications where 20 and 18 percent of the refugees are hosted, respectively (UNHCR, 2023; World Bank, 2023). Mozambique is one of the low-income countries presenting the mobile subscription of 43 per 100 people in 2021, while the indicator presents 89 and 123 in Zimbabwe and Kenya, respectively, which are lower-middle income economies (World Bank, 2023). It should also be added that there is a gender bias as more than half of all men (50 percent) have mobile phones as compared to only 32 percent of women in Mozambique which makes it difficult to access women via phone surveys (Gillwald, Mothobi, & Rademan, 2019).According to Digital Gender Gaps Application the ratio of female to male mobile phone use published by Global System for Mobile Communication Association (GSMO) is 75 percent which again proves the lower use of mobile phones by adult female population in the country (Leasure, et al., 2023).
In the context of general population, mobile phone surveys has higher level of accuracy in countries where mobile phone penetration rate is also higher. More so, low response rates can be a factor leading to nonresponse biases and these bias canbe analysed based on response rates and the difference between respondents and non-respondents. (Groves, 2006). Due to the low rates of mobile penetration in Mozambique, Leo et al. (2015) shows that Mozambique is one of the countries showing a large sampling error where average attempt per connected is 5 and only 20 per cent is connected (Leo, Morello, Mellon, Peixoto, & Davenport, 2015).
Call Attempts and refusal rates at a glance
The current literature suggests that there is a decline in response rates for phone surveys which is dramatically lower compared to landline, with issues specific to mobile phone surveys (Vehovar, Belak, & Batagelj, 2021; Kennedy, 2010; Tortora, 2021). Dutwin and Burkirk (2020) propose that while probability samples can yield valuable insights, current trends and missteps in modern telephone polls seem to be culminating in a judgment against their continued efficacy. However, while this decrease on participation to mobile phone surveys also affect the quality of samples for forcibly displaced populations, smartphone technology could help alleviate methodological issues in surveying transient refugee population (Keusch, Leonard, Sajons, & L. Steiner, 2019)
On the other hand, the call backs have an undeniable impact on increasing the response rates for phone surveys. Indeed, a combination of approaches, such as increasing call attempts and targeted call times, can maximize telephone response rates (Kristal, et al., 1999; O’Toole, Sinclair, & Leder, 2008). Legleye et al. (2013) also compared the effects of increasing call attempts and calling back refusals/abandonments, finding that including hard-to-contact respondents decreased sociodemographic bias, while including call-back respondents increased it. There is also already existing literature on call attempts to optimize and improve the methodology on the response rates for mobile phone surveys. For instance, prior to American Association for Public Opinion Research (AAPOR) standards were set, 12-15 call attempts were suggested as per sampled respondent. However, AAPOR currently recommends 6-10 attempts per sampled respondent (Vicente, Marques, & Reis, 2017).
Although there is extensive research on mobile phone surveys on response rates and call attempts as summarized above, papers offering methodological considerations and guidelines for conducting research with forcibly displaced populations are less common. Some studies on the subject focuses on the fact that there is additional need for exploring alternative methodologies while surveying those populations particularly focusing on the ethical concerns, prevalence of mental disorders in refugee populations and methodological concerns specific to these populations (Bloch, 1999; Schweitzer & Steel, 2008). On the other hand, research on mobile phone surveys focusing on developing countries have similar challenges and which can be give a vision on the existing literature. The research suggests distinctions in mobile phone surveys in developing countries, highlighting the efficacy of random digital dialing as a preferred method. Nevertheless, its application to forcibly displaced populations is hindered by the need to define the study population based on their history of mobility (Dabalen, et al., 2016; Labrique, et al., 2017). Other studies propose that mobile phone-based data collection can be effectively utilized by addressing challenges through implementing suggested solutions, particularly in developing countries (Ganesan, Prashant, & Jhunjhunwala, 2012).
The aim of this paper[1] is to understand how we can obtain high quality data from mobile phone surveys by addressing expected challenges prior to data collection while keeping the data quality high with the available sampling frames in the context of forced displacement focusing on response rates and the number of call attempts. In general, high non-response rates impose challenges in surveys such as uncertainty and complexity in processing data, and the efforts to limit non-responses leads to higher costs (Peytchev, 2013). One of the strategies to increase response rates could be setting a high number of maximum call attempts, implying higher survey costs (O’Toole, Sinclair, & Leder, 2008). Based on the data from Mozambique’s RMS CATI, this paper attempts to suggest an optimal number of call attempts to maintain survey costs, while not compromising the data quality.
More in detail, this paper will focus on different aspects of the mobile phone surveys implemented in Mozambique with the refugees and asylum seekers. focusing mainly on the sampling frame, response rates and the number of attempts. First, we will examine the total refusal, response, contact and cooperation rates based on the calculations from AAPOR 4.1 tool. Secondly, we will check the respondent profile and compare it with the initial sampling frame to see if there are any differences. Additionally, we will examine the median length of the survey to assess whether it is influenced by household size. Furthermore, we will investigate whether the survey’s duration has any discernible impact on refusal rates. Lastly, we will analyze the call attempts with in-dept analysis, where we apply Kaplan Meier Estimations in addition to the comparison of call attempts by the end results of survey and phone answers to see optimized number of call attempts. Due to fast-changing environment, phone numbers are easily outdated so this paper will also inform on how to calculate non-response rates for the selection of sample to make have a representative sample within the sampling frame.
Case Study in Mozambique
Mozambique has a complex situation of forced displacement. In Northern Mozambique, more than one million people were forced to displace due to violence caused by non-state armed Groups. The country is also vulnerable to adverse weathers especially cyclones. In March 2023, Cyclone Freddy damaged the country, having caused internal displacement in addition to previous disasters such as Cyclone Gombe in 2022 and Cyclone Idai in 2019.
Total number of refugees and asylum-seekers count to be 31,500 as of March 2023. Maratane refugee settlement is the only camp in Mozambique located in Nampula province hosting approximately 9,000 individuals. The rest of refugees and asylum-seekers are dispersed in urban and rural areas of the country including Maputo, the capital of Mozambique.
There are already ongoing efforts on data collection in Mozambique for forcibly displaced populations. The data collection of forced displacement in Mozambique traditionally is concentrated in Maratane settlement and surrounding areas. For instance, UNHCR and WFP collected data in 2021 with exercise called the Joint Assessment Mission in 2021 which aims proper targeting for assistance and in 2023 with the Minimum Expenditure Basket for expenditure analysis. One of the reasons of the focus on the settlement is convenience as reaching the rest of population is too challenging. There had been almost no representative data from household surveys for the out-of-camp refugees and internally displaced people due to complexities of finding the households and lack of sampling frame respectively.
The case study from Mozambique covers refugees and asylum-seekers along with internally displaced persons in Mozambique and is called Results Monitoring Surveys (RMS) Mozambique (2023). In this study, however, the focus is only on the data collected in the areas other than Maratane settlement and Nampula City, with refugees via phone while the RMS Mozambique (2023) data also covered refugees and asylum-seekers living in the settlement, as well as internally displaced persons in Cabo Delgado and Nampula. There has been so far no data collection on the refugees and asylum-seekers in Mozambique who are in Maputo despite having almost half of the refugees and asylum-seekers in the capital. Thus, this survey represents the first time ever survey collected with the urban refugees in Mozambique via mobile phones.
Sampling design
Unfortunately, one of the most common methods used in phone surveys Random Digit Dialing (RDD) cannot be used in this case study as majority of household surveys that targets forcibly displaced populations does require a pre-selection of a targeted population for the survey, thus a sampling frame. As a result, the survey in Mozambique used the existing registration base of UNHCR called ‘proGres’ as a sampling frame to select respondents for CATI. While, proGres has a good coverage of refugees for face-to-face surveys, refugees not necessarily register their phone numbers, more so, these phone numbers can easily be outdated. Even though the connectivity is high, mobile phone numbers can easily change more often than stable populations which comes as an additional challenge for forcibly displaced populations that affects the response rates.
ProGres is the main tool for of registration of refugees and affected populationsfor UNHCR. ProGres was first developed in 2003 under project PROFILE to meet UNHCR’s refugee registration and population data management requirements. ProGres has, over the years, become the back-bone for individual data in the majority of UNHCR’s field operations. It contains detailed information of the registered individuals which are also sensitive such as sex, age, country of origin, arrival date in the country of asylum, registered date, a photo, protection needs, departure or return to another country, contact information, and so on. Additional information such as education attainement, work status and documentation are also collected. It is now a key instrument for the delivery and tracking of protection and assistance services to refugees or relevant populations around the world as part of PRIMES (Population Registration and Identity Management Eco-System) along with other tools relevant to registration and assistance provided to forcibly displaced and other affected populations (UNHCR, 2018). If the registrations are up-to-date and the information is complete, proGres is a very good sampling frame that is preferred as a probabilistic method to obtain a representative sample of the targeted population. Samples were drawn from the list of proGres v4 in February 2023.[2]
The contact information in proGres enables phone surveys; however, there are challenges due to a low percentage of phone numbers registered within the database. Phone numbers in proGres are not always up-to-date, then reaching to forcibly displaced persons is not effective based on the available list. During the time of data collection, UNHCR in Mozambique was conducting a verification exercise of proGres, meaning update of the database, in parallel with the RMS. As a result, the sample was affected by this update where some of the phone numbers called was recently updated which ease the process of reaching out to these households.
Despite the challenges, proGres enabled a probabilistic sampling. The sample was randomly selected based on the list from proGres after exclusion for the population residing in Maratane settlement and Nampula City who are sampled for face-to-face survey. At the beginning of the data collection, there were 3,012 females and 7,438 males registered with phone numbers which made a total of 10,450 individuals for the sampling frame. In order to reach the target sample size, a second batch was generated where the selected individual in the first batch were excluded from a total of 8,914 consisting of 2,507 females and 6,407 males. One adult per household is selected randomly first regardless of sex, and stratification was applied to make sure to have a female representation within the survey where females were selected at least by 40 percent even though they represent only 30 percent of the sampling frame. The sample size of women was amplified since the disparity by gender of mobile subscription is usually observed, and Mozambique is one of the countries showing the highest gender disparity in Africa (Gillwald, Mothobi, & Rademan, 2019). The target sample size was decided as 400 for CATI excluding Maratane settlement and Nampula City, in addition to 400 of CAPI of refugees and asylum-seekers in Maratane camp and surroundings and 900 of Internally Displaced Persons (IDPs).
Based on the list from proGres at the group level, the samples were drawn.[3] From the pre-testing the response rate was 33 percent where only 9 out of 30 households were reachable. Since the pre-testing had a problem of limitation to Maputo city only, the response rate was expected to be slightly higher, thus the first batch of sample was drawn assuming 50 percent of response rate with a backup of 60 samples in case of exhaustion of the list of the main sample of the first batch without reaching to the target size. After exhaustion of the list of 680, the response rate was only 20 percent. Additional sample of 1,400 was drawn assuming 20 percent of response rate. The second batch was drawn from the more updated list affected by the verification exercise of proGres. The second batch was not fully exhausted as the data collection for 400 individuals was completed before.
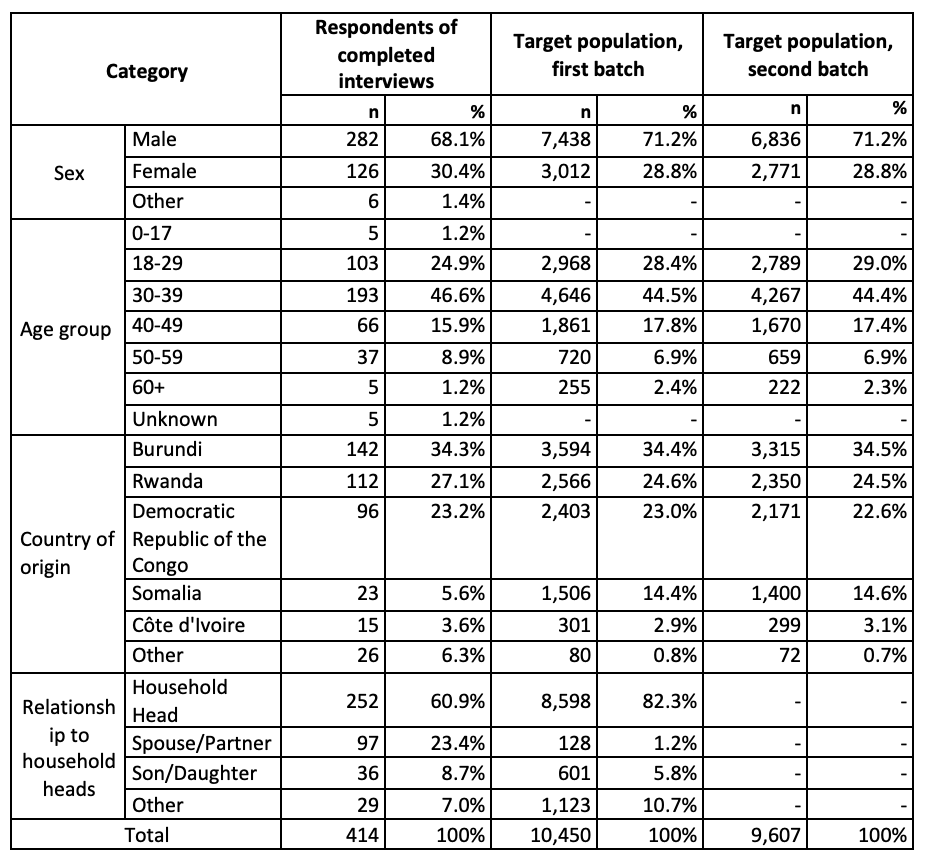
Table 1 Sample selection for Mozambique RMS CATI 2023
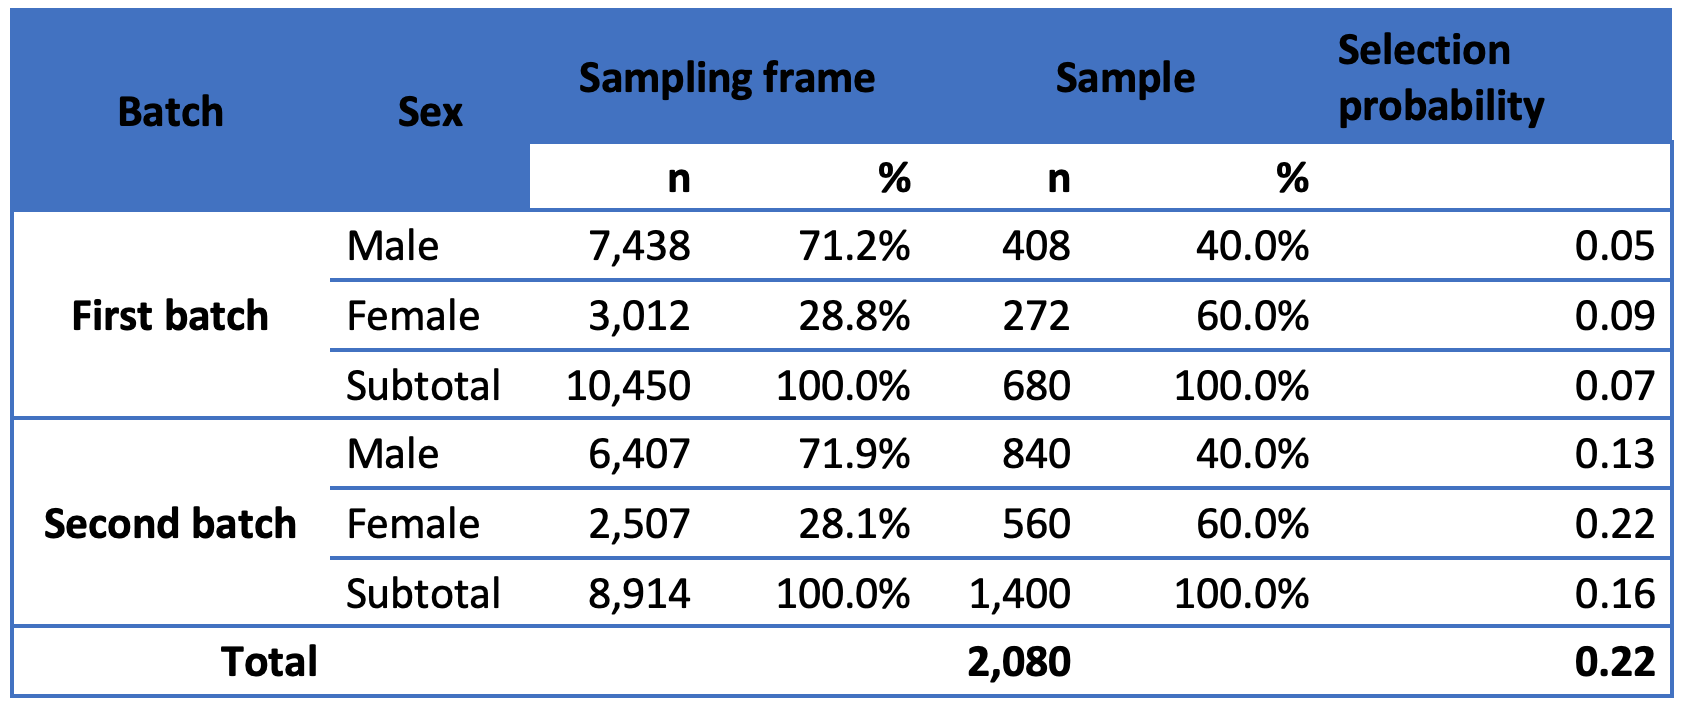
Notes: Total of the sampling frame of the second batch (8,914) is different from total of target population of the second batch appearing in Table 5 (9,607) since the selected individuals in the pilot and the first batch were excluded in sample selection of the second batch. There are the same individuals appearing in the sampling frame both of the first and the second batch, but there is no overlap in the samples drawn in different batches.
Questionnaire
UNHCR already implements several household surveys that serve for different purposes such as nutrition (SENS), socio-economic assessment, protection monitoring or RMS (Results Monitoring Surveys). RMS is one of them which is a household-level survey on forcibly displaced and stateless persons who are directly or indirectly assisted by UNHCR, including refugees and asylum seekers, internally displaced persons, returnees, stateless and others of concern. The objective of the survey is to monitor impact and outcome level indicators on education, healthcare, livelihoods, protection concerns, shelter, and water and sanitation. The results contribute to an evidence base for reporting against UNHCR’s multi-year strategies to key stakeholders.
The RMS can be implemented in any operational context. The data includes indicators collected at both the household and individual (household-member) level, and the survey aims to be statistically representative for the forcibly displaced population. CATI plays a key role on reachability overcoming logistical challenges and identification of hard-to-reach population, although it is limited to the individuals with the registered phone number in proGres. A standard questionnaire has been developed for the RMS, which can be conducted as a stand-alone survey or flexibly integrated with other data collection exercises. The main standard questionnaire is structured for CAPI (Computer Assisted Personal Interviews) where there is another version for CATI (Computer Assisted Telephone Interviews) is made available due to high demand on phone surveys. As a results, the mode of survey is also up to the implementing operations which can be selected as CAPI or CATI.
After the review of UNHCR in Mozambique, the standard questionnaire was adapted per the need of UNHCR. The difference from the standard questionnaire was excluding the variables relevant to some health indicators, particularly measles vaccination for children aged under 5 and births attended by skilled health professionals, as well as addition of options for attitudes towards domestic violence to have additional information relevant to the context of Mozambique.
Data collection
Following the UNHCR procedures of procurement on selecting a data collection partner, CS Research[4], a firm of data collection in Mozambique, was selected for fieldwork. CS Research has a CATI center in Maputo which was a great advantage. The data collection tool was Survey Dooblo To Go[5]; the one that CS Research mainly uses.
The CATI training took place in Maputo in early March 2023 which lasted a total of 3 days. The first day was dedicated to the questionnaire and the protection issues that can emerge specific to forcibly displaced populations to inform enumerators on how to behave. The questionnaire was also explained in detail. The second day included a live trial on tables to test the questionnaire. The third day was the pilot to call given numbers. In the light of response rates obtained during the pilot, the sample was drawn. The agreed number of attempts during the training was 10 attempts with below conditions if the phone number was off or a call with no answer. All call attempts and calling rules were implemented and recorded manually in the KoBo questionnaire.
- The next call should be in the afternoon/ evening if the first call was done in the morning
- The next call should be in the morning if the first call was done in the afternoon/evening
- The time between call attempts should be at least 4 hours
Methodology
In this paper, the main focus is to elaborate on the methodological aspects of data collection via telephone in Mozambique focusing on urban refugees. There are several research question in this study which are about response rates, the respondent’s profile, length of survey and optimal number of attempts within its relation to overall response rates.
First section focuses on the descriptive analysis of response rates. Here, we calculate overall response, refusal, cooperation and contact rates bay using AAPOR Response Rates Calculator 4.1[6] from the the survey to give us an overall idea on the survey. In the second part we analyze the respondent’s profile and compare it with the sampling frame to see if there are any bias towards age groups, genderand the relation of respondent to the head of household. Thirdly, we compare what is the average time spent on completed surveys with the refusal rates rates tosee if the length of survey has any impact on refusal rates. The reason for this is to understand the compatibility of the questionnaire with phone surveys as the questionnaire was adapted to CATI from face-to-face (CAPI) survey.
In addition to this analysis, final dataset that includes 414 respondents re-matched with the sampling frame (ProGres). This helps to see if the respondents basic information such as name and age was corresponding to the information obtained during the survey. This information of course could show the differences between first and second batch of samples where the second batch had more up-to-date information. This information shows us if the recent verifications on proGres can enhance the chances of reaching out to people who were sampled.
Throughout these analyses, there were no sampling weights were used for the dataset. As the stratification of sample was only done for gender and the results were somehow close to the actual sampling frame, we chose not to apply any weights. We assume that the dataset is only representative of the sampling frame.
The last part of this research has a focus on call attempts. To understand the dynamics between call attempts and response rates, firstly we check the simple correlation between the number of attempts and the outcomes of these call attempts which is asked to the interviewer at the beginning of the survey. Then, we check correlation between call attempts and end results to see completion rates which is asked at the end of the survey.
To obtain the optimal number of call attempts, we apply Kaplan-Meier estimates to understand the association of call attempts to response rates to see what chances are of having responses after which attempt. Kaplan-Meier estimate is one of the best options to be used to measure the fraction of subjects living for a certain amount of time after treatment which is the simplest way of computing the survival over time in spite of all these difficulties associated with subjects or situations (Goel, Khanna, & Kishore, 2010). We apply this survival analysis to the number of call attempts. Here the call attempts is used as ‘number of time’ which is the ‘survival probability’ and the event of surviving is when the survey is filled as ‘complete’ by the interviewer at the end of the survey with results options as shown in Table 3. We use R package called ‘km’ and ‘survival’ to finalize our survival analysis. In order to group our results, we compared first batch and second batch to see the impact of verification exercise as the second batch data had almost all household’s information updated as opposed to the first batch.
Results
Response, Refusal, Cooperation and Contact Rates
In this study, a total of 680 (first batch) plus 1,400 (second batch) individuals were sampled in two different rounds. Due to not being able to reach enough respondents during the first round of data collection, the second round of sample was drawn. There were a total of 2,304 attempts for both batches sampled which equals to 2,080 individuals. Of all the attempts, a total of 414 surveys were completed.
Based on the calculations from AAPOR 4.1 tool, the successful contact rate is 30 percent. Of 2,304 call attempts, the response rate on the other hand is even lower than the contact rate with 18 percent at a minimal and 19 percent including the partial interviews as shown in Table 2. Partial interviews are defined when at least one third of survey was completed. The refusal rates were very low (0.06) once interviewers were able to get in contact with sampled survey respondents. Lastly, cooperation rates from the survey were relatively high with 61 percent at a minimal and 73 percent including partial interviews and those who were unable to do interviews due to being incapable of cooperating.
Table 2 Response rates from the call attempts
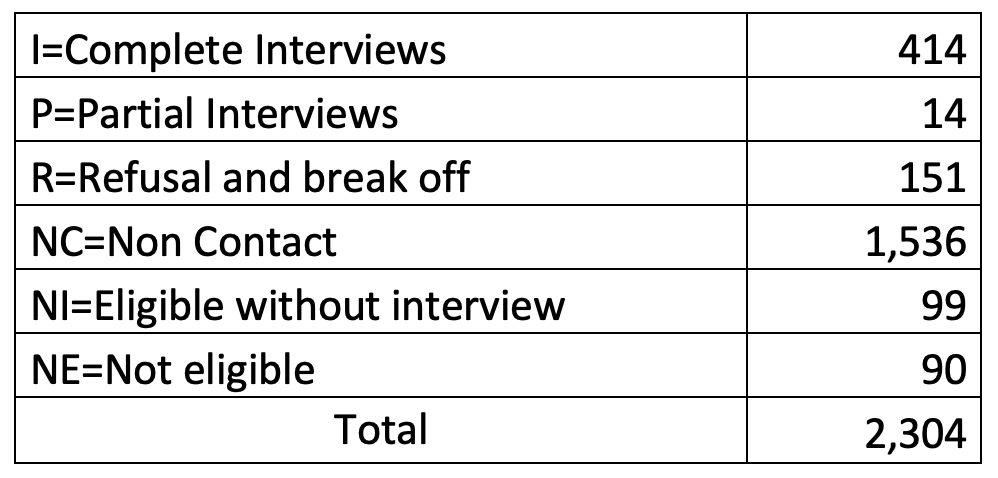
Source: Mozambique RMS CATI 2023
Most non-response rates are caused by non-contact with the respondents as Table 3 shows the end of the survey results filled by enumerator. The main reason is also here proved to be the non-contact as ‘phone switched off’ during call attempts. Another common response is ‘respondent is not reachable after several attempts’ for 232 cases. As previously mentioned, we had initially set a target of 10 attempts. However, it’s worth considering that this number might be excessive, given the possibility of some phone calls being simply out of order. In the subsequent results section, our focus will be on comprehending the significance of the optimal number of call attempts, particularly in scenarios where mobile phone numbers are prone to being outdated.
Table 3 Results of the survey filled at the end of the survey by interviewer
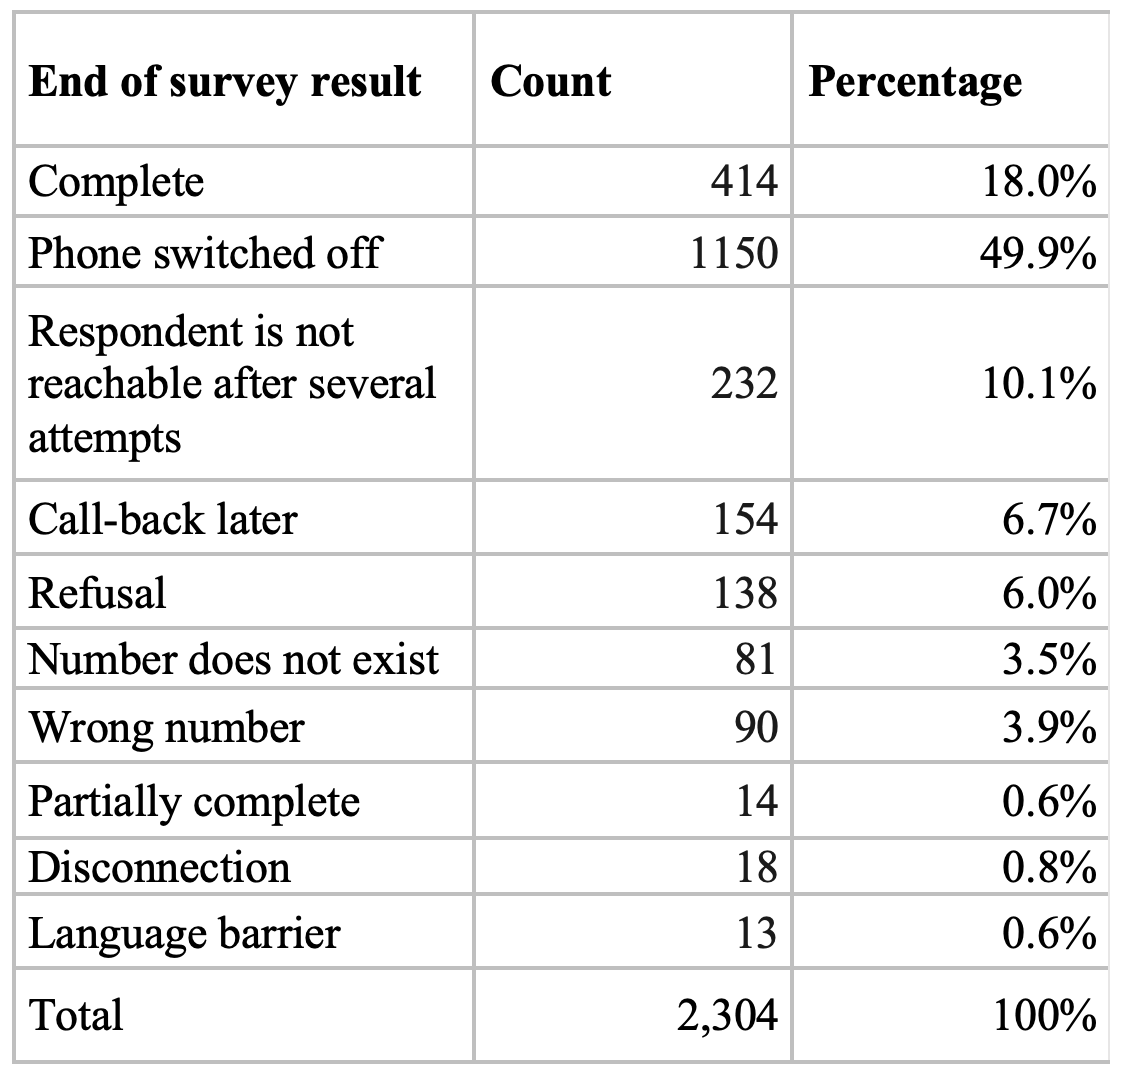
Source: Mozambique RMS 2023 CATI
There were differences between the two batches with the approach taken during the data collection. In the first round, most call attempts were done at least a several times (recommended number was 10) if the phone was switched off. In the first batch, even though, most enumerators tried to call to selected individuals with several calls when they were not reachable, the response rate was still extremely low. This might be due to ongoing verification exercise at the time of the data collection which has resulted in having a first batch having not recently updated contact numbers more than the second batch. In the first batch, out of 1,731 attempts, only 150 of them ended up being a completed survey (8.7 percent).
In the second batch, the targeted 400 household was completed at 522 individuals before exhausting the list which was a total of 1,400 individuals. 573 phone calls have been made and of them 264 of them have been successful (46.1 percent). It has been observed that enumerators did not necessarily try all attempts before switching to next phone numbers if they were not able to reach the respondent. While this seemed like a disadvantage for seeing the optimized call attempts, it ended up being an advantage which allowed us to compare both batches. This showed that in phone surveys, it’s crucial to have up-to-date phone numbers as it dramatically affects the response rates. Both results shows statistically significant results between two batches for response rates and total attempts.
Table 4 Comparison of two batches of sample
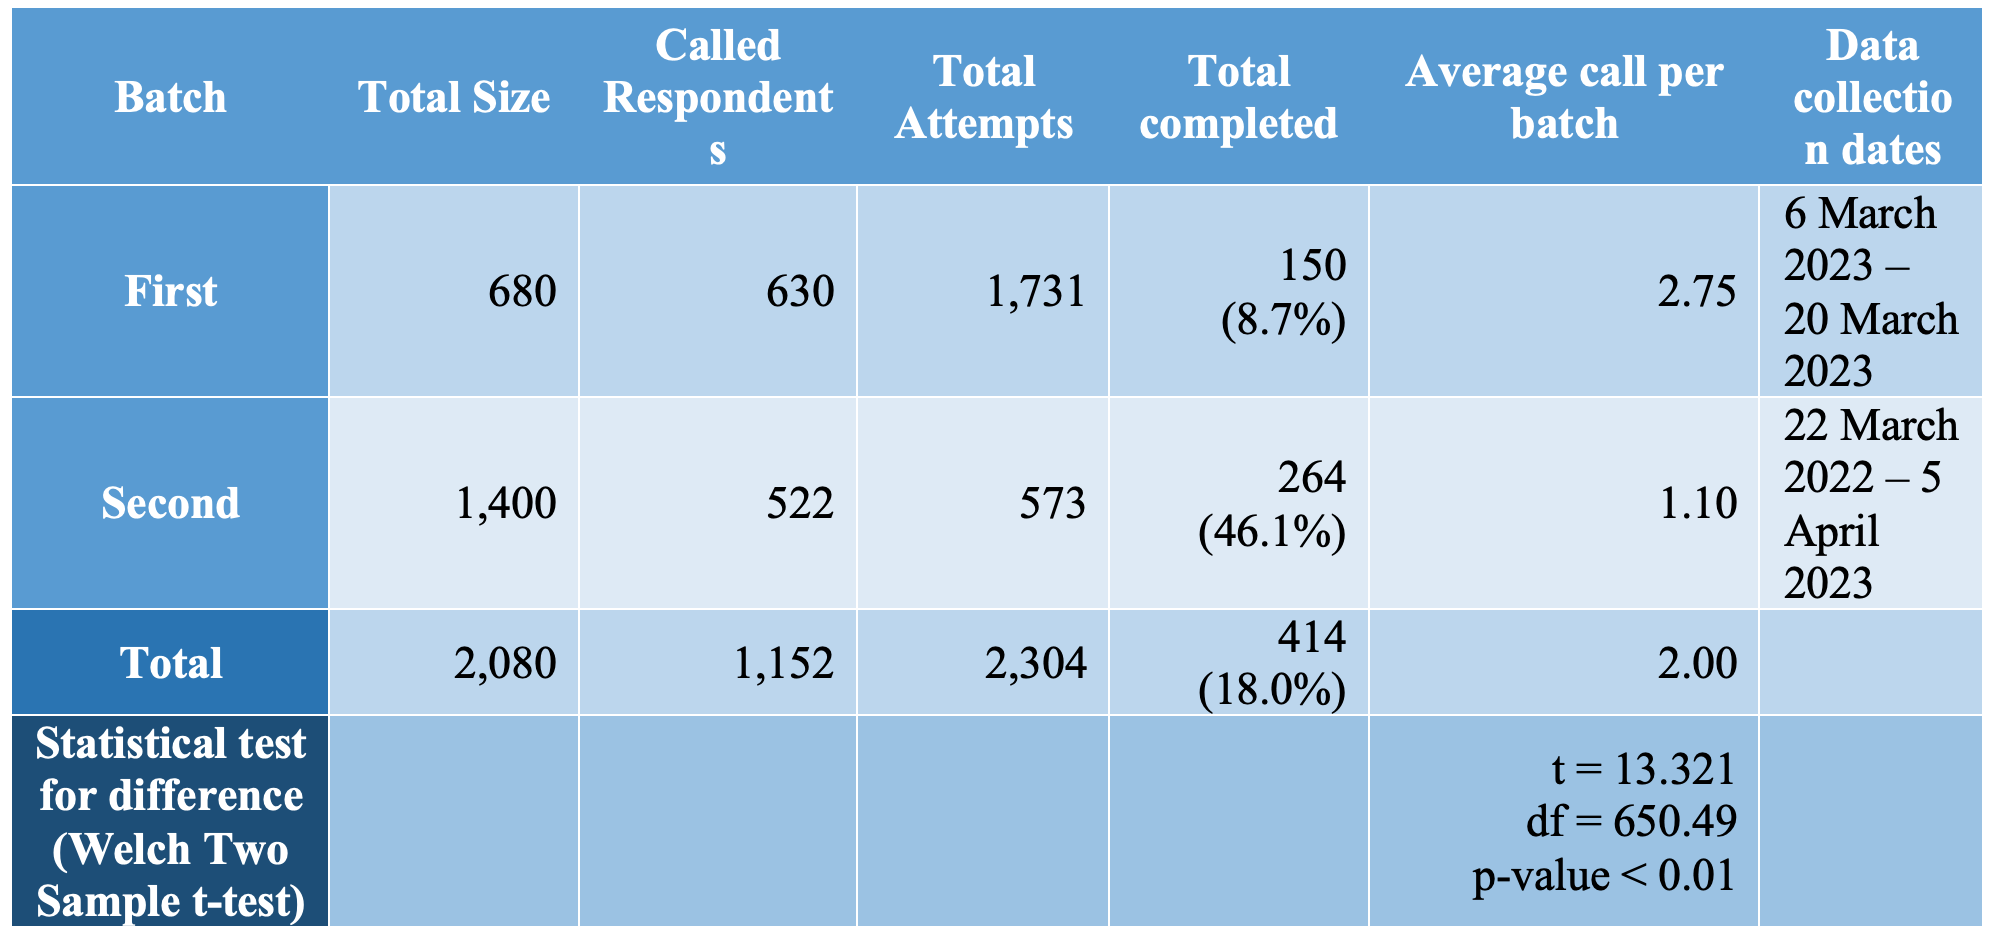
Source: Mozambique RMS 2023 CATI
Respondent’ Profile
This section compares characteristics of the respondents of the completed interviews with the sampling frames both in the first and the second batches. As presented in Table 5, the target population in the first and the second batches shows the similar distribution by sex, age group, country of origin despite the update of proGres. Children aged under 18 years old were not sampled, but some were interviewed during the survey.
The sample was stratified by gender in order to avoid having a gender bias due to having a sampling frame that consists of more male phone numbers than the females. The sample was drawn by having at least 40 percent of females. At the end of survey, there were a total of 126 females and 283 males surveyed, which made it around 30 percent of the sample for females. Even though the female respondents are amplified in the sample, the final results present the similar distribution from the sample frames. This shows that stratification is strongly recommended as even with stratification, number of completed surveys were lower for females. Across age groups and countries of origin, the completed interviews represent major groups of the target population, that is, adults aged from 18 to 59 and top three countries of origin, respectively. The mean age for survey respondents was 36 which did not significantly vary between males and females.
The table below shows most respondents household head or the spouse of the household head which is expected outcome with the use of current sampling frame. All registrations in proGres are made in two categories: individuals and groups. Groups in proGres are not necessarily the same as households, and it could be one of the reasons of the different results of the survey from the target population in the relationship to household heads. By merging household heads and spouse/partner, both the survey results and the target population have similar percentage of this dominant group consisting of more than 80 percent. In this survey, we chose to sample for individuals to have a higher representation of other household members than the head of households. The results show that 252 of the surveyed individuals (60.9%) defined themselves as household heads, 97 of them spouses or partners (23.4%) and another 36 of them were sons or daughters (8.7%).
Phone surveys are tricky to sample to address questions both at the household and the individual levels. In this survey, individual statistical representation of individuals was very important as RMS standard questionnaire CATI version was modified from a CAPI version of the question which had both individual and household level questions. The above results show the importance of drawing the sample from individuals instead of group registrations.
Table 5 Respondents profile of completed interviews with unweighted data and profile of the population
Source: Mozambique RMS 2023 CATI
Notes: Other in each category includes missing values. In the sample frame, i.e., proGres, focal points of registration groups are presented as household heads. Relationship to household heads (focal points) is not available in the sampling frame for the second batch.
Does length of survey affect response rates?
Median is used to measure instead of mean value due to extreme values. The average median length of survey was 36 minutes – which is longer than most phone surveys. Yet, this length did not have any effect on the refusals or drop-outs. There were only 14 surveys that were partially complete who dropped out during the survey. The reason for these 14 dropouts is unknown.
The length of survey did not vary between gender and enumerators. There was equally no difference observed for other variables such as age, and legal status ( asylum seekers vs refugees). The only variable that had an impact on the length of survey was the household size, presented in Table 6 and Figure 1. The RMS standard questionnaire has individual level questions on all households’ members, as a result, the higher the number of people in the household, the more time it takes to complete survey. As shown below, the difference between household size of 1 and 11 has almost 15 minutes time difference on average, and the result of Kruskal-Wallis test shows that the differences of the survey time are significant by household size.
Table 6 Time spent on RMS CATI survey in Mozambique
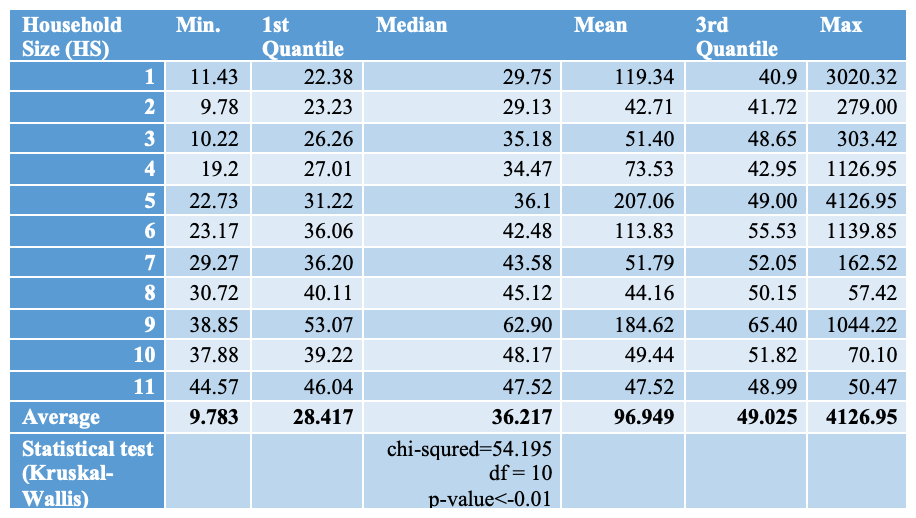
Source: Mozambique RMS 2023
Figure 1 Time spent on RMS CATI survey in Mozambique
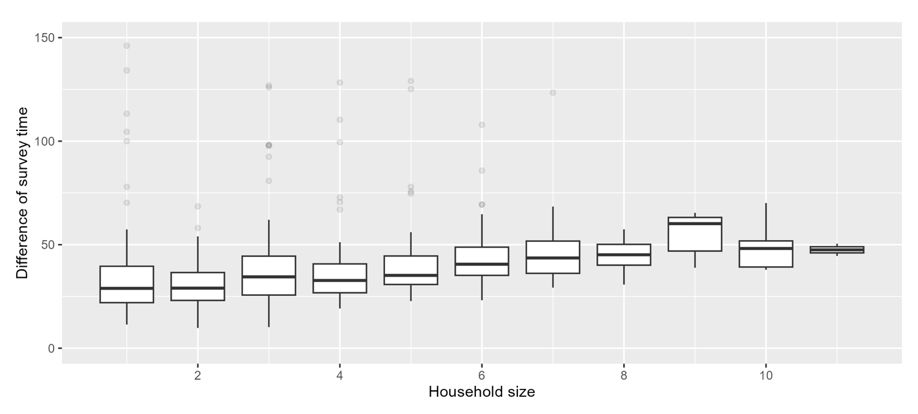
Note: Outliers of more than 150 minutes are excluded in the figure.
How to optimize call attempts : A statistical evidence?
During the training for this survey, enumerators were advised to have a maximum of 10 attempts if the phone number is off. The reason for that was because forcibly displaced populations tend to change their phone numbers more often than the stable populations which affects the response rates. That’s why we decided to check the patterns of call attempts to see if there are any specificities which then can help to optimize the call attempts and unnecessary phone calls if there is no answer or if the phone number is off.
Figure 2 below shows that after the 4th attempt, it is very unlikely to reach out to respondents if the phone number is still off. This might be an indication that phone number of the person has changes and no longer in use. On the other hand, we can observe that if there was no answer, with continuous efforts, it is possible to reach out to the person. Number having someone answer the phone in general is very low after the 4th attempt.
Figure 2 Call attempts by the number of answers to a phone call
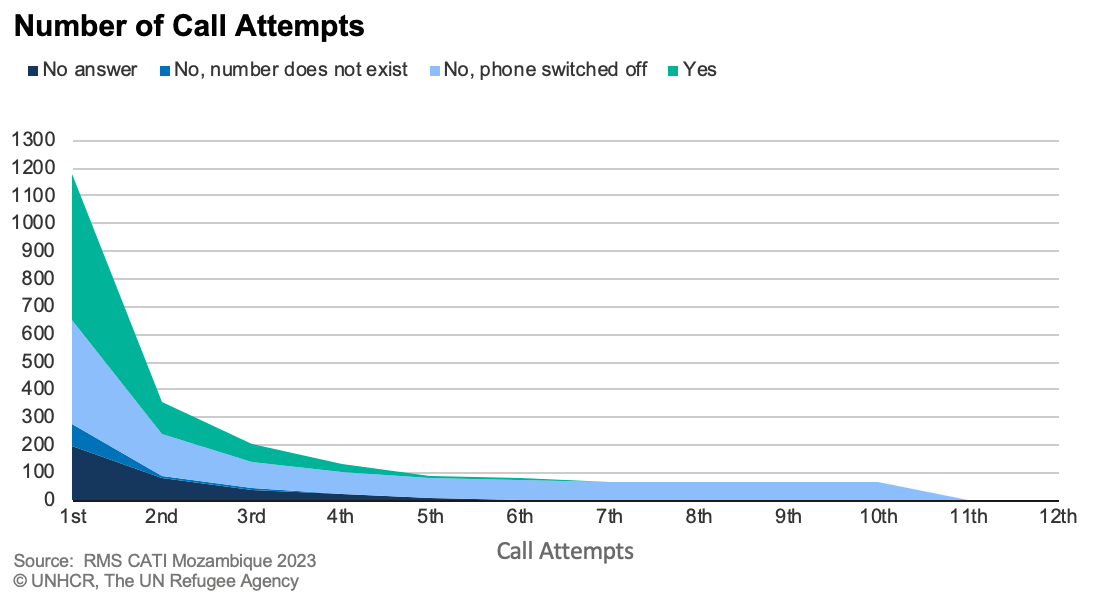
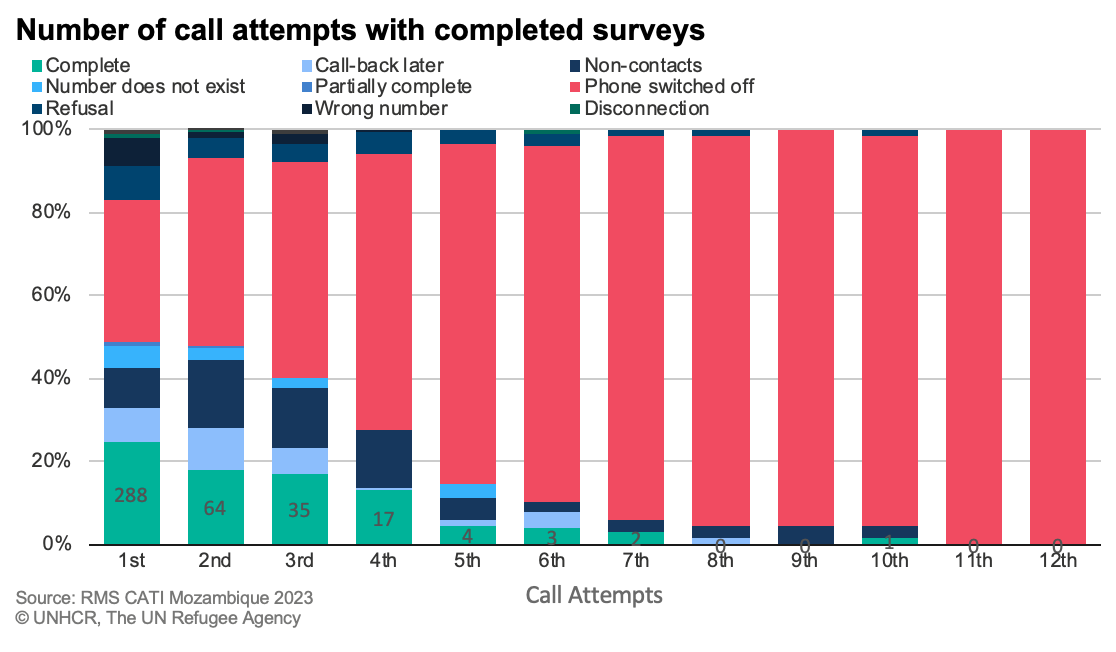
Figure 3 below shows the results at the end of survey compared by the call attempt. Positive completion rates are most likely to happen in the first 4 attempts, after that probability of completing the survey will be very low. In most cases, the phone will be off, or it will be not possible to contact after a several attempts.
Figure 3 Call attempts by the end results of the survey
Kaplan Meier Estimations for Call Attempts
In order to understand the call attempts with in-dept analysis, we have applied Kaplan Meier Estimations in addition to the comparison of call attempts by the end results of survey and phone answers. This will give us indication of after which attempt, the survival (the phone answer) will start to decrease. This can then tell us until how many attempts enumerators should keep trying to have a response and to better understand the response patterns of the sampled individuals. Below Figure 4 shows that survival probably – in this case the probability of having answer to a phone call decreases after 4th attempt.
Figure 4 Kaplan Meier Estimation – Survival Analysis for Call Attempts and Phone Answer
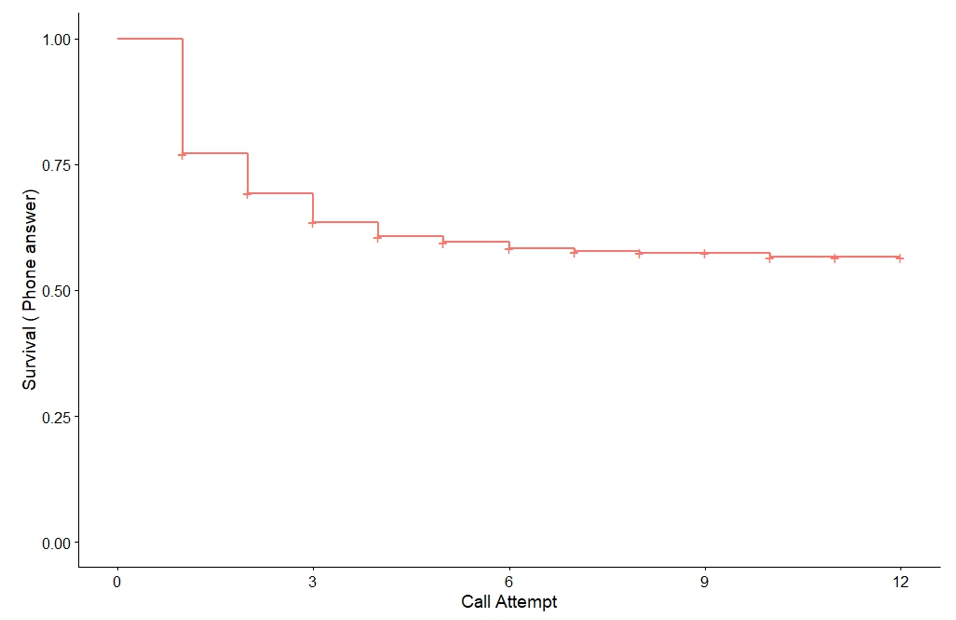
Source: Mozambique RMS CATI 2023
As explained before, there were two different batches were sampled for the survey with some differences. The first batch had more call attempts and the phone number registered were not as up-to-date as the second one. On the other hand, the second batch had more updated numbers and enumerators had tried less call attempts and switched the next phone number without completing 10 call attempts. As a result, the ‘survival probability’ is different.
As Table 7 shows on the second batch, the probability of not being able to have an answer to a phone decrease drastically after the 3rd attempt. For the first batch however, decrease is slower as there are more call attempts. As the second batch has more updated lists, if the probability of reaching out to someone is low, it stays as low due to changing phone numbers. The difference between two batches were not part of the analysis, however, this difference on data collection method allowed us to compare both methods as shown below on Figure 5. The survival rates are significantly different in two batches as shown in Table 7 and Figure 5 shown by a log-rank test.
Table 7 Survival Analysis for Kaplan Meier – Call Attempts vs Phone answer
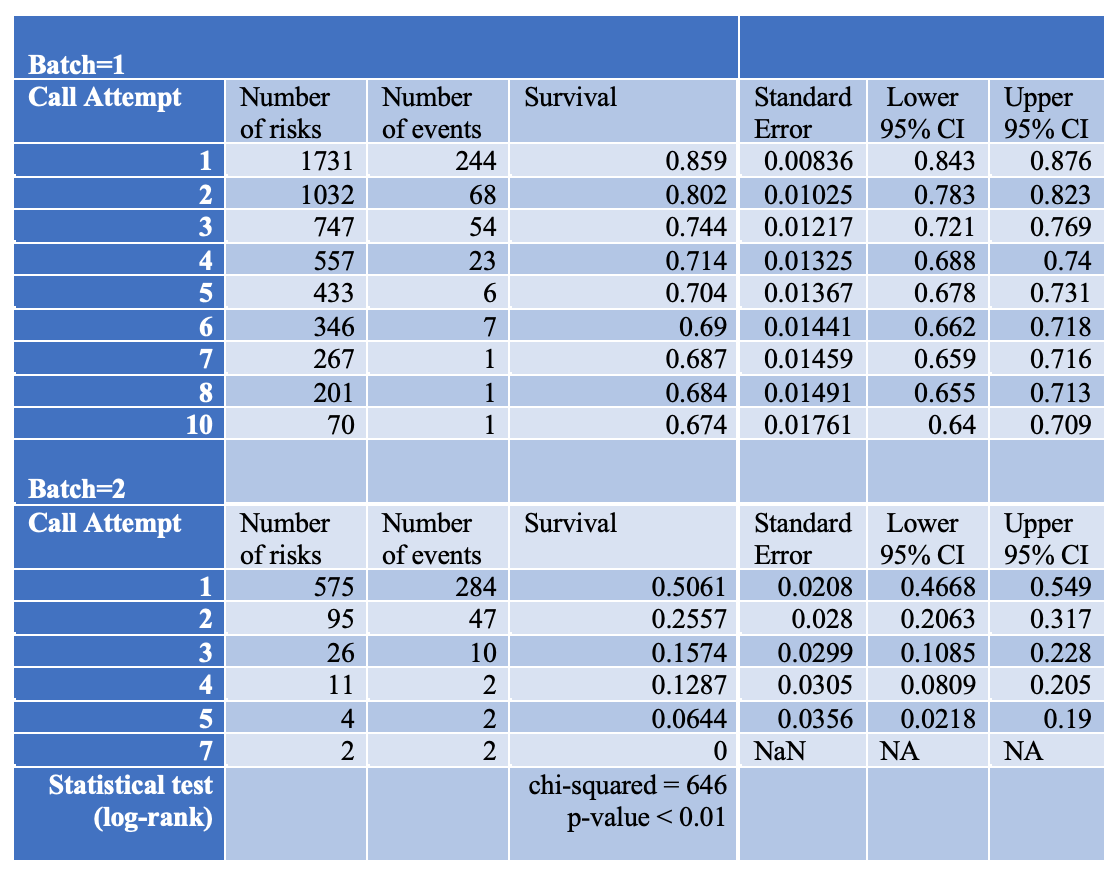
Source: Mozambique RMS CATI 2023
Figure 5 The comparison of two batches with KM survival estimations
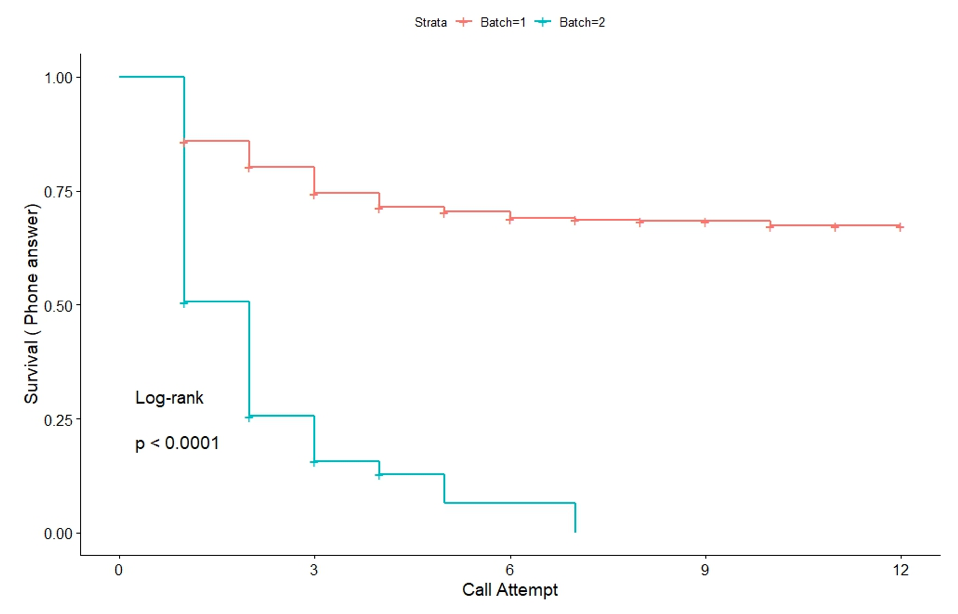
Source: Mozambique RMS CATI 2023
Discussion
Above results from the research questions on response and refusal rates, respondent profile, length of survey and number of call attempts are crucial to guide future mobile phone surveys particularly whose who will target forcibly displaced populations. As phone surveys getting more and more common to apply within hard-to-reach populations, it is important understand the expected challenges prior to data collection in such cases considering the methodological concerns. . This information can then help to guide survey methodologists to better prepare for the difficulties during or posterior to data collection and help to standardize the call attempts and sampling design specifically for hard-to-reach populations including forcibly displaced populations.
In this case study, the focus was on the refugees and asylum seekers in Maputo who are registered with the UNHCR. The sample was selected from UNHCR registration database called proGres within two batches due to even lower response rates than expected (around 30 percent was expected). As the survey could not have completed with the first batch, the second batch of sample was drawn to complete to targeted sample size which is 400. The sample was drawn from individual lists from the administrative database by filtering for those who had mobile phone numbers.
The first results showed that the contact rates were around 30 percent while the minimal response rates were only 18 percent. The refusal rates were very low ( less than 1 percent) and cooperation rates were relatively high (over 70 percent) . This shows that once the respondents wer contacted, the refusal was unlikely by the respondent. Median time spent on the survey was 36 minutes which varied by different household sizes. As there are questions addressed to all household members, the more the household size, the longer the survey took. However, this does not cause any negative impact on the refusals. There were a very few interrupted surveys and low level of refusals, and the reason is unknown.
While drawing the sample, gender stratification was used to make sure to have enough female respondents as there are individual level questions within the sample which requires fair distribution of both genders due to low ratio of mobile penetration of females. The same pattern also applies to relation to the head of households. In this study, gender stratification was helpful to obtain a sample that includes the same percentage of females as in the sampling frame (4,804 of 15,792). The sample was drawn for having at least 40 percent of females and the 30 percent of the respondents were female.
The Kaplan-Meier estimations showed that the likelihood of reaching out to respondents gets lower after 4th attempt on average. This rate differed between two batches as a result of having more updated lists on the second batch due to recent verifications. This proved that if the phone numbers are recently updated or verified, it is likely not being able to reach out to the households after 3rd attempt if the phone number is still off; this might go up to 4th attempt for the lists that are not verified currently verified as in the case of the first batch of sample.
Only around 20 percent (86 out of 415) of the respondents were verified more than a year ago from the first batch of the sample which included 680 individuals. This shows that if the phone number information is not updated or verified, the response rates can be as low as 8.7 percent as this was the case for the first batch compared to the second batch which had a response rate over 20 percent.
This case study overall shows that refusals rates were relatively low and the main reason for non-response rates was outdated phone number from the sampling frame. Gender bias is also observed which is likely to relate ownership of mobile phones and gender disparity on mobile phone ownership. This shows that there is a need to stratification by gender to avoid any bias related to gender.
While CATI surveys are more and more common to be able access to hard to reach populations, it is important to prepare for methodological challenges prior to data collection to ensure high data quality. Below are suggestions to have a better-informed data collection with hard-to-reach populations particularly when the sampling frame comes from UNHCR or administrative databases.
Limitations
While this study was able to bring out new information on phone surveys, it should be noted that due to low response rates and geographic limitation of this study that focuses on urban refugees and asylum seekers in Maputo, it cannot be generalize to forcibly displaced populations. The study sample was also relatively low and it only focused on the registered refugees with progres, as a result it does not include refugees who are not registered or who are registered and who have outdated information on the registered individuals.
Suggestions for future CATI surveys with forcibly displaced populations
- The sample for CATI should always be drawn from the individual lists instead of groups/households in order to capture less biased information for individual level questions.
- On average, 4 call attempts is suggested if the phone number is not reachable. After 4th attempt, the likelihood of having a phone number is very low and it would be better to optimize the time of enumerators instead with new phone numbers.
- The updated information can change the response rates drastically – particularly where phone surveys are applied. As a result, we do not recommend using proGres data for phone survey if UNHCR database is used and if the database is updated more than a year ago. This will cause extremely high non-response rates.
- Gender stratification is crucial. Phone number ownership is already biased towards males; as a result, female representativity within the respondents tend to be low. That’s why sample should be drawn by accounting for gender – or any other variable that can have bias such as relation to head of household or age.
- The length of survey is not ideal as it’s longer than other CATI surveys, however, this does not cause a negative impact on the response rates. This shows the difference of forcibly displaced populations where the non-response rates are mostly caused by not being able to reach the households rather than the survey is being refused.
[1] There is already a blog published online here
[2] At the time of writing, proGres has moved to cloud and v4 is not used anymore.
[3] In proGres, the unit is registration group and individual. The unit of registration group is not exactly the same as the household since several households can composite a registration group or vice versa. Although it’s not correct, the registration groups are assumed to be households.
[4] https://csresearch.co.mz/
[5] https://www.dooblo.net/
[6] Calculator can be accessed here: https://aapor.org/publications-resources/education-resources/response-rates/
References
- Bloch, A. (1999). Carrying Out a Survey of Refugees: Some Methodological Considerations and Guidelines. Journal of Refugee Studies. doi:https://doi.org/10.1093/JRS/12.4.367
- Cecatti, J., Camargo, R., Pacagnella, R., Giavarotti, T., Souza, J., Parpinelli, M., & Osis, M. (2011). Computer-assisted telephone interviewing (CATI): using the telephone for obtaining information on reproductive health. Cad Saude Publica, 1801-8. doi:10.1590/s0102-311×2011000900013
- Dabalen, A., Etang, A., Hoogeveen, J., Mushi, E., Schipper, Y., & von Engelhardt, J. (2016). Mobile Phone Panel Surveys in Developing Countries: A Practical Guide for Microdata Collection. Economics. doi:https://doi.org/10.1596/978-1-4648-0904-0
- Davern, M., McAlpine, D., Beebe, T., Ziegenfuss, J., Rockwood, T., & Call, K. (2010). Are Lower Response Rates Hazardous to Your Health Survey? An Analysis of Three State Telephone Health Surveys. Health Services Research, 1324-1344. doi:10.1111/j.1475-6773.2010.01128
- Dutwin, D., & Burkirk, T. (2020). Telephone Sample Surveys: Dearly Beloved or Nearly Departed? Trends in Survey Errors in the Era of Declining Response Rate. Journal of Survey Statistics and Methodology, 353-380. doi:10.1093/jssam/smz044
- Eckman, S., & Kristen, H. (2022). Innovative Sample Designs for Studies of Refugees and Internally Displaced Persons. En S. Pötzschke, & S. Rinken, Migration Research in a Digitized World (págs. 15-34). Springer Link. doi:10.1007/978-3-031-01319-5_2
- Ganesan, M., Prashant, S., & Jhunjhunwala, A. (2012). A Review on Challenges in Implementing Mobile Phone Based Data Collection in Developing Countries. Journal of Health Informatics in Developing Countries.
- Gillwald, A., Mothobi, O., & Rademan, B. (2019). Policy Paper No. 6: The state of ICT in Mozambique. Obtenido de https://researchictafrica.net/publication/ict-in-mozambique/#:~:text=Gender%20Gap%3AMozambique%20has%20the,only%2032%20percent%20of%20women
- Goel, M., Khanna, P., & Kishore, J. (2010). Understanding survival analysis: Kaplan-Meier estimate. Int J Ayurveda Res., 274-8. doi:10.4103/0974-7788.76794
- Groves, R. M. (2006). Nonresponse rates and nonresponse bias in household surveys. Public Opinion Quarterly, 646-675.
- International Telecommunication Union. (2023). Mobile Phone Subscriptions per 100. Geneva: ITU.
- Kennedy, C. (2010). Nonresponse and Measurement Error in Mobile Phone Surveys. Business.
- Keusch, F., Leonard, M., Sajons, C., & L. Steiner, S. (2019). Using Smartphone Technology for Research on Refugees: Evidence from Germany. Sociological Methods & Research. doi:https://doi.org/10.1177/0049124119852377
- Kristal, A., White, E., Davis, J., Corycell, G., Raghunathan, T., Kinne, S., & Lin, T. (1999). Effects of enhanced calling efforts on response rates, estimates of health behavior, and costs in a telephone health survey using random-digit dialing. Public health reports (1974).
- Labrique, A., Blynn, E., Ahmed, S., Gibson, D., Pariyo, G., & Hyder, A. (2017). Health Surveys Using Mobile Phones in Developing Countries: Automated Active Strata Monitoring and Other Statistical Considerations for Improving Precision and Reducing Biases. Journal of Medical Internet Research. doi:https://doi.org/10.2196/jmir.7329
- Lavrakas, P. J. (2009). The SAGE Handbook of Applied Social Research Methods: Methods for Sampling and Interviewing in Telephone Surveys. Thousand Oaks: SAGE Publications. doi:10.4135/9781483348858
- Leasure, D., Yan, J., Bondarenko, M., Kerr, D., Fatehkia, M., Weber, I., & Kashyap, R. (2023). Digital Gender Gaps Web Application. Zenodo, GitHub, v1.0.0. doi:https://doi.org/10.5281/zenodo.7897491
- Legleye, S., Charrance, G., Razafindratsima, N., Bohet, A., Bajos, N., & Moreau, C. (2013). Improving Survey Participation Cost Effectiveness of Callbacks to Refusals and Increased Call Attempts in a National Telephone Survey in France. Public Opinion Quarterly. doi:https://doi.org/10.1093/POQ/NFT031
- Leo, B., Morello, R., Mellon, J., Peixoto, T., & Davenport, S. (2015). Do Mobile Phone Surveys Work in Poor Countries. Washington, DC: Center for Global Development.
- Marpsat, M., & Razafindratsima, N. (2010). Survey Methods for Hard-to-Reach Populations: Introduction to the Special Issue. Methodological Innovations, 3-16. doi:10.4256/mio.2010.0014
- Mozambique, R. (2023). Data file edition 1.1. CS Research and UNHCR, Data is not yet publicly available.
- O’Toole, J., Sinclair, M., & Leder, K. (2008). Maximising response rates in household telephone surveys. BMC Medical Research Methodology.
- Peytchev, A. (2013). Consequences of Survey Nonresponse. The Annals of the American Academy of Political and Social Science.
- Schweitzer, R., & Steel, Z. (2008). Researching Refugees: Methodological and Ethical Considerations. Sociology. doi:https://doi.org/10.1007/978-1-4020-8567-3_7
- Steinhauer, H. W., Zinn, S., & Will, G. (2019). Sampling Refugees for an Educational Longitudinal Survey. Survey Methods: Insights from the Field.
- Tortora, A. (2021). Response trends in a national random digit dial survey. Advances in Methodology and Statistics. doi:https://doi.org/10.51936/ljbu4218
- (19 de April de 2023). Sustainable Development Goals. Obtenido de https://sdgs.un.org/about
- UNHCR. (2018). Planning and Preparing Registration and Identity Management Systems : Registration Tools. Geneva: UNHCR.
- UNHCR. (2021). Refugee Camps Explained. New York: UNHCR.
- UNHCR. (2021). Urban Refugees. Geneva: UNHCR.
- UNHCR. (20 de April de 2023). Classifying refugee host countries by income level. Obtenido de https://www.unhcr.org/refugee-statistics/insights/explainers/refugee-host-countries-income-level.html
- UNHCR. (17 de April de 2023). Global Appeal. Obtenido de https://reporting.unhcr.org/globalappeal2023#:~:text=117.2%20million%20people%20will%20be,2023%2C%20according%20to%20UNHCR’s%20estimations.
- Vehovar, V., Belak, E., & Batagelj, Z. (2021). Mobile phone surveys: The Slovenian case study. Advances in Methodology and Statistics. doi:https://doi.org/10.51936/thox1964
- Vicente, P., Marques, C., & Reis, E. (2017). Effects of call patterns on the likelihood of contact and of interview in mobile CATI surveys. Survey Methods: Insights from the Field.
- WFP. (2016). Mobile Vulnerability Analysis (mVAM). Rome: WFP.
- Wolf, S., Aurino, E., Brown, A., Tsinigo, E., & Edro, R. (2022). Remote data-collection during COVID 19: Thing of the past or the way of the future? Washington D.C.: World Bank. Obtenido de https://blogs.worldbank.org/education/remote-data-collection-during-covid-19-thing-past-or-way-future
- World Bank. (2020). LSMS High-Frequency Phone Surveys – World Bank. Washington D.C.: World Bank. Obtenido de https://www.worldbank.org/en/programs/lsms/brief/lsms-launches-high-frequency-phone-surveys
- World Bank. (20 de April de 2023). Mobile Cellular Subscriptions ( per 100 people). Obtenido de World Bank Data Bank: https://data.worldbank.org/indicator/IT.CEL.SETS.P2?most_recent_value_desc=true
-
Keywords
calibration CATI coverage coverage bias cross-national surveys data linkage data quality European Social Survey experiment face-to-face face-to-face survey Facebook hard to reach populations incentives item nonresponse measurement measurement error mixed-mode surveys multitasking non-probability samples Nonresponse nonresponse bias nonresponse rates paradata PIAAC Probability sample probability samples QR codes rare populations response rate Satisficing social desirability Social media survey survey-taking climate survey data survey management survey methods Telephone survey telephone surveys total survey error unit nonresponse validity web survey Web surveys weighting
