

The Effect of Operationalization on the Correlation between Objective and Subjective Socioeconomic Status: A Systematic Review and Meta-Analysis
Richter, L. & Menold, N. (2024). The Effect of Operationalization on the Correlation between Objective and Subjective Socioeconomic Status: A Systematic Review and Meta-Analysis. Survey Methods: Insights from the Field. Retrieved from https://surveyinsights.org/?p=19515.
© the authors 2024. This work is licensed under a Creative Commons Attribution 4.0 International License (CC BY 4.0) 
Abstract
Socioeconomic status (SES) plays a fundamental role in social science research and beyond, serving as an important indicator for understanding societal structures and social inequalities. Measuring SES involves diverse approaches, including objective and subjective measures, raising questions about their relationship and the factors influencing its size. This study investigates the correlation between objective and subjective socioeconomic status (OSS and SSS) and evaluates the effect of study context, study design, and operationalization of the measurement on this correlation. We conducted a meta-analysis, starting with a systematic literature search of relevant databases up to July 2021. Multilevel random effects models were employed to estimate the cumulative effect size of the correlation between OSS and SSS as well as the effect of different moderators regarding study context, design, and operationalization of SES indicators. The analysis included 68 eligible articles with 89 studies and 249 bivariate correlations. The estimated cumulative effect size for the correlation between OSS and SSS was 0.3, with a substantial amount of heterogeneity in the data amounting to approximately 98 percent. The correlation was significantly higher when OSS was operationalized as an index and when income was measured (especially household income) compared to education or occupation. OSS and SSS seem to capture different aspects of socioeconomic status and thus cannot be used interchangeably. SSS appears to be more strongly influenced by income than other indicators.
Keywords
education, income, occupation, Socioeconomic status, subjective socioeconomic status
Acknowledgement
We thank our student assistants Tim Donath, David Prinz, Markus Berger and Paula Schneider for their assistance in the study.
Copyright
© the authors 2024. This work is licensed under a Creative Commons Attribution 4.0 International License (CC BY 4.0)
Introduction
Socioeconomic status (SES) is a term originating from the social sciences that is used to describe an individual’s position within a hierarchical structure in society. SES is a fundamental concept widely studied in various research areas such as social sciences, psychology, health research, and political sciences. It is a crucial indicator for understanding societal structures and social inequalities. In the field of psychology, for instance, numerous studies have consistently linked SES to the risk of experiencing mental disorders. Individuals with lower SES are more vulnerable to mental disorders (Lorant et al., 2003a; Lorant et al., 2003b). Similarly, in health research, a clear association has been established between socioeconomic status and health outcomes. This reveals that individuals with lower SES experience poorer health and higher rates of premature mortality (Mielck, 2005). In political sciences, SES plays a crucial role in examining access to political resources, networks, and opportunities (Brady et al., 2015). In educational research, disparities between children from higher and lower socio-economic backgrounds have been studied for decades (Paterson, 1991; Sirin, 2005; White, 1982). Moreover, the relevance of SES extends beyond these specific areas as it impacts various aspects of individuals’ lives. SES reflects the value associated with a particular social position in terms of access to important resources such as income, wealth, and power. SES can be defined either objectively (OSS) or subjectively (SSS).
OSS is determined by the absolute level of material resources an individual possesses and is typically represented by income, education or occupation, as well as by an index of two or three of these indicators (Ganzeboom, 2010; Diener et al., 1993). Data collection on OSS has a long tradition in the social sciences and large population surveys such as the German General Social Survey (GGSS), the European Social Survey (ESS), International Social Survey Program (ISSP), or World Value Survey (WVS) routinely provide data on these variables. To obtain information on OSS in surveys, respondents have been asked to report on their educational degree, occupation, and income. Data collection on these variables is rather complex and can be burdensome for both researchers and respondents. Years of schooling as well as levels of school and professional education have been used as education data (Schneider, 2016). Not all measures may fully reflect the quality of education, however (Adler, 2009). The reporting of income has been found to be distorted by social desirability bias (Krumpal, 2013). Similarly, data collection on occupation often involves either open-ended questions or a comprehensive list of positions, requiring non-trivial coding procedures for the data collected (Beckmann et al., 2016; Zuell, 2016).
An alternative to objective status indicators is the measurement of subjective socioeconomic status (SSS), which also has a long tradition in surveys. In the 1960s and 1970s, SSS was assessed in US surveys by asking respondents which class they belonged to through subjective class identification. Respondents were asked to choose between “lower, working, middle, or upper” class (Kluegel et al., 1977). This approach is widely employed in national and international population surveys, e.g. in Germany, including the German General Social Survey (GGSS), or in the cross-cultural survey programs, including the International Social Survey Program (ISSP). Another survey instrument that captures SSS is the so-called “top-bottom scale” (Kuhn et al., 2019), where respondents place themselves with respect to their socio-economic position. This instrument has also been widely used in survey research, such as the GGSS. Alternatively, a ladder (ranging for example from 1 to 10) that provides a visualization of the top-bottom range (e.g., Kelley & Evans, 1995; Smith, 1986) has also been established in social survey programs (e.g. in the ISSP). Representing the top-bottom continuum as a ladder has also found great popularity as so-called MacArthur scale (Adler et al., 2000) in psychological, behavior, health and related research fields. The MacArthur Scale as provided by Adler et al. (2000) presents participants with a 10-rung ladder on which they indicate their social position relative to others in terms of money, education, and occupation. There are various versions of the MacArthur scale with different frames of reference (e.g. community, neighbors, workplace) (Euteneuer et al., 2015; Giatti et al., 2012), including a Youth Version (Goodman et al., 2001; Sweeting et al., 2011).
Due to the potential burden of collecting data on all three indicators of the OSS, or their homogeneity in some respondents’ groups such as students, researchers often only have access to single indicators of OSS or only to the measurement of SSS. This limitation raises important questions regarding the relationship between the OSS and SSS, as well as the comparative informativeness of each measure as relevant aspects of the content validity of both measures. Given the potential differences in how objective and subjective measures capture different aspects of socioeconomic status, researchers are interested in understanding the extent to which these measures align and which aspects of OSS are judged to be relevant by individuals when they subjectively consider their SES. As this relationship has been reported in many studies, this article reports on a meta-analysis that assesses the correlation between OSS and SSS. In addition to the strength of the correlation, we examine the effects of context and methodology that may influence the size of the correlation between the OSS and SSS.
Background
The correlation between the OSS and SSS can be influenced by how respondents cognitively perceive power dynamics and possess relevant resources when evaluating their subjective position within a group or society (Sudman et al., 1996). Various theories propose different perspectives on the objective status dimensions that individuals consider when assessing their SSS.
The social-psychological exchange model suggests that individuals strive to optimize their social standing by stressing those specific and objective status dimensions that promise the highest prestige and respect from others (Homans, 1958). Segal et al. (1970) further investigated the cognitive process behind individuals’ subjective status assessment. Their findings contradict the social-psychological exchange model and suggest that individuals tend to average their various objective status indicators when defining their subjective social position, rather than focusing singularly on the dimension perceived as most prestigious. Singh-Manoux et al. (2003) propose that individuals consider not only their OSS but also past and future events when evaluating SSS, such as the satisfaction with their standard of living and feelings of financial security for the future. In contrast, Adler et al. (2000) argue that the assessment of SSS includes not only objective indicators of status, but also the value and impact of these components, such as quality of education. These different characteristics of the subjective cognitive representation and individual differences in understanding of status can moderate the size of the correlation between the OSS and SSS.
This correlation has been investigated in meta-analytic studies. Cundiff & Matthews (2017) analyze 31 studies examining the correlation between SSS and health, controlling for at least one objective status indicator (income, education, occupation). SSS was consistently measured in these studies employing the MacArthur Scale (society ladder, community ladder, or an index incorporating both ladders). The main research result was that SSS is more closely related to various health outcomes than OSS, with a distinctive and cumulative correlation with physical health among adults, surpassing the predictive power of traditional objective indicators of SES (Z=0.07, SE=0.01, p<0.05). Furthermore, SSS has been found to have a low level of overlap with the indicators of OSS, as the effect size for the correlation of SSS with income was 0.34 (p < .05), with education 0.25 (p < .05), and with occupation 0.33 (p < .05).
Tan et al. (2020) examine the correlation between socioeconomic status and subjective well-being (SWB), again through a meta-analysis, focusing on the distinction between objective (income, education) and subjective assessments of SES which was measured using either the MacArthur Scale or a perceived status scale (perceived status category from lower to upper class or comparisons of material resources with others). They analyze data from 357 studies, with the results showing a low but significant correlation (r = .32) between OSS and SSS. For the correlation between income and SSS measured by the McArthur Scale, an effect size of 0.33 (p < .05) was found, while the correlation between income and SSS measured by a perceived status scale was 0.26 (p < .05). Similarly, a significant effect size of 0.33 (p < .05) was observed when examining the correlation between education and SSS, measured by the MacArthur Scale. The correlation between education and SSS measured by the perceived status scale was 0.33 (p < .05).
However, results of these studies are limited by the fact that they are restricted to one specific area (health and well-being) and do not include the OSS index. In addition, no account is taken of the effect of different operationalizations of SES and study designs or methodological factors.
Contextual and methodological factors
Research on context effects in surveys has been relevant for decades, and it is well known that respondents’ self-reports in surveys are subject to many different contextual influences, so that the interpretation of findings must take these diverse contexts into account (Kish, 1994; Sudman et al., 1996). Understanding the potential moderating effects of these factors can provide insights into the robustness and generalizability of the correlation between OSS and SSS.
Particularly in the case of meta-analysis studies, the analysis must take into account the fact that the region in which a study was conducted or the scientific field of the study may differ. The region should be considered due to potential cross-cultural differences (Kemmelmeier, 2016) that may arise in terms of different values or different definitions of power, status, and social inequality. The area of the study is important, as the research topic may attract certain groups of respondents, leading to a different selectivity bias in different contexts (Dillman et al., 2014; Groves, 1998).
Secondly, the studies included in a meta-analysis may differ in methodology, making comparisons more difficult. Both probabilistic and non-probabilistic sampling have been used, although the latter severely limits the external validity of the results and the ability to generalize to the population of interest (Groves et al., 2009 Yeager et al., 2011; Bethlehem et al., 2011). A further potential influence on the results is the mode of data collection, including differences in visual or verbal presentation of questions, difficulty of administration, and degree of social desirability (e.g., Dillman et al., 2014). A distinction is made between interviewer and self-administered data collection, with further distinctions such as face-to-face or telephone interviews for interviewer-administered data collection and paper-and-pencil postal and online surveys for self-administered data collection (Dillman et al., 2014). It is well known that results are affected by the mode of data collection, such as interviewer effects and higher social desirability bias in interviewer-administered mode (West & Blom, 2017; DeLeeuw, 2018) and lower comparability bias in interviewer-administered and self-administered modes (e.g., Leitgöb et al., 2023).
Research questions
Our meta-analysis addresses the following research questions:
- How high is the correlation between OSS and SSS?
- How does the size of the correlation differ depending on operationalization of OSS by education, income and occupation as single indicators and by the index variable?
- How does the size of the correlation between OSS and SSS depend on the study context and data collection methods?
Answering these research questions extends previous findings by considering different operationalizations of SES, study field and data collection methods.
Methods
Information sources, search strategy and study selection
A systematic literature search was carried out using the databases Web of Science, PubMed, PsycINFO, Psyndex, IBZ-Online and OLC Sozialwissenschaften up to July 2021. The literature search was conducted according to the Preferred Reporting Items for Systematic Reviews and Meta-Analyses (PRISMA) statement (Moher et al., 2009). The search strategy was developed collaboratively, combining synonyms and related terms of objective and subjective socioeconomic status (detailed search strategy see S1). Title/Abstract and full text screening were performed independently by one of the authors and a research assistant based on the predefined eligibility criteria. All dissents were resolved by consensus.
Eligibility criteria and data extraction
Studies in English and German that measured both objective and subjective status and reported a bivariate correlation between the two indicators were included. The population of interest was the general population aged 18 years or older. Studies that only interviewed students were excluded since data collection on OSS is limited for this group, as students are homogeneous with respect to the OSS indicators. Meta-analyses, Literature reviews, experimental studies manipulating indicators of SES, clinical trials or case-studies, and proxy reports were also excluded. Data extraction was divided between one of the authors and a research assistant, both cross-checking each other’s work. Dissents were resolved by consensus.
Quality appraisal
The quality of the included studies was determined using the NIH Quality Assessment Tool for Observational Cohort and Cross-Sectional Studies with 14 quality criteria (National Institute of Health, National Heart, Lung and Blood Institute). This tool comprises a subjective quality rating (good, fair or poor) of the individual papers, which was quantified based on the numbers of positively assessed quality criteria (good: met all applicable categories; fair: met most categories and low: met minority of categories). The quality of the eligible studies was assessed independently by two researchers. Disagreement and indecisions were resolved by discussion. Most of the included studies (n=63) were rated good on overall quality; 5 of the studies were rated as fair quality (for a more detailed overview of the quality of the included studies see table S2).
PRISMA flow chart of study selection
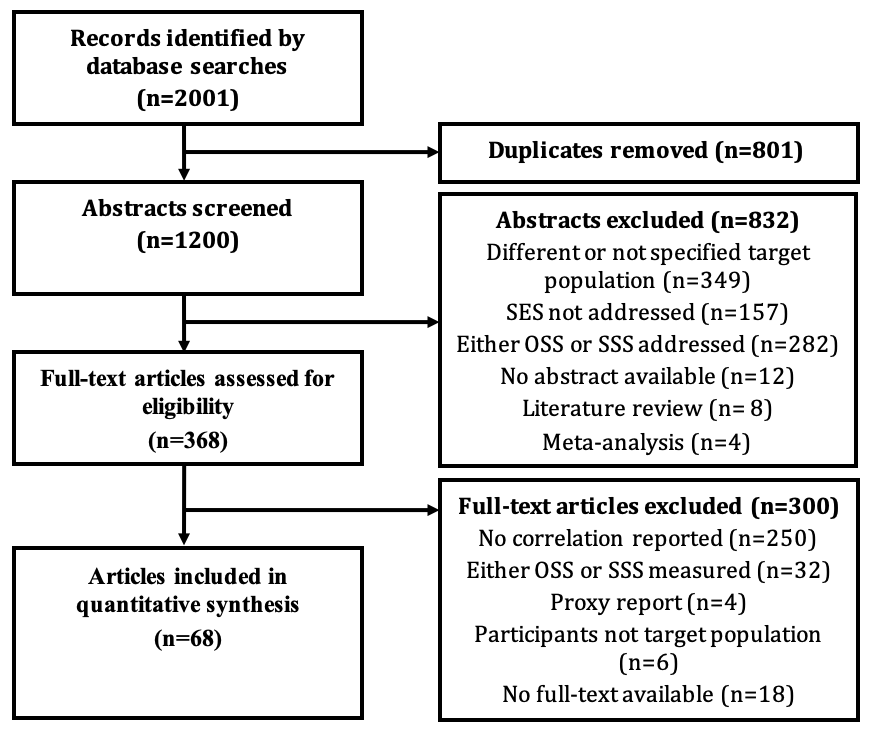
A total of 2001 records were identified up to July 2021. After deleting 801 duplicates, 1200 articles remained, of which 832 articles had to be excluded after abstract screening. One reason for excluding these articles was that participants did not belong to the target population, the target population was not clarified, or the studies addressed a single homogenous group (n=349). For other excluded abstracts, the SES was not considered (n= 157), or either OSS or SSS was addressed (n=282). After screening the remaining 368 full-texts, 300 articles had to be excluded because no bivariate correlations between OSS and SSS were reported (n=250), the study included only one measure of status (n=32), or a full-text was not available (n=18) (see Figure 1). Of the eligible publications, 68 matched the pre-defined inclusion criteria and were included. These publications contained a total of 89 studies with 253 bivariate linear correlations between OSS and SSS. However, six of these correlations were excluded from subsequent analyses as duplicates, resulting in 249 bivariate linear correlations being included in the analysis.
Figure 1 PRISMA flow chart of study selection
Moderators
Different operationalizations of OSS (Income, Education, OSS Index) and Income (Household Income, Personal Income) as well as Education (Highest Level of education, Years of education) and an OSS Index (three indicators: Income, Education, Occupation; two indicators : Income with Occupation or Income with Education) were reported in the studies and therefore included in the analysis. It is worth noting that different operationalizations for occupation were not investigated due to the predominant use of occupational prestige in the evaluated studies. Similarly, different SSS operationalizations were not investigated as the majority of studies used the MacArthur Scale.
Several additional moderators potentially influencing the correlation between OSS and SSS were included in the analysis. In terms of study context, the country setting (USA, Europe, Asia and Other) and research field (Health/Neurosciences, Psychology, Social Sciences) were considered. Regarding study design and methodology, the study type (cross-sectional, longitudinal), sampling strategy (non-random and random sampling), and data collection mode (Face to Face, Telephone, Paper and Pencil Self-administered, Online) were included.
Results
Correlation between subjective and objective socioeconomic status
Data analysis was conducted using R version 4.3.1 and the metafor package, implementing multi-level random effects model, to account for several studies clustered in single publications. With regard to the first research question, the cumulative effect size of the correlations between objective and subjective socioeconomic status was estimated to be small with a coefficient of r=0.30 (SE = 0.02; Z = 19.07, p<0.001). The methods used were Pearson’s correlation (n = 17), Spearman’s correlation (n = 8) and different kinds of correlation dependent on the scale of the variables (n = 3). Other studies did not report the kind of correlations they employed, but all use linear correlations as descriptive statistics for linear regressions and Structural Equation Modeling (SEM). The Q-statistic test for heterogeneity resulted in a significant outcome (Q (df = 247) = 11911.42, p < .001), suggesting substantial variability in the effect sizes across the studies. The observed heterogeneity suggests that there may be underlying factors that contribute to the variation in the correlation between OSS and SSS across different studies.
Factors potentially influencing the correlation between OSS and SSS
The majority of the 249 investigated correlations were derived from studies conducted in the USA (n=146), followed by Europe (n=65) and Asia (n=26). In terms of research field, the highest number of reported correlations came from Health and Neurosciences (n=122), followed by Psychology (n=109) and Social Sciences (n=18). Of the total correlations reported, the vast majority (n=243) stemmed from cross-sectional studies, with only a small number (n=6) from longitudinal studies. Non-random sampling was the most common approach (n=165), followed by random sampling (n=50). Most correlations were derived from face-to-face surveys (n=68), followed by online (n=57) and self-administered surveys (n=34). OSS was mainly operationalized using income (n=103), with the majority using net household income (n=75), and education (n=101), particularly the highest level of education attained (n=73). (See table 1 for a detailed overview of predictors included in the analysis). SSS was primarily operationalized via the MacArthur society ladder (n=160) or MacArthur community ladder (n=42). Our study thus primarily investigates SSS as measured with the MacArthur scale: “a summative judgment of one’s socioeconomic position across the dimensions education, occupation and income” (Adler et al. 2008).
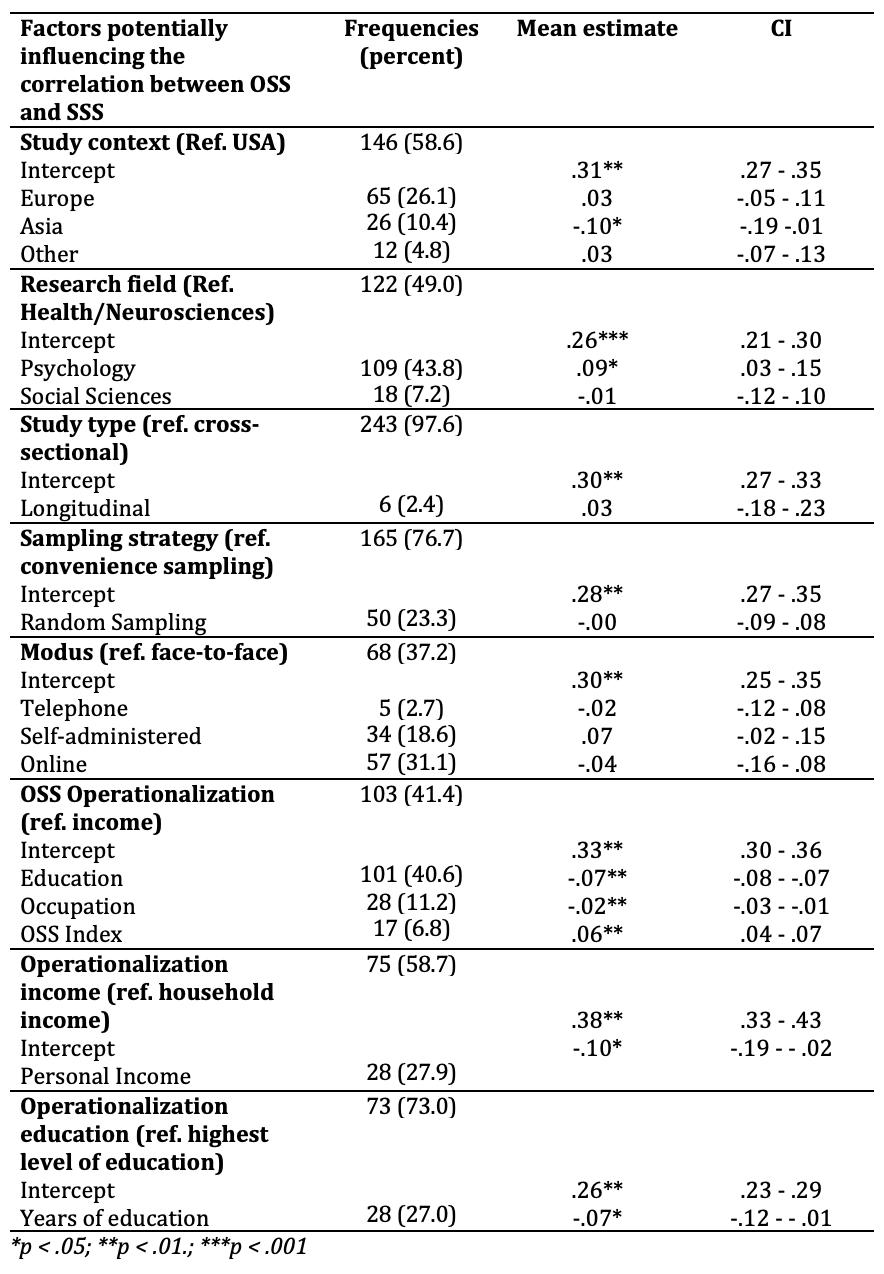
Moderating effects were analyzed using single multi-level meta-regressions including a moderating variable. Table 1 presents the results of the investigated moderators that potentially influence the size of the correlation between OSS and SSS.
Examining the operationalization of OSS (research question 2), the highest correlations with SSS of the size of .49 were observed when OSS was measured using an index comprising two or three objective status components, which was higher than measurement by income, whereas the lowest effect size was obtained for education. In addition, occupation and education are less strongly correlated with SSS than is income. Notably, the correlation between OSS and SSS was particularly strong when income was measured by household income as opposed to individual income. Regarding education, the highest level of education showed a stronger correlation with SSS than the number of years of education. With regard to the third research question, an analysis of the country setting revealed a significant effect, indicating a lower correlation between OSS and SSS in Asia compared to the USA, Europe, and other regions. Furthermore, in terms of the research field, the correlation between OSS and SSS was found to be significantly higher in the field of psychology than in health/neurosciences and social sciences. No significant effects were found for study type (cross-sectional vs. longitudinal), sampling strategy (random sampling vs. non-random sampling), or mode of data collection (face-to-face, telephone, self-administered, online).
Table 1 Potential factors influencing the correlation (Mean Estimate) and Confidence Intervals (CI) between OSS and SSS
Publication bias
Examining the possibility of publication bias is crucial as it can lead to an imbalance of reported effects in the published literature. This bias arises because positive findings are more likely to be published, while null or negative findings may be overlooked. Figure 2 shows the funnel plot examining publication bias using a weighted regression model with multiplicative dispersion. It shows a substantial number of missing publications (n = 34) on the right side of the funnel plot.
Figure 2 Funnel plot examining the likelihood of publication bias; black circles: observed values; white circles: imputed values to correct for potential publication bias
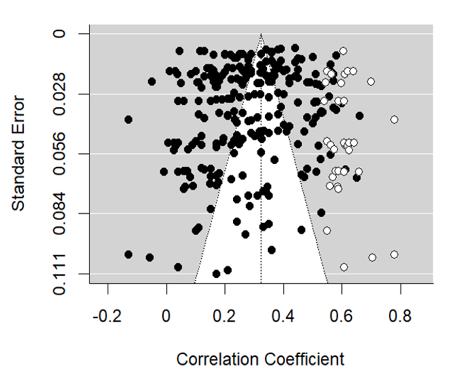
The t-test for funnel plot asymmetry yielded a t-value of -1.0021 (df = 246) and was not significant (p > .10). This means that potentially unpublished results would not change the obtained results significantly.
Discussion
The present study aimed to examine the correlation between OSS and SSS, and to explore potential operationalization, context and data collection method effects as moderators influencing the size of this correlation.
In response to the first research question, multi-level random effects models revealed a low correlation coefficient of .30 between OSS and SSS, comparable to the previous meta-analyses in different areas (Cundiff & Matthews, 2017; Tan et al., 2020).
A substantial amount of heterogeneity in the data was estimated, indicating that consideration of other underlying factors contributing to the variation in the correlations across studies was appropriate. In response to the second research question, the operationalization of OSS was found to influence the strength of the correlation with SSS. More specifically, using an OSS index yielded the highest correlations with SSS, increasing it from a low to middle amount of the effect size. This supports the assumption that respondents may average different aspects of OSS when evaluating their SES subjectively (Segal et al., 1970). Of the different indicators, income (especially household income) was most closely related to SSS, followed by occupation, indicating that it may be subjectively considered more important for SSS than education (Homans, 1958). These results align with recent findings by Oesch & Vigna (2023), indicating that SSS effectively predicts household income, offering insights into an individual’s material situation. This implies that an individual’s economic status, as measured by income and occupation, may be more closely aligned with their subjective perception of social status. Education, especially measured in years of education, seems to be at least an appropriate indicator of SES, which may also be explained by the lower reliability of education measured in years (Ortmanns, 2020).
One limitation is that different operationalizations of occupation are not included, as most by far of the research evaluated used occupational prestige as an indicator. In addition, SSS was mainly measured by one instrument (McArthur Scale), which would have a lower validity than other instruments that were not included and used less frequently. Next, most of the studies treated the OSS and SSS variables as ordinal or continuous and thus investigated linear relationships. Potential non-linearity has not been addressed and is not covered by this research. A higher correlation between SSS and OSS when measured as composite index variable or by income can also be explained by the scaling of both variables as continuous. The next possibility would be the limited operationalization of the OSS by education, occupational prestige and income, and particularly that of the SSS as a one-dimensional construct consisting of one indicator. Considering socio-economic position in terms of the resources one commands and the opportunities and constraints associated with those resources (cf. e.g. Goldthorpe, 2010) would provide more informative measures of both OSS and SSS. Considering the complexity and the multi-dimensionality of the status concept would be expected to produce stronger relationships between the OSS and the SSS. We suggest further research to develop more complex multidimensional measures and to pay more attention to the scaling and potential non-linearity issues.
In response to the third research question, the results show that the strength of the correlation varies according to the scientific discipline in which the studies were conducted and published. The higher correlation for psychology journals than for other areas highlights the importance of considering the field of research when investigating the correlation between social status measures. Further research is needed to explain this. The size of the correlation between OSS and SSS also depended on the geographical area, being higher in the USA and Western Europe than in Asia. This geographical discrepancy suggests that cultural and societal factors such as collectivist and individualistic values (Hofstede, 1980) may play a role in shaping individuals’ subjective perceptions of their social status. Response styles and response sets that were found to differ between Western and Asian cultures (Yang et al., 2010) may also explain this result. It is important to recognize these variations when conducting cross-cultural comparisons or generalizing findings across different regions. However, further research is needed to better understand these cross-cultural differences.
With respect to the methodological decisions, our study found no significant effects of study type, sampling strategy, or survey mode on the correlation between OSS and SSS. This implies that the methodological choices employed in data collection, such as the study design or sampling strategy, do not substantially alter the correlation between these two constructs. This would be explained by the robustness of the correlation coefficients to different survey realization situations, which may differ when estimating other survey statistics such as means or proportions.
In conclusion, the results of this study indicate that the measures of the OSS by education, occupational prestige and income cannot be used interchangeably with those measuring the SSS (particularly the Mac Arthur scale), as correlation between them was found to be relatively low, showing that conflation of OSS and SSS should be avoided. Moreover, the study shed light on contextual factors and operationalization that influence the strength of the correlation between OSS and SSS. SES index and income, particularly household income, were identified as indicators that showed a closer correlation with SSS, which refers to the potentially higher validity of these indicators. When collecting data on OSS, we suggest using index indicators and avoiding the use of education as a single OSS indicator. More research is also needed to investigate both the measurement quality (reliability and validity) of the instruments and the correlation between OSS and SSS when including additional valid instruments, indicators and estimation methods.
References
- Adler, N. E., Epel, E. S., Castellazzo, G. & Ickovics, J. R. (2000). Relationship of Subjective and Objective Social Status with Psychological and Physiological Functioning: Preliminary Data in Healthy White Women. Health Psychology, 19(6), 586–592. DOI: 10.1037//0278-6133.19.6.586.
- Adler, N. E., Singh-Manoux, A., Schwartz, J., Stewart, J., Matthews, K. & Marmot, M. G. (2008). Social Status and Health: A Comparison of British Civil Servants in Whitehall-II with European- and African-Americans in CARDIA. Social Science & Medicine, 66(5), 1034–45. https://doi.org/10.1016/j.socscimed.2007.11.031 Adler, N. E. (2009). Health Disparities through a Psychological Lens. The American Psychologist, 64(8), 663–673. DOI: 10.1037/0003-066X.64.8.663.
- Beckmann, K., Glemser, A. & Heckel, C. (2016). Statistik und Wissenschaft: Demographische Standards (6th rev. ed.). Wiesbaden: Statistisches Bundesamt.
- Bethlehem, J. G., Cobben, F. & Schouten, B. (2011). Handbook of Nonresponse in Household Surveys. Hoboken, NJ: John Wiley & Sons.
- Brady, H. E., Schlozman, K. L. & Verba, S. (2015). Political Mobility and Political Reproduction from Generation to Generation. The ANNALS of the American Academy of Political and Social Science, 657(1), 149–173. DOI: 10.1177/0002716214550587.
- Cundiff, J. M. & Matthews, K. A. (2017). Is Subjective Social Status a Unique Correlate of Physical Health? A Meta-analysis. Health Psychology, 36(12), 1109–1125. DOI: 10.1037/hea0000534.
- DeLeeuw, E. D. (2018). Mixed-Mode: Past, Present, and Future. SRM, 12(2), 75–89. DOI: 10.18148/srm/2018.v12i2.7402.
- Diener, E., Sandvik, E., Seidlitz, L. & Diener, M. (1993). The Relationship Between Income and Subjective Well-being: Relative or Absolute? Soc Indic Res, 28(3), 195–223. DOI: 10.1007/BF01079018.
- Dillman, D. A., Smyth, J. D. & Christian, L. M. (2014). Internet, Phone, Mail, and Mixed-Mode Surveys: The Tailored Design Method (4th ed.). Hoboken, NJ: John Wiley & Sons.
- Euteneuer, F., Süssenbach, P., Schäfer, S. J. & Rief, W. (2015). Subjektiver Sozialer Status: MacArthur-Skalen zur Erfassung des Wahrgenommenen Sozialen Status im Sozialen Umfeld (SSS-U) und in Deutschland (SSS-D). Verhaltenstherapie, 25(3), 229–232. DOI: 10.1159/000371558.
- Evans, M. D. R., & Kelley, J. (2004). Subjective Social Location: Data from 21 Nations. International Journal of Public Opinion Research, 16(1), 3–38.
- Ganzeboom, H. B. G. (2010). A New International Socioeconomic Index. European Journal of Sociology, 51(3), 401–434.
- Giatti, L., Camelo, L. d. V., Rodrigues, J. F. d. C. & Barreto, S. M. (2012). Reliability of the MacArthur Scale of Subjective Social Status: Brazilian Longitudinal Study of Adult Health (ELSA-Brasil). BMC Public Health, 12, 1096. DOI: 10.1186/1471-2458-12-1096.
- Goldthorpe, J. H. (2010). Class analysis and the reorientation of class theory: the case of persisting differentials in educational attainment 1. The British journal of sociology, 61, 311-335.
- Goodman, E., Adler, N. E., Kawachi, I., Frazier, A. L., Huang, B. & Colditz, G. A. (2001). Adolescents’ Perceptions of Social Status: Development and Evaluation of a New Indicator. Pediatrics, 108(2). DOI: 10.1542/peds.108.2.e31.
- Groves, R. M. (1998). Nonresponse in Household Interview Surveys. New York: John Wiley & Sons. Retrieved from https://onlinelibrary.wiley.com/doi/book/10.1002/9781118490082.
- Groves, R. M., Fowler, F. J., Couper, M. P., Lepkowski, J. M., Singer, E., & Tourangeau, R. (Eds.) (2009). Survey Methodology: 2nd Edition. New York: John Wiley & Sons
- Hofstede, G. (1980), Culture’s Consequences: International Differences in Work‐related Values. Beverly Hills, CA: Sage.
- Homans, G. C. (1958). Social Behavior as Exchange. American Journal of Sociology, 63(6), 597–606. DOI: 10.1086/222355.
- Kelley, J., & Evans, M. D. R. (1995). Class and Class Conflict in Six Western Nations. American Sociological Review, 60(2), 157–178.
- Kemmelmeier, M. (2016). Cultural differences in Survey Responding: Issues and Insights in the Study of Response Biases. International Journal of Psychology , 51(6), 439–444. DOI: 10.1002/ijop.12386.
- Kish, L. (1994). Multipopulation Survey Designs: Five Types with Seven Shared Aspects. International Statistical Review / Revue Internationale de Statistique, 62(2), 167–186. DOI: 10.2307/1403507.
- Kluegel, J. R., Singleton, R. & Starnes, C. E. (1977). Subjective Class Identification: A Multiple Indicator Approach. American Sociological Review, 42(4), 599–611. DOI: 10.2307/2094558.
- Krumpal, I. (2013). Determinants of Social Desirability Bias in Sensitive Surveys: A Literature Review. Qual Quant, 47(4), 2025–2047. DOI: 10.1007/s11135-011-9640-9.
- Kuhn, A. (2019). The Subversive Nature of Inequality: Subjective Inequality Perceptions and Attitudes to Social Inequality. European Journal of Political Economy, 59, 331-344.
- Leitgöb, H., Seddig, D., Asparouhov, T., Behr, D., Davidov, E. & Roover, K. de (2023). Measurement Invariance in the Social Sciences: Historical Development, Methodological Challenges, State of the Art, and Future Perspectives. Social Science Research, 110. DOI: 10.1016/j.ssresearch.2022.102805.
- Lorant, V., Deliège, D., Eaton, W., Robert, A., Philippot, P. & Ansseau, M. (2003a). Socioeconomic Inequalities in Depression: A Meta-analysis. American Journal of Epidemiology, 157(2), 98–112. DOI: 10.1093/aje/kwf182.
- Lorant, V., Kampfl, D., Seghers, A., Deliège, D., Closon, M.-C. & Ansseau, M. (2003b). Socio-economic Differences in Psychiatric In-patient Care. Acta Psychiatrica Scandinavica, 107(3), 170–177. DOI: 10.1034/j.1600-0447.2003.00071.x.
- Mielck, A. (2005). Soziale Ungleichheit und Gesundheit: Einführung in die Aktuelle Diskussion (1st. ed.). Bern: Verlag Hans Huber. Retrieved from http://www.socialnet.de/rezensionen/isbn.php?isbn=978-3-456-84235-6.
- Moher, D., Liberati, A., Tetzlaff, J. & Altman, D. G. (2009). Preferred Reporting Items for Systematic Reviews and Meta-analyses: The PRISMA Statement. PLoS Medicine, 6(7). DOI: 10.1371/journal.pmed.1000097.
- National Institute of Health, National Heart, Lung and Blood Institute. (2021, July). Study Quality Assessment Tools. Retrieved from https://www.nhlbi.nih.gov/health-topics/study-quality-assessment-tools
- Noll, H.-H. (1999). Subjektive Schichteinstufung. In W. Glatzer & I. Ostner (Eds.), Deutschland im Wandel (147-162). Wiesbaden: VS Verlag für Sozialwissenschaften.
- Oesch, D. & Vigna, N (2023). Subjective Social Class Has a Bad Name, but Predicts Life Chances Well. Research in Social Stratification and Mobility, 83. DOI: 10.1016/j.rssm.2023.100759
- Ortmanns, V. (2020). Issues in Measuring Education in Cross-national and Migration Surveys. Universität Mannheim, Germany [Dissertation].
- Paterson, L. (1991). Socio-economic Status and Educational Attainment: A Multi-dimensional and Multi-level Study. Evaluation & Research in Education, 5(3), 97–121. DOI: 10.1080/09500799109533303.
- Schneider, S. L. (2016). The Conceptualisation, Measurement, and Coding of Education in German and Cross-National Surveys (GESIS Survey Guidelines). Mannheim: GESIS – Leibniz Institute for the Social Sciences. DOI: 10.15465/gesis-sg_en_020.
- Segal, D. R., Segal, M. W. & Knoke, D. (1970). Status Inconsistency and Self-Evaluation. Sociometry, 33(3), 347. DOI: 10.2307/2786162.
- Singh-Manoux, A., Marmot, M. G. & Adler, N. E. (2005). Does Subjective Social Status Predict Health and Change in Health Status Better Than Objective Status? Psychosomatic Medicine, 67(6), 855–861. DOI: 10.1097/01.psy.0000188434.52941.a0.
- Singh-Manoux, A., Adler, N. E. & Marmot, M. G. (2003). Subjective Social Status: Its Determinants and its Association with Measures of Ill-health in the Whitehall II Study. Social Science & Medicine, 56(6), 1321–1333. DOI: 10.1016/s0277-9536(02)00131-4.
- Sirin, S. R. (2005). Socioeconomic Status and Academic Achievement: A Meta-Analytic Review of Research. Review of Educational Research, 75(3), 417–453. DOI: 10.3102/00346543075003417.
- Smith, T. (1986). Internationally Comparable Measurement of Subjective Social Class. Presentation to the April 1986 Planning Meeting of the International Social Survey Programme, Mannheim, Germany.
- Sudman, S., Bradburn, N. M. & Schwarz, N. (1996). Thinking About Answers: The Application of Cognitive Processes to Survey Methodology. San Francisco: Jossey-Bass.
- Sweeting, H., West, P., Young, R. & Kelly, S. (2011). Dimensions of Adolescent Subjective Social Status Within the School Community: Description and Correlates. Journal of Adolescence, 34(3), 493–504. DOI: 10.1016/j.adolescence.2010.06.001.
- Tan, J. J. X., Kraus, M. W., Carpenter, N. C. & Adler, N. E. (2020). The Association Between Objective and Subjective Socioeconomic Status and Subjective Well-being: A Meta-analytic Review. Psychological Bulletin, 146(11), 970–1020. DOI: 10.1037/bul0000258.
- West, B. T. & Blom, A. G. (2017). Explaining Interviewer Effects: A Research Synthesis. Journal of Survey Statistics and Methodology, 5(2), 175–211. DOI: 10.1093/jssam/smw024.
- White, K. R. (1982). The Relation Between Socioeconomic Status and Academic Achievement. Psychological Bulletin, 91(3), 461–481. DOI: 10.1037/0033-2909.91.3.461.
- Yang, Y., Harkness, J. A., Chin, T.-Y. & Villar, A. (2010). Response Styles and Culture. In: J.A. Harkness, M. Braun, B. Edwards, T.P. Johnson, L. Lyberg, P.P. Mohler, et al. (eds.), Survey Methods in Multinational, Multiregional, and Multicultural Contexts (203–223). Hoboken, NJ: John Wiley & Sons.
- Yeager, D. S., Krosnick, J. A., Chang, L., Javitz, H. S., Levendusky, M. S., Simpser, A. & Wang, R. (2011). Comparing the Accuracy of RDD Telephone Surveys and Internet Surveys Conducted with Probability and Non-Probability Samples. Public Opinion Quarterly, 75(4), 709–747. DOI: 10.1093/poq/nfr020.
- Zuell, C. (2016). The Coding of Occupations (GESIS Survey Guidelines). Mannheim: GESIS – Leibniz Institute for the Social Sciences. DOI: 10.15465/gesis-sg_en_019.
- Zuell, C. (2015). Berufscodierung (GESIS Survey Guidelines). Mannheim: GESIS – Leibniz Institute for the Social Sciences. DOI: 10.15465/gesis-sg_019.
-
Keywords
calibration CATI coverage coverage bias cross-national surveys data linkage data quality European Social Survey experiment face-to-face face-to-face survey Facebook hard to reach populations incentives item nonresponse measurement measurement error mixed-mode surveys multitasking non-probability samples Nonresponse nonresponse bias nonresponse rates paradata PIAAC Probability sample probability samples QR codes rare populations response rate Satisficing social desirability Social media survey survey-taking climate survey data survey management survey methods Telephone survey telephone surveys total survey error unit nonresponse validity web survey Web surveys weighting
