

A myriad of options: Validity and comparability of alternative international education variables
Silke L. Schneider  GESIS - Leibniz Institute for the Social Sciences, Germany
Julian Urban GESIS - Leibniz Institute for the Social Sciences & Trier University, Germany
Schneider S.L. & Urban J. (2025). A myriad of options: Validity and comparability of alternative international education variables. Survey Methods: Insights from the Field, Special issue ‘Advancing Comparative Research: Exploring Errors and Quality Indicators in Social Research’. Retrieved from https://surveyinsights.org/?p=19796
© the authors 2025. This work is licensed under a Creative Commons Attribution 4.0 International License (CC BY 4.0) 
Abstract
Education is a key variable in survey-based research, impacting various outcomes and serving as a cornerstone in social stratification research. However, measuring education in cross-national surveys is challenging due to the complexity and variability of educational systems across countries. For comparative research, the education variable does not only need to be valid, but also comparable across countries, which implies a similar degree of validity in different countries. Simultaneously, education measures need to be parsimonious, especially for self-administered surveys. This study, expanding on previous research, evaluates the validity and comparability of 16 alternative education coding specifications using nearly 400 dependent variables to identify an optimal solution that could serve as a standard. We use European Social Survey (ESS) rounds 5 to 10 data, which provide a highly detailed international education variable serving as a benchmark. Results suggest that, while no alternative variable performs as well as the benchmark, a variable comprehensively covering educational quality ranks second in terms of validity, while the three-digit version of ISCED 2011 with a reduced quality indicator and coverage of the general/vocational divide, yields better comparability across countries than the other alternatives. These findings offer insights for comparative surveys to select an optimal international education variable for different survey modes and for researchers analysing survey data.
Keywords
classification, comparability, cross-national surveys, data quality, education, European Social Survey, harmonisation, measurement, socio-demographics, survey data, validity
Acknowledgement
We would like to thank the European Social Survey (ESS) for supporting this research. It was motivated by the need to re-consider the detailed measurement and coding of education performed since round 5 (2010) in the ESS in light of the upcoming switch from face-to-face interviewing to self-completion modes (web and mail). Also, we would like to thank the participants at the 22nd ESS National Coordinators’ Forum in November 2023 and the participants at the ESS Virtual seminar 'Education in the ESS', also in November 2023, as well as two anonymous reviewers, for their valuable feedback. Any recommendations made in this paper, as well as potential errors, are our own.
Copyright
© the authors 2025. This work is licensed under a Creative Commons Attribution 4.0 International License (CC BY 4.0)
1. Introduction
Education, or more precisely, the highest level of formal education attained by a person, is one of the most often used variables in social science research based on survey data (Smith, 1995, p. 199). It shows net correlations with more attitudinal outcomes than any other background variable commonly controlled for (Davis, 1979), and is a core variable in social stratification research (e.g., Breen, 2004; Shavit & Blossfeld, 1993). This makes it an essential variable for all national and cross-national surveys.
For national surveys, education needs to be measured in a reliable and valid way. For cross-national surveys, it additionally needs to be measured in a cross-nationally comparable way. This is difficult to achieve due to the stark differences across countries in how formal education is organised. The standard solution to this problem is to harmonise national education variables into a generic international variable (Braun & Müller, 1997; Schneider, 2016).
The harmonisation process may, due to the reduction of information by combining detailed national categories into generic international categories, negatively affect the validity of the education measurement, though. Variables measured with low validity can lead to biased estimates (Aronow & Samii, 2016; Brakenhoff et al., 2018; Collot & Hemauer, 2021; Zawadzki et al., 2023). First, the low validity of the education measure in a country can result in an underestimated association between education and another variable of interest in this country. This occurs because the imprecise measurement fails to capture the full range of variation in education, weakening the observed associations. As a consequence, this education association is not comparable to those in other countries, and differences in the size of the association across countries may be under- or overestimated (see, e.g., Kerckhoff & Dylan, 1999). Second, the low validity of an education measure restricts the possibility of effectively controlling for the effects of education in these countries when predicting outcomes in multivariate regression models: systematic variation in the dependent variable may be falsely attributed to third variables correlated with education because the education variable with low validity does not account for this variation, leading to biased estimates of third variables. This bias may again vary across countries, leading to the non-comparability of the effects of third variables in the model.
Comparability can generally, i.e. beyond the scope of education, be conceptualised in terms of “comparative validity” (Schneider, 2009): if a measure is more valid in some countries than others, it is not comparable across countries. Comparability requires a similar degree of validity across countries, i.e. a consistent reduction in explanatory power across countries when using an internationally harmonised instead of a national measure (Kerckhoff et al., 2002, p. 106). This can be achieved by using a highly detailed measure, which does not lose much validity in any country and thus shows a high degree of comparability as well. However, detailed measurement is more resource-intensive for survey designers and may be burdensome for survey respondents. A crucial question is, therefore, how simple an international education measure can be (how few categories can be used) without ‘harmonising away’ relevant (i.e., empirically predictive) aspects of educational attainment. Against this backdrop, our research question is: Which comparative education variable achieves the highest degree of validity and comparability across countries without requiring a large number of categories, and could thus serve as a standard? To answer this question, this paper evaluates the concurrent validity and comparability of a large set of ‘candidate’ international education variables, many of which have not been assessed before, in a cross-national survey covering many European countries. It aims to identify an ‘optimal’ way of coding educational attainment in cross-national surveys, i.e., a variable with high concurrent validity and comparability that is, at the same time, as simple as possible (i.e. a variable with fewer categories is preferable). This will enable comparative surveys to select an international target variable based on empirical evidence and researchers to analyse data using a validated education coding scheme.
The paper proceeds as follows: The next section presents the concept of education and its subdimensions that are more or less well-reflected in different education measures. It then introduces established international education classifications, as well as previous research on their concurrent validity and comparability. Section 3 describes the data, the candidate comparative education variables based on these classifications that entered the ‘competition’, and the methods. Section 4 presents the results. These are summarised and discussed in section 5, where conclusions are also drawn.
2. Conceptual and methodological background and previous research
2.1 What is educational attainment, and how is it measured in surveys?
Educational attainment, as it is commonly measured in surveys, refers to the highest educational level an individual has successfully completed, which is usually indicated by the highest qualification obtained (OECD & Eurostat, 2014). In his conceptual and empirical analysis of education measurement in surveys, Smith (1995) differentiates between four subdimensions or aspects of education: quantity, quality, content, and type. He notes that:
“While these various, complex aspects of education are often considered extensively in the education research literature and the multifaceted nature of education is acknowledged by social scientists …, most are typically ignored in general social science research using education. The vast majority of sociological work with education relies on measures of educational quantity and omits all other aspects” (Smith, 1995, p. 220).
While surveys may have improved the education information available in their data, going beyond mere ‘levels of education’ (e.g. ESS Data Archive & Schneider, 2023; ISSP Demographic Methods Group (DMG), 2021), many empirical studies still resort to more or less simplified measures using e.g. only three broad education categories or (hypothetical or reported) years of education, even when more comprehensive measures are available (e.g. Caferra et al., 2021; Kenny & Luca, 2021; Kulin et al., 2021; Landwehr & Ojeda, 2021; Lipps & Schraff, 2021). The focus on the quantity of educational attainment is not only a problem for the validity of education measures in a national context. If different aspects of education are not equally relevant across countries, concentrating on quantity alone may also lead to a low level of comparability. Therefore, cross-national education measures may need to consider subdimensions other than quantity. We will go through Smith’s conceptual subdimensions one by one and examine whether and how they can be measured and what this means for international education variables.
Quantity: “The quantity or amount of schooling measures the length and scope of one’s educational experience and the highest level of schooling obtained” (Smith, 1995, p. 216). This aspect of education closely corresponds to the highly influential concept of human capital investments (Becker, 1964). In the US, this aspect of education is measured using years of schooling or the highest degree obtained. In European countries, with their higher number of transition points throughout the educational career and different educational qualifications offered at the same level of education, quantity is usually measured by the level of the highest educational qualification obtained by a respondent. In international education variables, national qualifications are classified into internationally defined educational levels reflecting the quantity dimension (see section 2.2).
Quality: “Quality of schooling can refer to the school, a particular program or major, specific courses and instructors, and the amount of learning a student actually achieves…. At the institutional level, it refers to differences between schools in their academic rigor and standards. … Sometimes the type of college (junior/community, 4-year, university, research university) is used as a surrogate for quality” (Smith, 1995, p. 217). In the European context, especially the German-speaking countries and the Netherlands, have stratified secondary school systems, with differing academic standards in different types of schools (Allmendinger, 1989). International education variables partially cover the quality of education by sub-levels that indicate whether a qualification gives access to higher-level (e.g. tertiary) education, and sometimes specific types of higher-level (e.g. higher) education. Education preparing for higher education levels is assumed to be more academically demanding than education that ‘only’ leads to the labour market, and even more so if it prepares for the most selective and prestigious higher-level programmes.
Content of education “or what is being taught, refers to one’s course of study, to other non-course elements of schooling, and to the particular substance of specific courses and programs” (Smith, 1995, p. 218). This is, in international surveys, most closely represented by the field of education of the highest qualification, which is measured, if at all, by a separate questionnaire item. Field of study is usually regarded as a separate concept and, therefore, beyond the scope of this study. At a very broad level, the differentiation of general and vocational education in national and international education variables, however, also reflects educational content. In the sense that vocational education is often regarded as academically less rigorous than general education, this aspect overlaps with the quality aspect. However, this overlap is neither necessary nor empirically perfect, so it appears legitimate to distinguish between the quality and content of education, both conceptually and empirically.
Types of education can even more so overlap with quantity, quality, and content of education. Simplifying the quantity dimension into broader levels leads to types like primary, secondary, and tertiary education. The broad content distinction of general and vocational education can also be regarded as “types”. Some types that have not yet been mentioned and that are not reflected in any international education variable concern the governance and sponsorship of the providing institution (e.g. public, private, or church-based), or whether a vocational program is entirely school-based or combines learning on the job and in vocational school. So, while international education variables distinguish some ‘types’ of education, which overlap with aspects of education already mentioned, they do not cover all potentially relevant types of education discussed by Smith (1995).
In contrast to educational attainment and its indicator of the highest formal qualification obtained, skills and competencies refer to what a person can actually do. While this is related to educational attainment, both concepts are distinct and have their own merits and issues. IEA’s “Trends in International Mathematics and Science Study” (TIMSS, e.g. von Davier et al., 2024) and OECD’s “Programme for International Student Achievement” (PISA, e.g. OECD, 2023), for example, report test scores of students at the same age before actually obtaining their highest qualification, thus reflecting the quality but not the quantity of education. OECD’s “Programme for the International Assessment of Adult Competencies” (PIAAC, e.g. OECD, 2024), in contrast, measures adult skills. While these reflect both the quantity and quality of education, they are also affected by non-formal learning and cognitive decline after formal education. While test scores would be a conceptually valuable addition, they are not feasible to include in most general social surveys.
2.2 Established comparative education classifications
Two established comparative education classifications are used in cross-national data and research. The International Standard Classification of Education (ISCED) was first developed in the early 1970s by UNESCO for official international education statistics (Goldstone, 1973, 1975; UNESCO, 1978). It was first revised in 1997 (UNESCO Institute for Statistics, 2006) and then again in 2011 (UNESCO Institute for Statistics, 2012). With each version, the number and definition of main levels of education, which build its first digit, have changed. While ISCED 1978 and 1997 had seven levels each (albeit differently defined), ISCED 2011 has nine. These are shown in Table 1.
Table 1: ISCED 1978, 1997 and 2011 main levels

From ISCED 1997 onwards, sub-dimensions distinguishing educational programmes and qualifications within the main levels have been introduced. While programme destination or access to higher-level programmes can be regarded as operationalising the quality of education, programme orientation (general vs. vocational) can be regarded as operationalising the content of education.
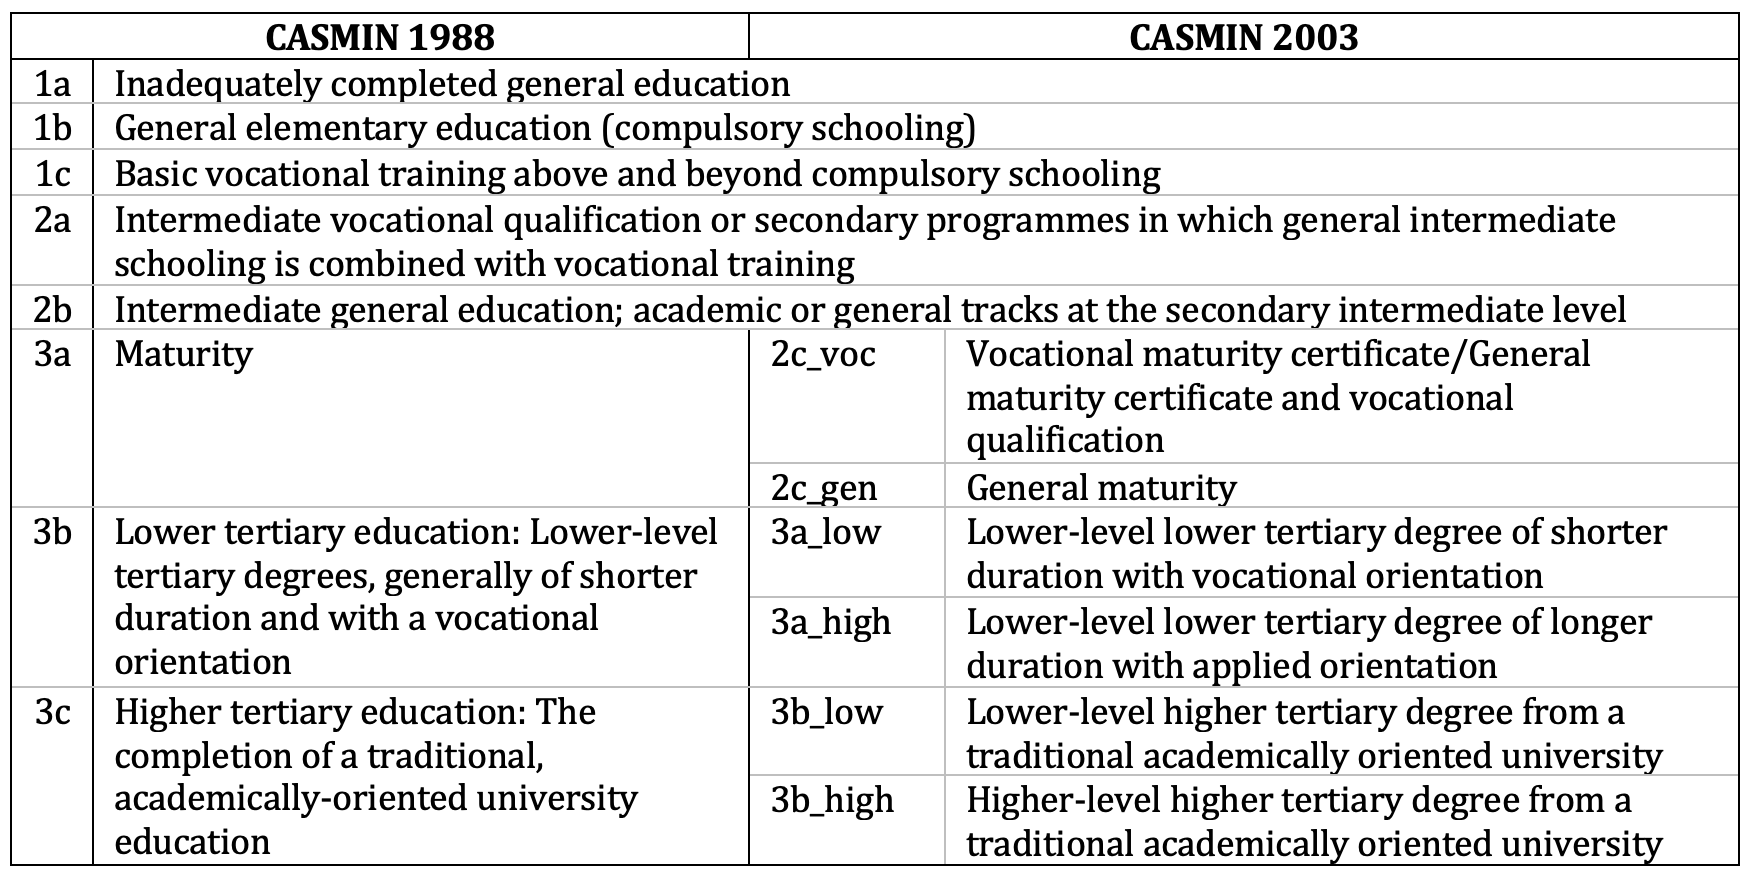
The second established comparative education classification was developed by sociologists aiming to compare social stratification and mobility processes across countries in the project “Comparative Analysis of Social Mobility in Industrial Nations” (König et al., 1988). It became well-known as the CASMIN education scheme and is still used for the ex-post harmonisation of education in comparative social stratification research (Breen, 2004, 2019; Shavit & Müller, 1998). It was updated in 2003 (Brauns et al., 2003), and both versions are presented in Table 2.
Table 2: CASMIN 1988 and 2003
2.3 Previous research and expectations
Several studies have compared different comparative education measures derived from the classifications presented in the previous section with country-specific measures in terms of their concurrent validity across countries and, thus, their comparability. They follow the rationale described by Kerckhoff et al. (2002): “… the best way to determine the adequacy of a standard measure is to compare the results of analyses using that scheme to those from analyses using the indigenous measures of educational attainment. The indigenous credentials constitute each society’s definition of educational attainment. For a standard set of categories to be applicable in comparative research, it should produce results that closely parallel those produced using the indigenous credentials” (p. 116). Their findings inform the measures we will test as well as our expectations.
In the first quantitative evaluation of comparative education variables, Braun and Müller (1997) validated four different education variables using seven theoretically selected validation variables and data from four countries. They found that the choice of education variable impacts the level of association, with a simple three-category measure yielding lower correlations than CASMIN (König et al., 1988) in all countries except the USA. Moreover, “the relative merits of the different measurements of education … clearly vary according to country” (p. 193).
Kerckhoff and Dylan (1999) subsequently developed the ‘heterogeneity hypothesis’, which states that large education categories likely include people with varying amounts and types of education, which will likely attenuate the association between educational attainment and other variables. They explored this hypothesis using data from the “International Adult Literacy Survey” (IALS) using ISCED 1978 for the UK and the USA, with occupational prestige and cognitive skills as validation variables. They found that not only does the amount of aggregation of education matter, but also how categories are aggregated. To more deeply study this phenomenon, Kerckhoff et al. (2002) compared ISCED 1978 levels and CASMIN for the USA, the UK, and the Netherlands, again using IALS data and occupational prestige and socioeconomic status (ISEI) scores (Ganzeboom & Treiman, 1996) as validation variables. They found that while both CASMIN and ISCED underestimated education associations, CASMIN worked better for the Netherlands and the UK, and ISCED worked better for the US. Once lower and higher university degrees were distinguished, anticipating the 2003 revision, CASMIN worked well in the US, too.
So far results were limited to a small number of countries, which was dissatisfactory given the increase in the availability of comparative survey data. Schneider (2009, 2010), using the same general approach, therefore analysed the performance of ISCED 1997 main levels (with ISCED 5 and 6 aggregated) and CASMIN 2003 for many European countries using ESS round 1-4 data with ISEI scores as validation variable. Results supported previous research indicating that purely quantity-based measures of education have low concurrent validity and comparability. CASMIN 2003 performed substantially better. Therefore, ES-ISCED (see section 3.2) was developed (Schneider, 2009, 2010), which incorporates the quality of education somewhat like CASMIN in a scheme derived from detailed ISCED codes. This new scheme performed much better than ISCED 1997 levels while having the same number of categories.
Fifteen years later, substantially more data is available to compare a wider set of comparative education variables, thanks to the ESS switching to a detailed coding scheme in 2009. Computational advancements have also made it easier to use not just a handful but many validation variables to better allow generalising results. Based on prior research, we expect that generally, more detailed variables better represent different aspects of education relevant in different countries. However, given prior evidence, we also expect that variables that do not solely rely on the aspect of quantity of education will be better predictors than purely quantity-based measures at a similar level of detail. Which ones specifically provide the best balance of validity, comparability, and parsimony is an empirical question that this study aims to examine.
3. Methods and data
The present study is a direct extension of this line of research, evaluating the concurrent validity and comparability of alternative international education variables by comparing their predictive power in regression models across countries. In contrast to previous research, it evaluates a larger number of alternative international education variables, which are candidates for a standard variable to be used across surveys (see section 3.2), uses data on a much larger number of countries and respondents (see Table A1 in the Appendix), and follows a big-data approach by using not just a handful of validation variables, but almost 400 dependent variables (see section 3.3.1). This latter strategy is motivated by the fact that education is commonly used as a control variable when predicting many different outcomes. Ultimately, a standard international education variable should work well for the largest possible number of potential outcome variables.
3.1 Data
We used ESS data because it includes many suitable validation variables and a highly detailed comparative education variable, which can serve as a benchmark and allows us to derive and test various less detailed candidate education variables. The ESS is a repeated cross-sectional European survey which started in 2001 and now includes 11 rounds. It uses probability-based general population samples. We analysed data from ESS rounds 5 to 10 covering 36 countries (European Social Survey European Research Infrastructure, 2023a, 2023b, 2023c, 2023d, 2023e, 2023f), downloaded using the Datafile Builder (Wizard) at the ESS Data Portal (https://ess.sikt.no/), where also documentation for each round can be found. While questionnaires for ESS rounds 5 to 9 and 11 were administered by interviewers, in ESS round 10, some countries used self-administered questionnaires due to the Covid-19 pandemic, which we controlled for.[i] The initial dataset contained N = 300,913 cases with 2,671 variables. We excluded respondents with missing values on age (agea), gender (gndr), or education (edulvlb) as these variables were (sources of) the predictors in all models estimated. The reduced analysis sample had N = 296,353 cases.
3.2 Candidate comparative education variables
This section presents the alternative international education variables included in the validation, which capture the different dimensions of education to varying degrees, and thus – implicitly at least – differ in their underlying conceptualisation of educational attainment. These candidates for a standard international education variable were derived from and are compared to the most detailed education variable in the ESS, edulvlb. The latter is used as the benchmark here because, firstly, it is the most detailed variable which most comprehensively covers the various subdimensions of education, and secondly, it has been shown to work almost as well as national education variables (Schröder, 2014, chapter 3).
edulvlb was introduced in ESS round 5 after research showed that the simple harmonised education variable employed in earlier ESS rounds, edulvl, led to differential losses of concurrent validity across countries and, thus, low comparability (see section 2.3). This variable has 27 categories and uses a three-digit coding scheme. This apparently ‘excessive’ level of detail was chosen because, at the time, it was not entirely clear which amount and kind of detail was needed to achieve validity and comparability. edulvlb closely builds on ISCED 2011, which is therefore briefly described here first (for details, see e.g. Schneider, 2013; UNESCO Institute for Statistics, 2012).
At the first digit, ISCED 2011 distinguishes nine main levels of education (ranging from 0 = less than primary to 8 = doctoral level education, see Table 1), reflecting the quantity of education. At the second digit, for levels 2 (lower secondary education) to 5 (short-cycle tertiary education), ISCED indicates whether a programme is vocationally oriented (i.e., prepares for a specific occupation or group of occupations) or not. At levels 6 (bachelor’s level) and 7 (master’s level), the second digit foresees a distinction between professional and academic tertiary education, which has, however, not yet been implemented. It represents the content of education in a minimalistic way. The third digit has somewhat different meanings across levels but primarily distinguishes whether an educational qualification gives access to a specific higher level of education. It thus reflects the quality aspect of education, again in a rather minimalistic way.
edulvlb corresponds to ISCED 2011 at the first digit but extends ISCED on the remaining digits in two ways: Instead of the operationally unclear distinction of professional and academic higher education at the second digit of ISCED 6 and 7, edulvlb distinguishes between lower-tier/applied and upper-tier/traditional higher education to measure potential content differences between them. The third digit of edulvlb is more fine-grained than ISCED: It proxies the quality of educational programmes by distinguishing which kind of higher-level programs a qualification gives access to. This was done by differentiating between educational programmes preparing for less demanding, often vocationally oriented, and for more demanding, often generally oriented, higher-level programmes at ISCED 2, 3 and 4. For example, in contrast to ISCED, secondary education qualifications giving access to higher education are distinguished from qualifications not giving access to higher education, but vocational tertiary education. Beyond these extensions, the meaning of the categories is the same in ISCED and edulvlb. However, since edulvlb was developed before ISCED 2011 was finalised, the precise codes at the second and third digits differ from official ISCED codes.
Next, we explain how we produced the candidate comparative education variables derived from edulvlb. Table 3 shows an overview of the essential characteristics of these variables and edulvlb. The supplemental materials (ESM 01) contain the codes and labels of all education variables and how they were derived from edulvlb.
Table 3: Overview of candidate comparative education variables

First, we reconstructed ISCED 2011 with all three digits from edulvlb as closely as possible. This variable is named isced123 here.[ii] Second, for testing differently detailed international education variables, edulvlb and isced123 were simplified by dropping one or two of their three digits. This led to edulvlb12 and isced12 (just quantity and content), edulvlb13 and isced13 (just quantity and quality,), and isced1 (just quantity). Further simplifications additionally reduce information on quantity and consist in the merging of ISCED 0 and 1 as well as 5 to 8, resulting in the variable edulvla, which is available for ESS rounds 1 to 4 as well. ISCED 1997 was constructed by merging levels 5 to 7 of ISCED 2011 (variable isced97). An extreme reduction also of the quantity aspect results in broad ISCED levels (variable iscedb), only distinguishing ‘low’ (ISCED 0 to 2), ‘medium’ (ISCED 3 and 4) and ‘high’ (ISCED 5 to 8) education.
Third, we checked how various official European surveys implemented ISCED and derived these variables from isced123 as closely as possible. The European Labour Force Survey (EU-LFS) uses a fairly detailed scheme with 23 categories (GESIS-GML, 2023).[iii] Ten of these categories are not needed when deriving it from edulvlb because the EU-LFS has specific codes for data that do not allow a distinction to be made at the second or third ISCED digit, as well as the ‘partial-completion’-codes mentioned in endnote ii (both situations are rare in the EU-LFS, see German Microdata Lab, 2025). The variable eulfs with 13 categories partly reflects content and quality, but not at all relevant ISCED levels. The European Union Survey on Income and Living Conditions (EU-SILC) uses the same scheme as the EU-LFS except that all tertiary education is aggregated into one code (GESIS-GML, 2024), thus substantially reducing the quantity dimension and resulting in nine categories (variable eusilc). The Adult Education Survey (AES) also uses nine categories, but here only the doctoral level is aggregated with the master’s level, while short-cycle tertiary and bachelor’s levels are kept separate. In contrast, ISCED 3 and 4 are not differentiated according to content, and quality is only reflected at ISCED 3 (Eurostat, 2017). This variable is called aes. Finally, the Structures of Earnings Survey (SES, Eurostat, n.d.) uses the six levels based on ISCED 1997, merging several adjacent levels but keeping what became level 5 in ISCED 2011 separate (variable ses).
Edulvlb is not the only education variable offered in the ESS dataset: The data also include the European Survey version of ISCED (ES-ISCED, variable eisced in the ESS) constructed by Schneider (2009, 2010) to more optimally summarise detailed ISCED categories than ISCED 1997 main levels, which performed poorly in validation analyses (see section 2.3). It aggregates ISCED 0 and 1, 4 and 5, and 7 and 8, and distinguishes within ISCED 3 between qualifications giving access to higher education and qualifications not giving access, reflecting the quality of education.
Finally, the CASMIN scheme with eleven categories (Brauns et al., 2003) was included. Since it is conceptually unrelated to ISCED and follows a different classification logic, the casmin variable was challenging to construct and does not as closely reflect CASMIN as if coded directly from national education variables. For CASMIN, like ISCED, a highly aggregated version with just three categories was also constructed.
3.3 Statistical Analyses
We ran all analyses with R (4.3.1; R Core Team, 2020). The code, including all packages used, is available in ESM 02–07. We estimated survey-weighted generalised linear models (SWGLM) utilising the package survey (4.2-1; Lumley, 2023). These models allow for a clustered data structure and weights. We took a composite of country (cntry) and language (intlnga) as cluster variable, resulting in 50 clusters. Furthermore, we used the design weight (dweight). We accounted for the scale level of the validation variables by estimating standard linear regression for interval scale level variables, Poisson regression for count variables, and logistic regression for binary variables.
3.3.1 Selection of validation variables
As a first step, we selected appropriate dependent variables for our validation analyses following a mostly data-driven approach. We excluded variables related to the respondents’ parents or partner and categorical variables (such as marital status or religious denomination) because estimated pseudo R2 of multinomial regressions are not really comparable to (pseudo) R2 of standard or binary logistic regression (Hemmert et al., 2018). After this exclusion, 1,416 variables remained as potential dependent variables. In a second step, we applied SWGLM using edulvlb (coded as dummy variables), age, gender, and ESS round (dummy coded) as predictors and the other 1,416 variables as dependent variables. We extracted the partial adjusted R2 (paR2) for education from these 1,416 models using the package rsq (2.5; Zhang, 2022). The adjustment takes care of the fact that more detailed measures are, per se, expected to be more predictive. The extracted paR2 ranged from 0 to 0.378. To ensure that only variables for which education has some empirical relevance remained in the analysis, we only kept variables for which education explained at least 1% of the variance (small effect size according to Cohen, 1988; Gignac & Szodorai, 2016), i.e. paR2 .01). This step led to the selection of 394 dependent variables covering a broad range of topics such as income, values and attitudes. The list of all variables, including the respective paR2s and case numbers, is available as ESM 08, while ESM 09 contains only the selected validation variables.
3.3.2 Validity indicator
The validity indicator tells us how much explanatory power is maintained when using an alternative international education variable rather than edulvlb as a predictor in a regression model (e.g., Kerckhoff et al., 2002; Schneider, 2010). This also informs us about which theoretical aspects of education empirically carry predictive power. The more explanatory power is retained, the lower the risk of biased estimates of the coefficients of education and other variables of interest.
We computed SWGLMs with all 17 education variables (see section 2.2) as predictors (again coded as dummy variables) in addition to age, gender, and ESS round (dummy coded) and the 394 selected validation variables as dependent variables (i.e., 17 models for each of the 394 validation variables) to derive our concurrent validity indicator. We again extracted the paR2 for each model. We then estimated the relative partial adjusted R2 (rpaR2), obtained by dividing the paR2 of each alternative education variable by the paR2 of edulvlb, the benchmark education variable. We summarise the results across the 394 validation variables for each of the 16 alternative education variables by calculating descriptive statistics of the rpaR2s across models, presented in tables, boxplots, and density plots.
3.3.3 Comparability indicators
The comparability indicators tell us how much the loss of predictive power varies across country-language clusters (Schneider, 2009, 2010). High variation implies that an alternative education variable retains a high explanatory power in some countries but loses much of its explanatory power in others. Consequently, the aforementioned bias in the coefficients of education and other variables of interest varies more strongly across countries. Thus, estimated coefficients are not easily comparable across countries.
We separately estimated the rpaR2s for the 394 validation variables for each country-language cluster to compute comparability indicators. As this greatly increased the number of models to be computed, we performed this analysis on just ten out of the 16 alternative education variables that were of the highest interest (e.g. because they are commonly used, like isced1, iscedb, casmin, eulfs, aes, eusilc, eisced, edulvla) and/or showed a high level of validity (edulvlb13, isced123, eulfs, casmin). In the next step, we estimated the standard deviations (SD) of the country-language-specific rpaR2 for each combination of education and validation variables. We also computed the interquartile range (IQR) as an alternative comparability indicator less affected by outliers. To illustrate these comparability indicators, we start by reporting them for the variable most highly associated with education (social status – ISEI), which has also been used in previous validation analyses (Braun & Müller, 1997; Kerckhoff et al., 2002; Schneider, 2010). Then, we aggregate the comparability indicators across our 394 validation variables. We provide descriptive statistics in a table and visualise the results in boxplots.
4. Results
In this section, we first present results regarding the validity analyses (section 4.1), followed by results from the analyses of the comparability of the candidate education measures (section 4.2).
4.1 Validity analyses
Table 4 presents descriptive statistics, while Figure 1 displays boxplots of the validity indicator (rpaR2) for each alternative education variable.
Table 4: Descriptive statistics of rpaR2 across validation variables for all education variables
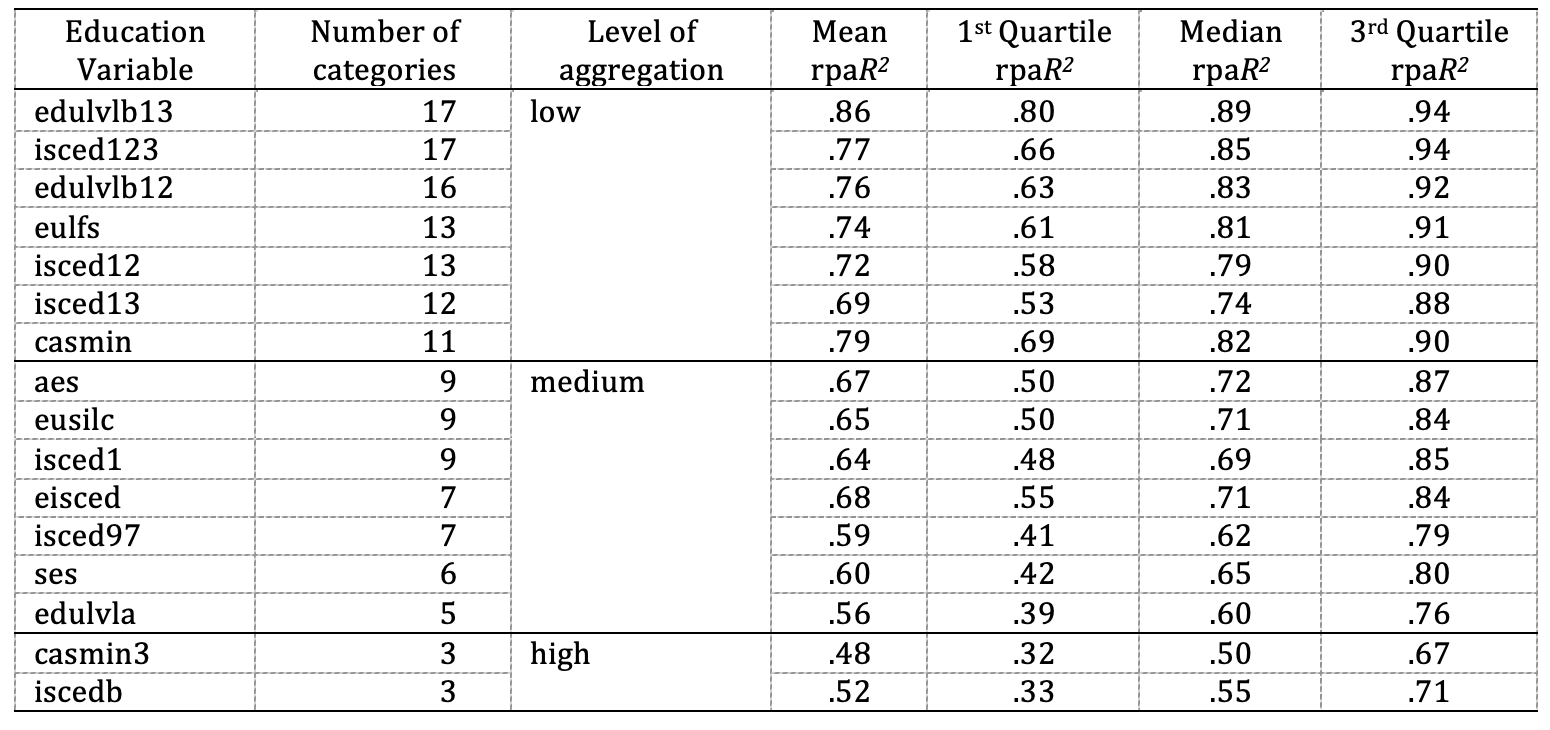
Figure 1: Boxplot of rpaR2 across validation variables for all education variables

Note. The vertical grey line represents a benchmark of .80 retained predictive power compared to edulvlb.
Based on the median across all 394 validation variables, we found the highest validity for edulvlb13 with 89% rpaR2, followed by isced123 with 85%. edulvlb12, eulfs and casmin follow closely with 81-83%. All other education variables lose over 20% of the original explanatory power. The ordering is the same based on the mean, except that the distance between edulvlb13 and the other variables is larger, and casmin rather than isced123 comes second. Amongst the education variables with a medium degree of aggregation (five to nine categories), aes, eusilc and eisced fare best, closely followed by the commonly used isced1 (all with nine categories except eisced with seven). The highly aggregated education variables (casmin3, iscedb) retain, on average, only about half the explanatory power across validation variables.
Looking at the first quartile of the distribution, for 75% of the 394 selected variables, edulvlb13 retains 80% or more of the explanatory power of edulvlb. casmin and isced123 follow at some distance: For 75% of the variables, they retain only about 69% or more (casmin) and 66% or more (isced123) of the explanatory power of edulvlb. Therefore, the additional distinctions in the quality dimension of edulvlb13 more than compensate for dropping the content dimension entirely – likely because the additional distinctions are closely related to content (i.e., vocational programmes more often do not give access to higher education, which isced123 does not identify, but casmin does). It is noteworthy that casmin has just eleven categories, whereas edulvlb13 and isced123 have 17 categories each. What edulvl13 and casmin have in common, and may explain why casmin performs comparatively well, especially for the first quartile, is that both distinguish secondary education qualifications giving access to higher education, which are typically academically selective. In contrast to that, isced123 and its derivations only distinguish whether a secondary education qualification gives access to tertiary education (which, in addition to higher education, includes advanced vocational and technical education outside the higher education sector), which is less selective. Amongst the education variables with five to nine categories, eisced shows the smallest losses of explanatory power for 75% of the validation variables, retaining 55% or more of the original explanatory power. Like edulvlb13 and casmin, it includes the distinction of programmes giving access to higher education, and not just tertiary education, like isced13, eulfs, eusilc and aes. The two education variables with just three categories both retain only about a third or more of the original explanatory power for 75% of the validation variables.
The summary statistics and the plots broadly show that, as expected, the lower the number of categories of an education variable, and thus the more different aspects of education are simplified, the greater the loss of explanatory power. However, alternative education variables with the same or similar number of categories do not always perform similarly. For example, among the seven-category variables, eisced, which simplifies the aspect of the quantity of education but keeps the quality distinction of access to higher education, performs substantially better than isced97, which focuses solely on quantity. Likewise, the 11-category casmin, which includes both quality and content but disregards some quantity distinctions, performs even substantially better than the 12-category isced13, which is detailed as regards quantity, omits content and, regarding quality, cannot identify access to higher education. In conclusion, some non-quantity-related distinctions appear more relevant than some quantity-based distinctions. Given edulvlb13 omits content, quality, at least when distinguishing access to higher education, appears as the key subdimension.
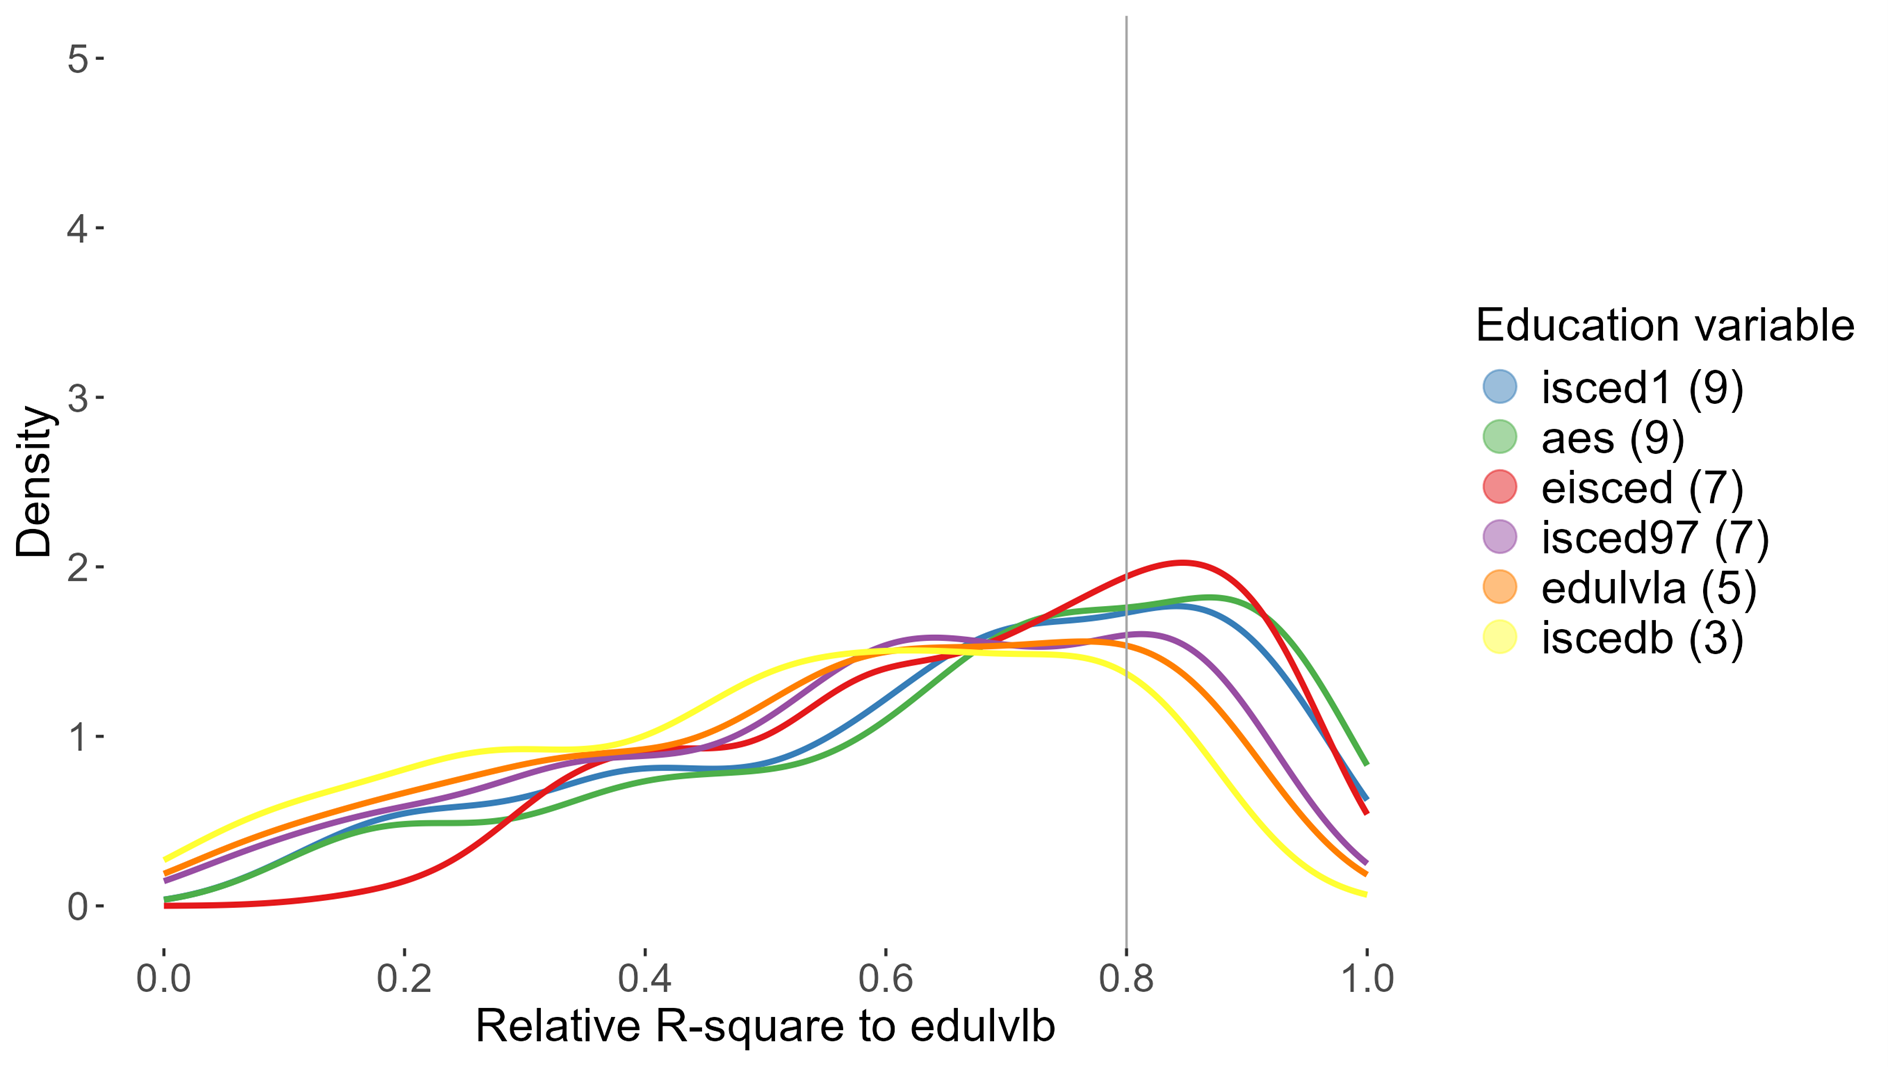
Figures 2 and 3 show the entire distribution of the rpaR2 across the 394 variables for five out of the seven detailed and six out of the nine medium and most aggregated education variables, respectively, focusing on the variables that either performed best in their group or are commonly used (Figure A1 in the appendix shows density plots for the remaining education variables). The density plots align with the results reported above: edulvlb13 retains the highest explanatory power for most validation variables, while the other education variables lose substantial explanatory power for a sizeable number of variables. While casmin and edulvlb13 maintain over 40% for all validation variables, all other education variables lose over 60% explanatory power for some validation variables. Amongst the medium and highly aggregated variables, aes and eisced, which both incorporate some quality distinctions, perform better than, e.g., isced1 or isced97, which are solely based on quantity. Both are still quite far away from the performance of the detailed education variables, though.
Figure 2: Density of rpaR2 across all validation variables for detailed education variables
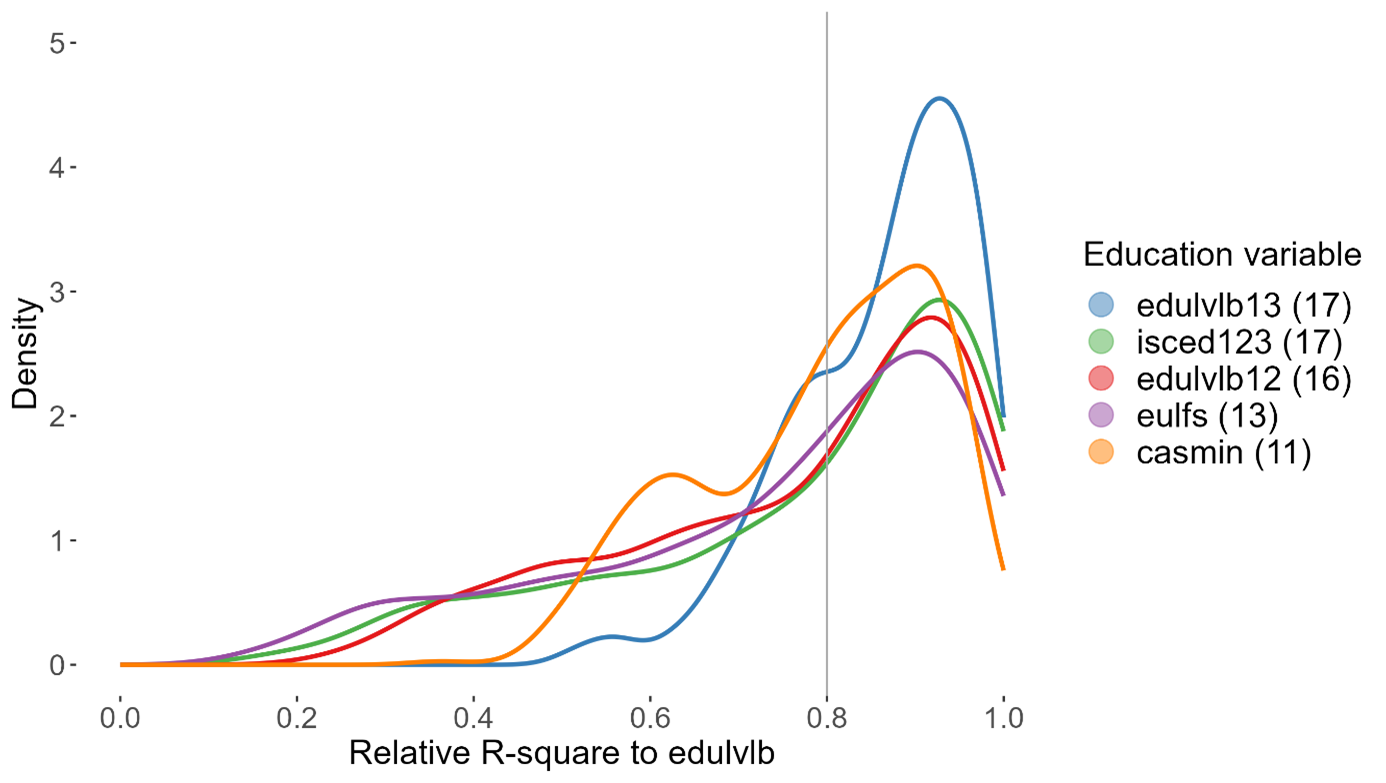
Figure 3: Density of rpaR2 across all validation variables for medium and least detailed education variables
4.2 Comparability analyses
To evaluate comparability across the 36 countries, we first estimated the rpaR2 for each of the 50 country-language clusters separately. After that, we used two measures of variation in the loss of explanatory power across country-language clusters as comparability indicators: The SD of the rpaR2 across country-language clusters, and the respective IQR. We report the rpaR2 for each country-language cluster and all combinations of education and validation variables from which the SDs and IQRs were calculated in ESM 11.
To illustrate cross-country variation in concurrent validity, Figure 4 shows the country-language-cluster specific rpaR2 for social status (ISEI). The results firstly support our expectations resulting from previous research that edulvla and iscedb, which strongly simplify the quantity aspect of education and drop information on all other aspects, show a high degree of variation in concurrent validity across countries, compared to the most detailed measure available. Furthermore, eisced, which also simplifies the quantity aspect but keeps the most crucial quality distinction (access to higher education), performs very well (e.g., SDiscedb = 0.10; SDedulva = 0.10; SDeisced = 0.02). These results secondly extend our knowledge by adding evidence for education variables that have not been assessed in the past: for predicting social status, edulvlb13 and isced123 work very well, as does eulfs, and to a lesser extent, casmin (the latter three except for the Russian-speaking subsample in Israel). In contrast, eusilc works no better than just three categories (iscedb), so the summary of all tertiary education in one large category appears to be particularly problematic as regards the prediction of social status. Other variables with fewer than ten categories, especially aes, which distinguishes three levels within tertiary education, perform substantially better. isced1 performs better than all more highly aggregated schemes except eisced (and is a clear improvement compared to edulvla), but worse than aes, so again, a focus on quantity alone is not justified. In terms of country differences, lower validities occurred especially for some variables for Russian in Israel (blue), Russia (green), and Russian in Latvia (purple).
Figure 4: rpaR2 for social status (ISEI scores) by country-language cluster and education variables
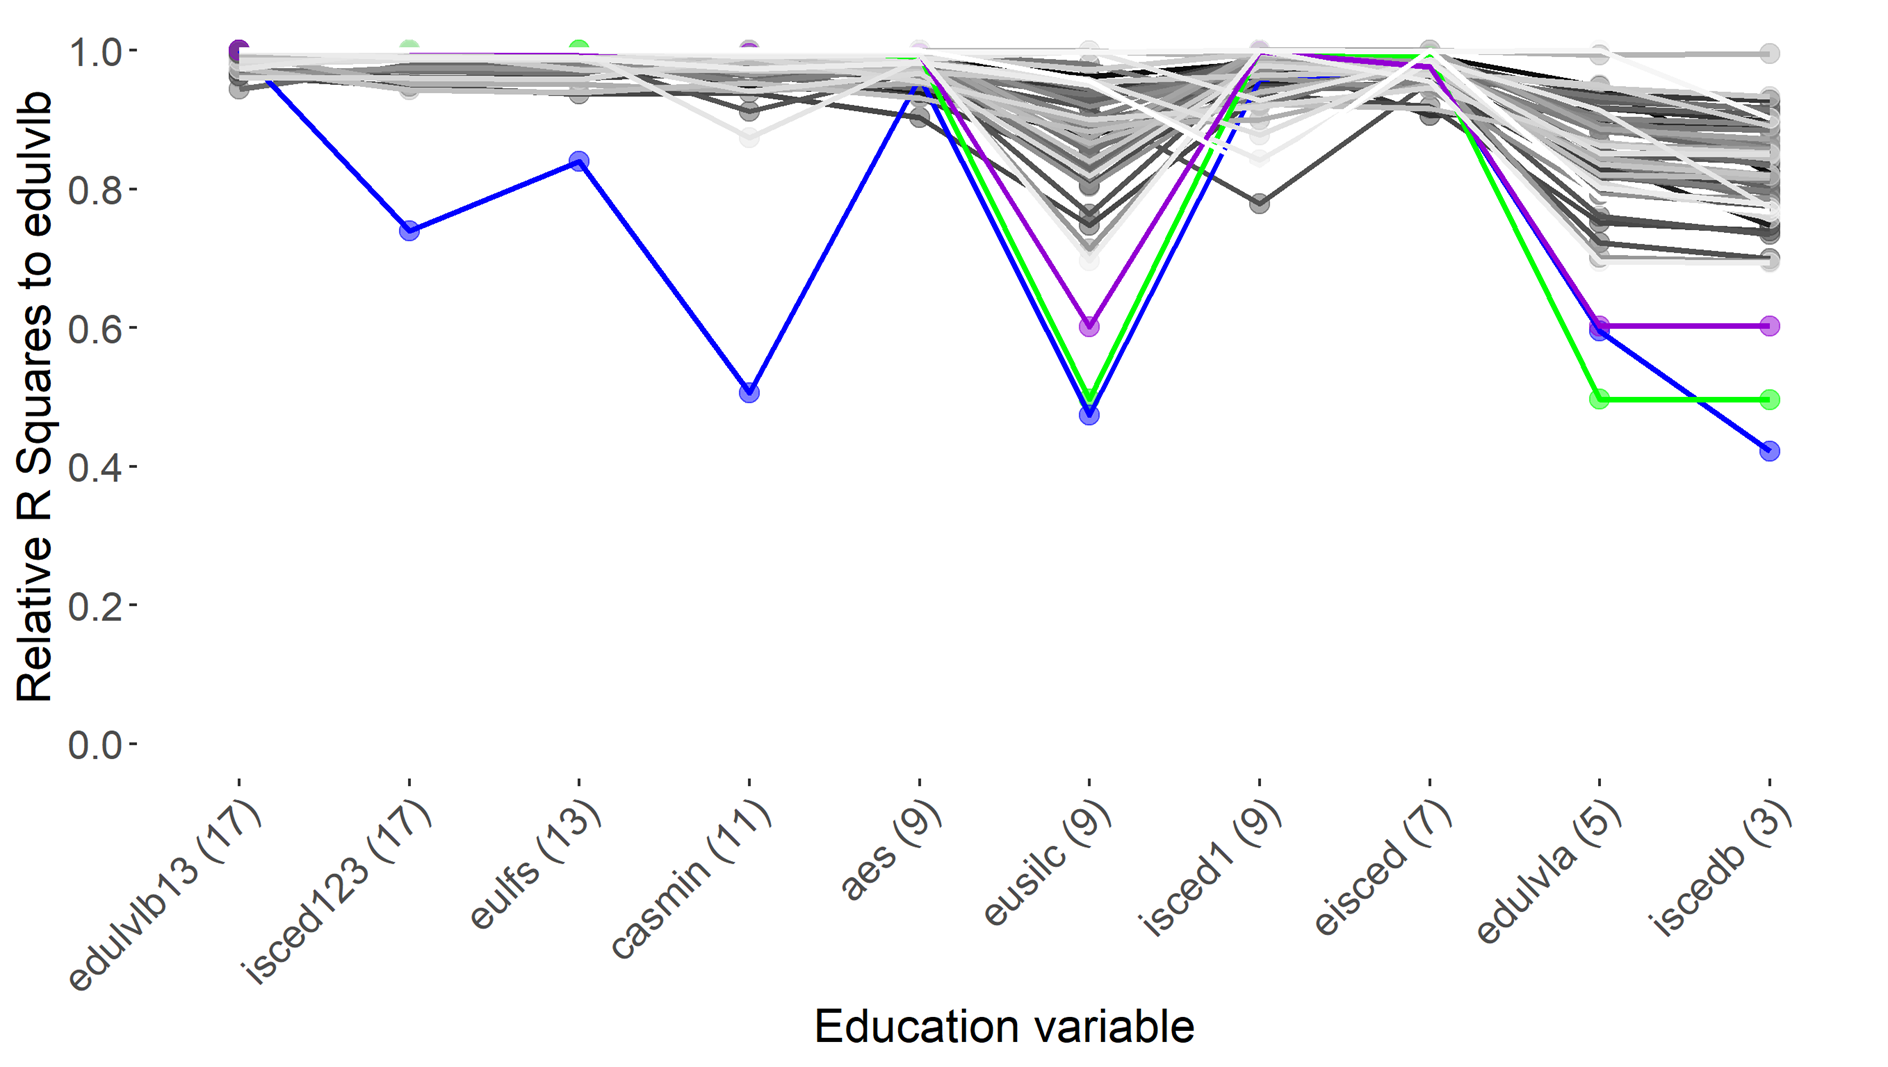
Note. Each line represents one country-language cluster. Outliers: Blue – Russian in IL; Purple – Russian in Latvia; Green – Russia.
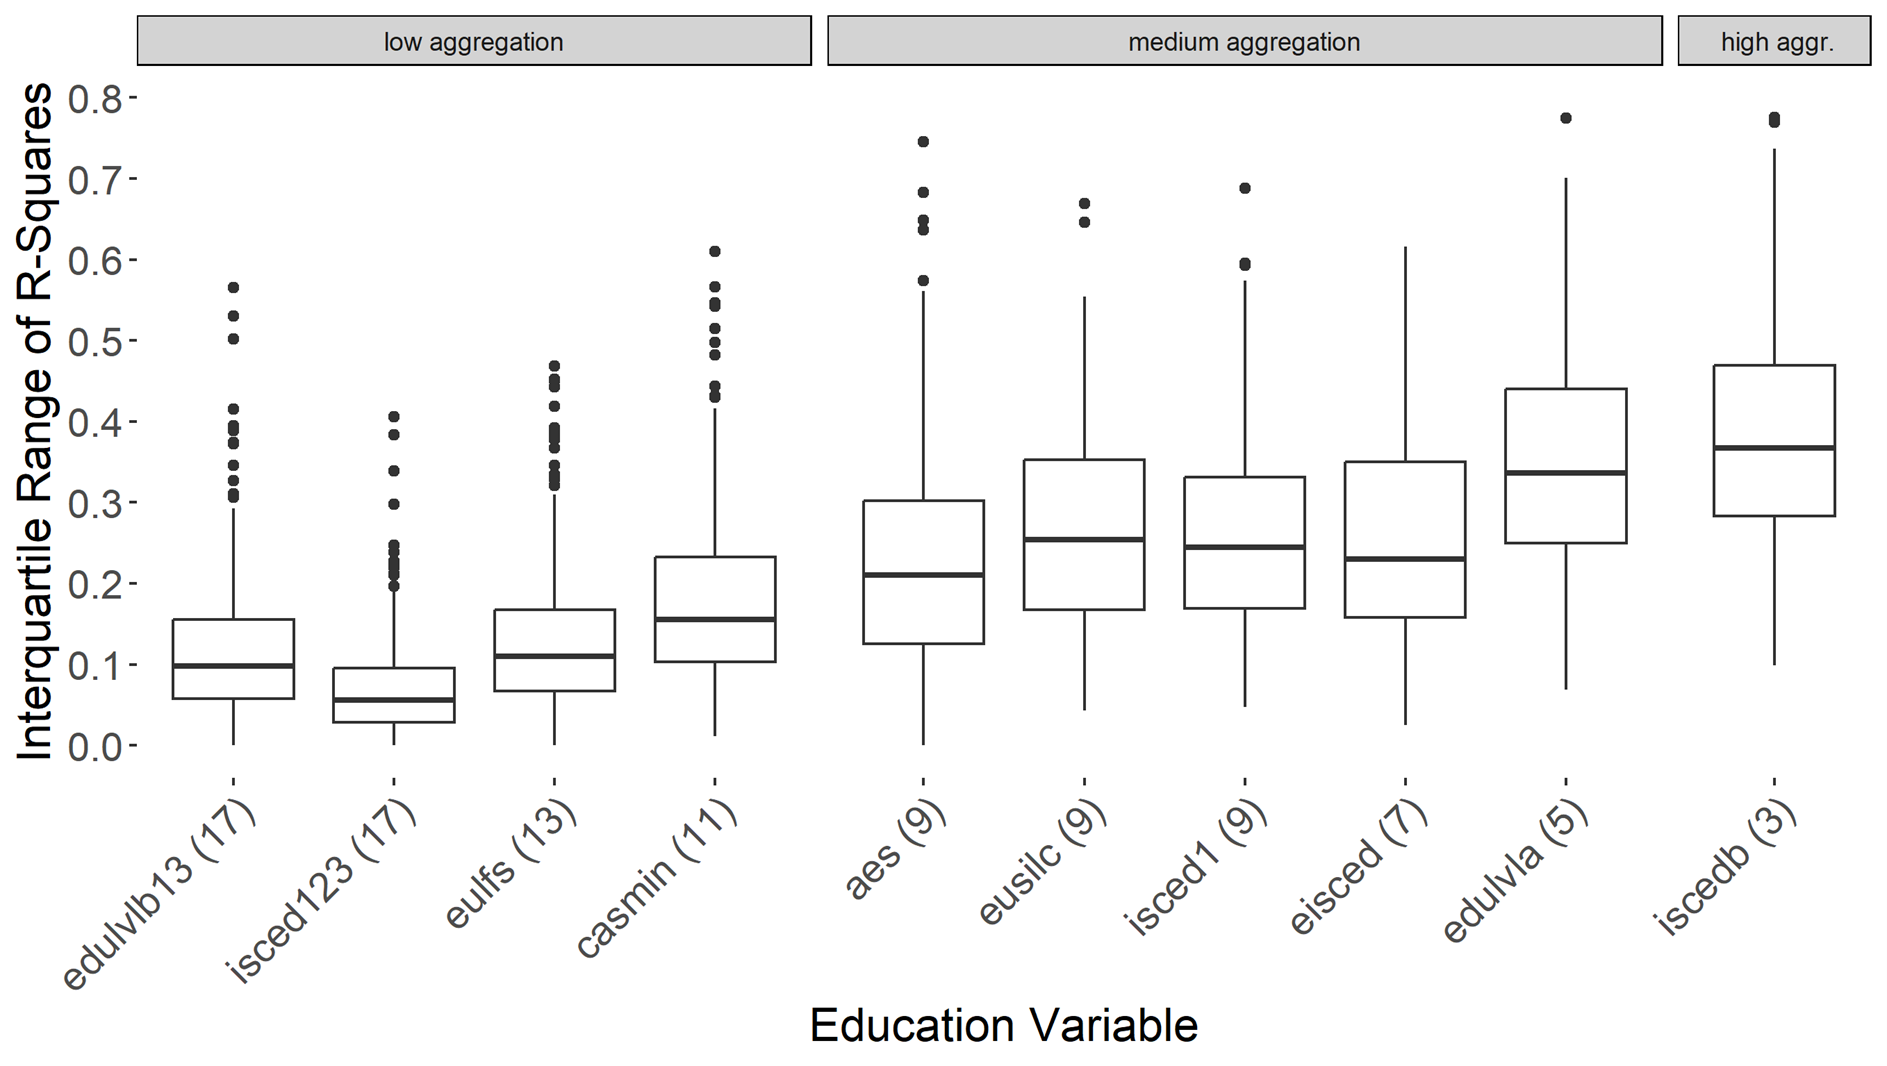
What do the results look like when aggregating over a large number of validation variables, rather than just looking at social status (ISEI)? Table 5 shows the descriptive statistics of the comparability indicators. Figure 5 graphically presents the results for the SDs, while the respective results (which are highly similar) for the IQRs are displayed in the Appendix (Figure A2).
Table 5: Descriptive statistics of rpaR2 variation across country-language clusters and validation variables for ten education variables

Figure 5: Boxplot of rpaR2 variation (SD) across countries and validation variables for ten education variables
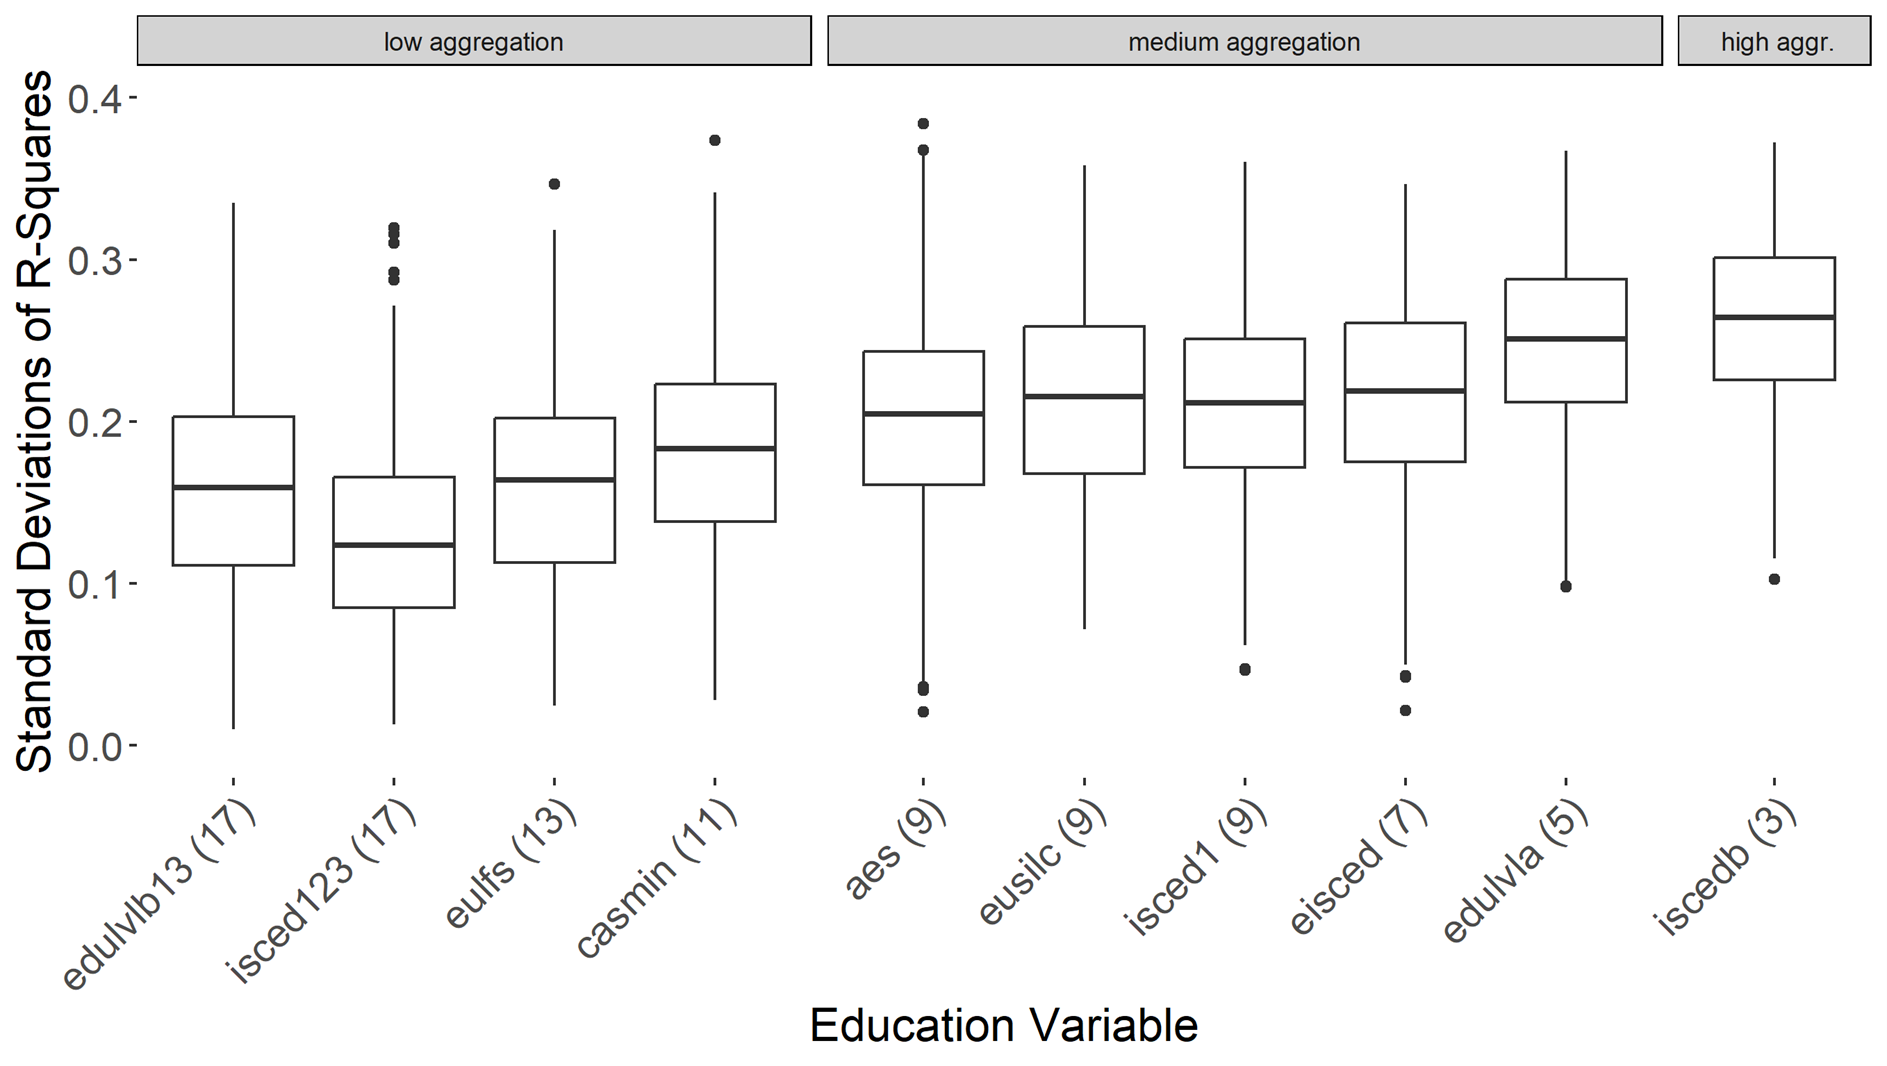
In contrast to the concurrent validity analyses, where edulvlb13 clearly outperformed the other education variables, we found the highest comparability for isced123. Table 5 shows that isced123 has the lowest median SD and IQR across countries and validation variables. Moreover, isced123 also performs best when considering both comparability statistics’ first and third quartiles. For comparability, distinguishing (general vs. vocational) content appears to be more important than a fine-grained quality distinction. Amongst the education variables with a medium degree of aggregation, aes fares best on all indicators, followed by isced1 when looking at the SD and eisced when looking at the IQR. The aes variable, therefore, appears to use a good balance of simplification in the quantity dimension (just merging Master’s and PhD levels, but not the very low education levels like eisced) and in the quality dimension (separating vocational programmes not giving access to tertiary education from all other programmes). The differences between these variables in terms of their comparability are not large, except for edulvla, which performs clearly worst in this set. The most aggregated ISCED variable, iscedb, as expected, shows the lowest comparability.
As with our concurrent validity results, we found that comparability broadly decreased with a decreasing number of categories in the alternative education variables. In general, education variables with lower average concurrent validity also show a lower degree of comparability, i.e., their concurrent validity varies more between countries. However, the variables with the highest comparability are not the same as the ones with the highest validity. While casmin fared rather well in terms of validity given the number of categories, its comparability is no better than what the number of categories suggests.
5. Discussion and conclusions
The aim of this study was to evaluate the concurrent validity and comparability of a wide range of international education variables across a large number of possible dependent (validation) variables using a ‘big data approach’ for many countries, to recommend a potential standard variable for use across comparative surveys. We investigated concurrent validity by comparing the explanatory power (measured as paR2) of 16 alternative education variables to the explanatory power of the highly detailed education variable in the ESS, edulvlb. Low concurrent validity may lead to biased estimates for both associations between education and the dependent variable and the respective associations of third variables when controlling for education. For comparability, we estimated the variability across countries in this loss of explanatory power. Lower variability in concurrent validity implies higher comparability, so associations with education, as well as third variables, when controlling for education, can be better compared across countries.
We found that every simplification of the most detailed education variable led to a substantial loss of explanatory power across the 394 validation variables – a finding consistent with previous research using fewer countries, education variables, and validation variables (Braun & Müller, 1997; Kerckhoff & Dylan, 1999; Schneider, 2010). This loss was greater for the more strongly simplified education variables. However, at the same level of detail, different education variables also performed differently, consistent with results from previous research (e.g., Kerckhoff & Dylan, 1999). Therefore, the way education categories are aggregated can make a (sometimes substantial) difference. For example, the results for one-digit ISCED 2011 (isced1) show that simplifications focusing entirely on the quantity of education are ill-advised. Among the detailed variables, edulvlb13 showed the best concurrent validity, followed by isced123. For a number of validation variables, isced123, however, works substantially less well than edulvlb13 or even casmin. casmin also fares pretty well, especially in light of the fact that it has fewer categories than any other detailed variable, and is the only detailed variable aggregating levels of education on the quantity dimension. With regard to comparability, isced123 clearly outperformed the other education variables, followed by edulvlb13, eulfs and casmin. Among the variables with a medium level of detail, eisced fares best in terms of concurrent validity and aes in terms of comparability, followed by eisced.
Regarding the choice between these alternative education variables, we are thus caught between a rock and a hard place: Compared to edulvlb13, isced123 will potentially lead to more strongly biased estimates for a larger number of dependent variables; these biases will, however, be more similar across countries than the fewer and weaker biases produced when using edulvlb13. Neither edulvlb13 nor isced123 comes close to the benchmark variable, edulvlb, even though they are quite detailed with 17 categories. As Kerckhoff and Dylan (1999) already concluded, “no standard set of categories can adequately represent all of the important distinctions in educational credentials that are made in Western industrial countries unless it has more categories than are used in the ISCED and CASMIN systems” (with seven and eight categories respectively at the time). Quite clearly, it was worth expanding both ISCED (with the ISCED 2011 revision and its extension in edulvlb) and CASMIN (with the extension in 2003) to allow more details to be reflected within education levels. As our results show, edulvlb is an unbeaten standard.
In conclusion, it is worth collecting and coding detailed educational attainment data in cross-national face-to-face surveys with show cards, going beyond isced123 as edulvlb does, and being able to derive alternative schemes such as casmin. For cross-national self-administered surveys that need to simplify measurement instruments as much as possible, three-digit isced123 is recommended as the standard variable based on its higher comparability when compared to the alternatives of similarly reduced complexity. By adding features of CASMIN that are likely responsible for its good performance for dependent variables where all variables based on ISCED fail, namely distinguishing whether or not a secondary education qualification provides access to higher education, and distinguishing higher education from other tertiary education, it may also become as valid as casmin or edulvlb13.
These recommendations are not without limitations. Firstly, it could be argued that the big data approach is not suitable, and validation analyses should instead be performed on variables that are strongly related to education. We thus additionally report results for the 35 validation variables that are most highly correlated with education in ESM 10, which shows that our results are robust to the wide or narrow selection of validation variables. Secondly, our recommendations are based on aggregations across multiple countries and various validation variables. Therefore, they may not generalise to each individual country and research area. For national surveys that do not aim for ex-post harmonisation with international survey data or surveys with a specific substantive focus, we, therefore, encourage researchers to use our detailed results (ESM 9 & ESM 11) to check which candidate education variable is most appropriate for their specific country and research objective. Thirdly, we focus mostly on European countries, and it is unclear whether the results would hold elsewhere in the world, e.g. in the US. Given CASMIN had been shown to work well for the US once higher education was differentiated into BA and higher levels (Kerckhoff et al., 2002), we assume that, given the US system is otherwise less stratified than most European ones, the variables suggested for comparative use here would work for the US context, too. It would be highly relevant for future research, though, to examine the same questions in the context of developing countries, where low levels of education likely will be of higher importance than in most of Europe.
Our results also permit deriving a strong recommendation for researchers using education in their statistical analyses, especially in comparative research or when using education as a control variable: Given the low concurrent validity and comparability of highly simplified education measures with only three to five categories as well as those focusing on the quantity of education only, such measures should only be used after sensitivity checks show that results (including coefficients of other variables in the model) do not change. That is to say, researchers should not sacrifice validity for parsimony.
6. Appendix
Table A1: Sample size per country and ESS round

Figure A1: Density of rpaR2 for the Remaining Education Variables for 394 Validation Variables
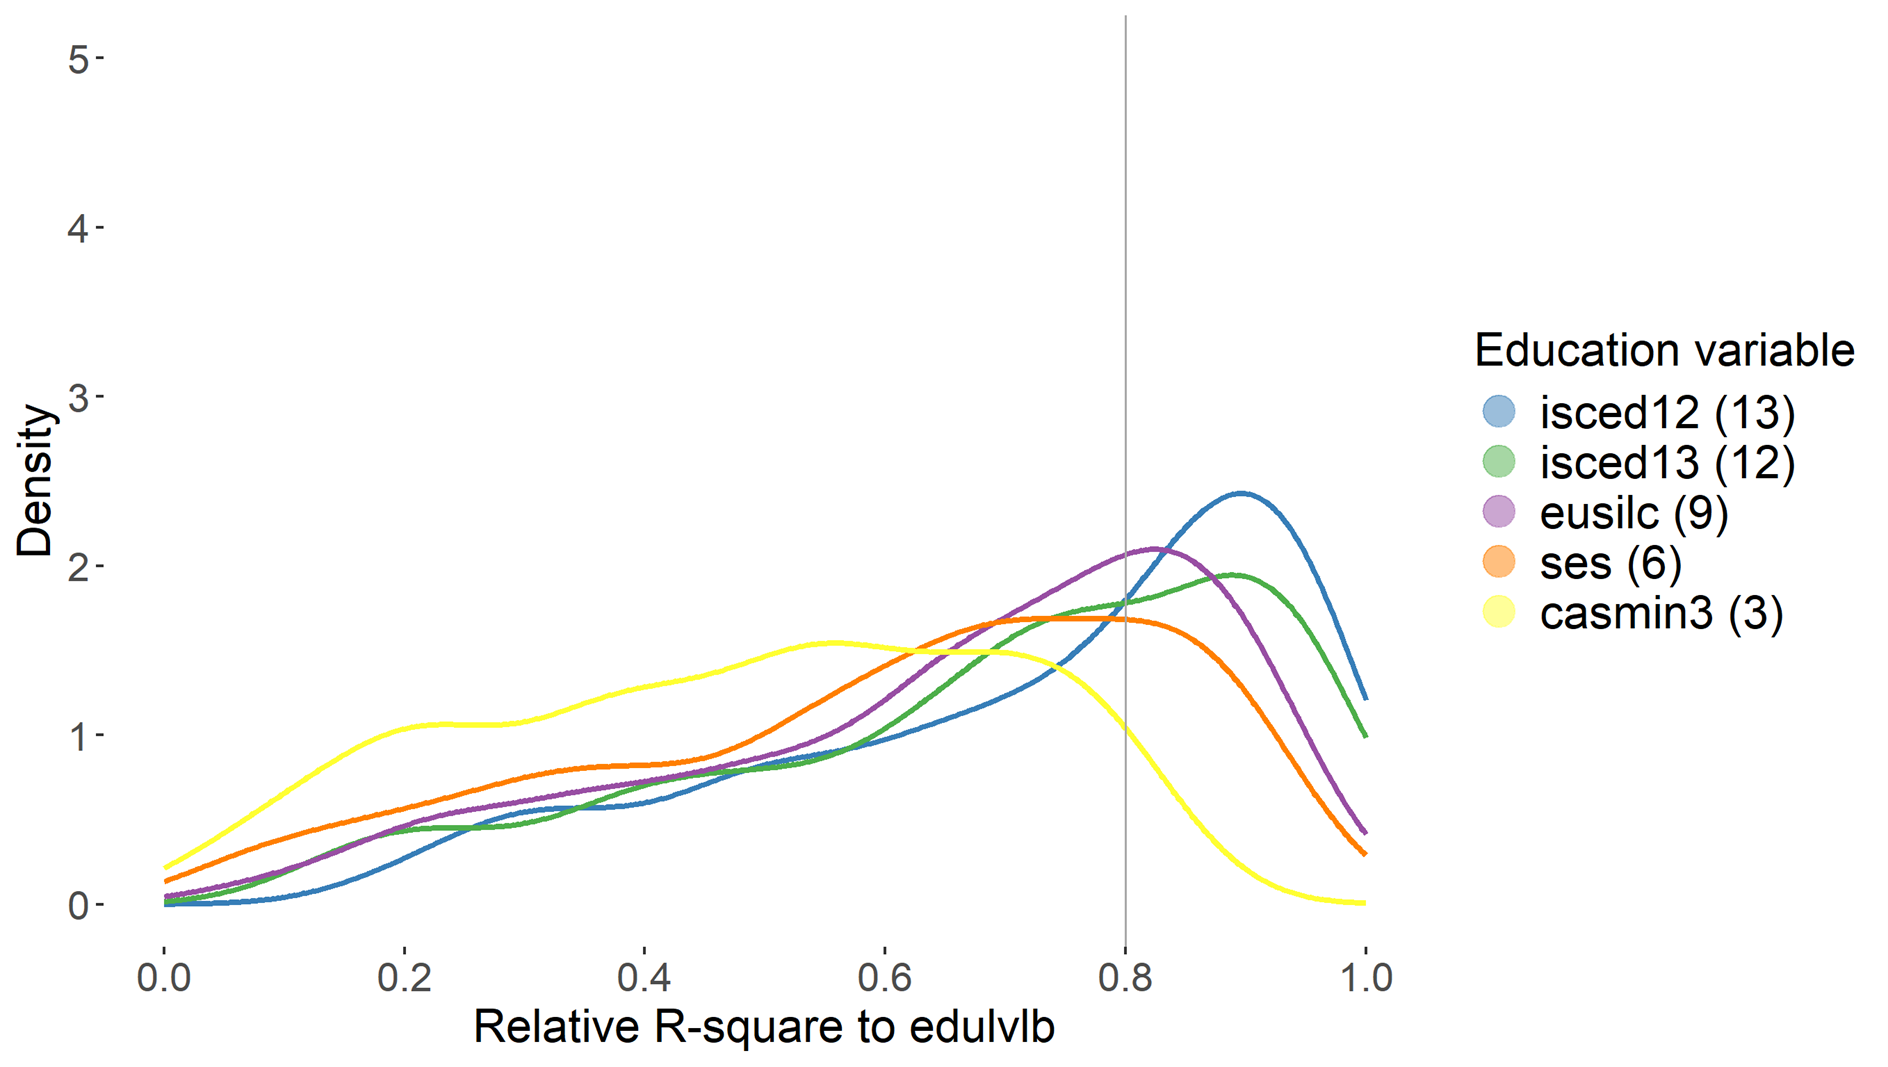
Figure A2: Boxplot of rpaR2 variation (IQR) across countries and validation variables for ten education variables
[i] There is no difference in our outcome between variables that have been collected as administered interviews and variables that have been collected via both survey modes (compare column wave 10 in ESM 9). For ESS round 10 documentation, see ESS Data Archive (2023), for ESS round 10 quality reports, see Ghirelli et al. (2024) and Koch and Briceno-Rosas (2023); further quality reports are available at https://www.europeansocialsurvey.org/methodology/ess-methodology/data-quality-assessment.
[ii] The ESS does not always adhere to the official ISCED mappings because, in some cases, educational qualifications are not actually classified in line with ISCED criteria. Therefore, isced123 and other derived ISCED variables will not be specified in the same way in some countries as in official data adhering to the official ISCED mappings. The categories for ‘partial level completion’ offered by ISCED were, for example, not needed in the ESS, and could, therefore, not be re-constructed for the variable isced123.
[iii] Ten of these categories are not needed when deriving it from edulvlb because the EU-LFS has specific codes for data that do not allow a distinction to be made at the second or third ISCED digit, as well as the ‘partial-completion’-codes mentioned in endnote iii (both situations are rare in the EU-LFS).
References
- Allmendinger, J. (1989). Educational systems and labor market outcomes. European Sociological Review, 5(3), 231–250. https://doi.org/10/czg5
- Aronow, P. M., & Samii, C. (2016). Does Regression Produce Representative Estimates of Causal Effects? American Journal of Political Science, 60(1), 250–267. https://doi.org/10.1111/ajps.12185
- Becker, G. S. (1964). Human capital: A theoretical and empirical analysis, with special reference to education (first). University of Chicago Press.
- Brakenhoff, T. B., Mitroiu, M., Keogh, R. H., Moons, K. G. M., Groenwold, R. H. H., & Van Smeden, M. (2018). Measurement error is often neglected in medical literature: A systematic review. Journal of Clinical Epidemiology, 98, 89–97. https://doi.org/10.1016/j.jclinepi.2018.02.023
- Braun, M., & Müller, W. (1997). Measurement of education in comparative research. Comparative Social Research, 16, 163–201.
- Brauns, H., Scherer, S., & Steinmann, S. (2003). The CASMIN educational classification in international comparative research. In J. H. P. Hoffmeyer-Zlotnik & C. Wolf (Eds.), Advances in cross-national comparison: A European working book for demographic and socio-economic variables (pp. 221–244). Kluwer Academic/Plenum.
- Breen, R. (Ed.). (2004). Social mobility in Europe. Oxford University Press.
- Breen, R. (2019). Education and intergenerational social mobility in the US and four European countries. Oxford Review of Economic Policy, 35(3), 445–466. https://doi.org/10.1093/oxrep/grz013
- Caferra, R., Colasante, A., & Morone, A. (2021). The less you burn, the more we earn: The role of social and political trust on energy-saving behaviour in Europe. Energy Research & Social Science, 71, 101812. https://doi.org/10.1016/j.erss.2020.101812
- Cohen, J. (1988). Statistical power analysis for the behavioral sciences. Routledge.
- Collot, S., & Hemauer, T. (2021). A literature review of new methods in empirical asset pricing: Omitted-variable and errors-in-variable bias. Financial Markets and Portfolio Management, 35(1), 77–100. https://doi.org/10.1007/s11408-020-00358-0
- Davis, J. A. (1979). Background Variables and Opinions in the 1972-1977 Norc General Social Surveys: Ten Generalizations About Age, Education, Occupational Prestige, Race, Religion, and Sex, and Forty-Nine Opinion Items (2; GSS Topical Report). https://gss.norc.org/Documents/reports/topical-reports/TR02.pdf
- ESS Data Archive. (2023). European Social Survey Country Documentation Report, ESS 10—2020 (edition 3.0). SIKT. https://stessrelpubprodwe.blob.core.windows.net/data/round10/survey/ESS10_country_documentation_report_e03_0.pdf
- ESS Data Archive, & Schneider, S. L. (2023). Appendix A1 Education, ESS10—2020 ed. 3.0. In European Social Survey (Ed.), ESS10 Country Documentation Report, ed. 3.0. Sikt – Norwegian Agency for Shared Services in Education and Research. https://stessrelpubprodwe.blob.core.windows.net/data/round10/survey/ESS10_appendix_a1_e03_0.pdf
- European Social Survey European Research Infrastructure. (2023a). ESS round 5—2010. Family work and wellbeing, Justice (Version Data file edition 3.4) [Dataset]. Sikt – Norwegian Agency for Shared Services in Education and Research, Norway – Data Archive and distributor of ESS data for ESS ERIC. https://doi.org/10.21338/NSD-ESS5-2010
- European Social Survey European Research Infrastructure. (2023b). ESS round 6—2012. Personal wellbeing, Democracy (Version Data file edition 2.4) [Dataset]. Sikt – Norwegian Agency for Shared Services in Education and Research, Norway – Data Archive and distributor of ESS data for ESS ERIC. https://doi.org/10.21338/NSD-ESS6-2012
- European Social Survey European Research Infrastructure. (2023c). ESS round 7—2014. Immigration, Social inequalities in health. (Version Data file edition 2.2) [Dataset]. Sikt – Norwegian Agency for Shared Services in Education and Research, Norway – Data Archive and distributor of ESS data for ESS ERIC. https://doi.org/10.21338/NSD-ESS7-2014
- European Social Survey European Research Infrastructure. (2023d). ESS round 8—2016. Welfare attitudes, Attitudes to climate change. (Version Data file edition 3.0) [Dataset]. Sikt – Norwegian Agency for Shared Services in Education and Research, Norway – Data Archive and distributor of ESS data for ESS ERIC. https://doi.org/10.21338/NSD-ESS8-2016
- European Social Survey European Research Infrastructure. (2023e). ESS round 9—2018. Timing of life, Justice and fairness. (Version Data file edition 3.1) [Dataset]. Sikt – Norwegian Agency for Shared Services in Education and Research, Norway – Data Archive and distributor of ESS data for ESS ERIC. https://doi.org/10.21338/NSD-ESS9-2018
- European Social Survey European Research Infrastructure. (2023f). ESS round 10—2020. Democracy, Digital social contacts. (Version Data file edition 3.0) [Dataset]. Sikt – Norwegian Agency for Shared Services in Education and Research, Norway – Data Archive and distributor of ESS data for ESS ERIC. https://doi.org/10.21338/NSD-ESS10-2020
- Eurostat. (n.d.). Structure of earnings survey: List of SES variables. Retrieved 7 March 2024, from https://ec.europa.eu/eurostat/web/microdata/structure-of-earnings-survey
- Eurostat. (2017). 2016 AES manual Version 3. https://circabc.europa.eu/sd/a/700a220d-33dc-42d4-a5c4-634c8eab7b26/2016%20AES%20MANUAL%20v3_02-2017.pdf
- Ganzeboom, H. B. G., & Treiman, D. J. (1996). Internationally comparable measures of occupational status for the 1988 International Standard Classification of Occupations. Social Science Research, 25(3), 201–239. https://doi.org/10/cs5pf5
- German Microdata Lab. (2025). MISSY – Metadata for Official Statistics. EU-LFS 2022, Unweighted frequencies: HATLEVEL – All countries. https://www.gesis.org/missy/find-metadata
- GESIS-GML. (2023). Codebook EU-LFS 2021 yearly file. GESIS – Leibniz Institute for the Social Sciences. German Microdata Lab. https://www.gesis.org/missy/files/documents/EU-LFS/Codebook_EU-LFS-2021-yearly.pdf
- GESIS-GML. (2024). Codebook EU-SILC 2022 cross-sec file. GESIS – Leibniz Institut for the Social Sciences. German Microdata Lab. https://www.gesis.org/missy/files/documents/EU-SILC/Codebook_EU-SILC-2022-cross-sec.pdf
- Ghirelli, N., Lynn, P., Xena, C., Dorer, B., Ambler, M., Schwarz, H., Hanson, T., Kappelhof, J. W. S., Flore, P., Kessler, G., Lebedev, D., Briceno-Rosas, R., Frank, L.-H., Rød, L.-M., & Øvrebø, O-P. (2024). Quality Report for the European Social Survey, Round 10: Overall Face-to-Face Fieldwork and Data Quality Report. GESIS – Leibniz Institute for the Social Sciences. https://www.europeansocialsurvey.org/sites/default/files/2024-09/ESS10_Quality_Report.pdf
- Gignac, G. E., & Szodorai, E. T. (2016). Effect size guidelines for individual differences researchers. Personality and Individual Differences, 102, 74–78. https://doi.org/10.1016/j.paid.2016.06.069
- Goldstone, L. (1973). An International Standard Classification of Education (ISCED). Prospects, 3(3), 390–397. https://doi.org/10.1007/BF02198536
- Goldstone, L. (1975). The International Standard Classification of Education (ISCED). Prospects, 5(2), 283–284. https://doi.org/10.1007/BF02207511
- Hemmert, G. A. J., Schons, L. M., Wieseke, J., & Schimmelpfennig, H. (2018). Log-likelihood-based Pseudo- R2 in Logistic Regression: Deriving Sample-sensitive Benchmarks. Sociological Methods & Research, 47(3), 507–531. https://doi.org/10.1177/0049124116638107
- ISSP Demographic Methods Group (DMG). (2021). ISSP Background Variables Guidelines for ISSP 2020 “Environment IV”—Version of 2021-02-19. GESIS – Leibniz Institute for the Social Sciences. https://www.gesis.org/fileadmin/admin/Dateikatalog/pdf/BV_guidelines_for_issp2020_v2.pdf
- Kenny, M., & Luca, D. (2021). The urban-rural polarisation of political disenchantment: An investigation of social and political attitudes in 30 European countries. Cambridge Journal of Regions, Economy and Society, 14(3), 565–582. https://doi.org/10.1093/cjres/rsab012
- Kerckhoff, A. C., & Dylan, M. (1999). Problems with international measures of education. Journal of Socio-Economics, 28(6), 759–775. https://doi.org/10/dqg4vn
- Kerckhoff, A. C., Ezell, E. D., & Brown, J. S. (2002). Toward an improved measure of educational attainment in social stratification research. Social Science Research, 31(1), 99–123. https://doi.org/10/ftqgmx
- Koch, A., & Briceno-Rosas, R. (2023). Assessment of socio-demographic sample composition in ESS Round 10. GESIS – Leibniz Institute for the Social Sciences. https://www.europeansocialsurvey.org/sites/default/files/2024-08/ESS10_sample_composition%20.pdf
- König, W., Lüttinger, P., & Müller, W. (1988). A comparative analysis of the development and structure of educational systems (Issue 12) [CASMIN Working Paper]. University of Mannheim.
- Kulin, J., Johansson Sevä, I., & Dunlap, R. E. (2021). Nationalist ideology, rightwing populism, and public views about climate change in Europe. Environmental Politics, 30(7), 1111–1134. https://doi.org/10.1080/09644016.2021.1898879
- Landwehr, C., & Ojeda, C. (2021). Democracy and Depression: A Cross-National Study of Depressive Symptoms and Nonparticipation. American Political Science Review, 115(1), 323–330. https://doi.org/10.1017/S0003055420000830
- Lipps, J., & Schraff, D. (2021). Regional inequality and institutional trust in Europe. European Journal of Political Research, 60(4), 892–913. https://doi.org/10.1111/1475-6765.12430
- Lumley, T. (2023). survey: Analysis of complex survey samples.
- OECD. (2023). PISA 2022 Results (Volume I): The State of Learning and Equity in Education. OECD. https://doi.org/10.1787/53f23881-en
- OECD. (2024). Do Adults Have the Skills They Need to Thrive in a Changing World?: Survey of Adult Skills 2023. OECD. https://doi.org/10.1787/b263dc5d-en
- OECD & Eurostat. (2014). Joint Eurostat-OECD guidelines on the measurement of educational attainment in household surveys (Issue September). OECD, Eurostat.
- R Core Team. (2020). R: A Language and Environment for Statistical Computing. R Foundation for Statistical Computing. https://www.R-project.org/
- Schneider, S. L. (2009). Confusing Credentials: The Cross-Nationally Comparable Measurement of Educational Attainment: DPhil thesis. University Press of Oxford. Retreived from https://ora.ox.ac.uk/objects/uuid:15c39d5 [27.08.2019].
- Schneider, S. L. (2010). Nominal comparability is not enough: (In-)equivalence of construct validity of cross-national measures of educational attainment in the European Social Survey. Research in Social Stratification and Mobility, 28(3), 343–357. https://doi.org/10/dnhz39
- Schneider, S. L. (2013). The International Standard Classification of Education 2011. In G. E. Birkelund (Ed.), Class and Stratification Analysis (Vol. 30, pp. 365–379). Emerald. https://doi.org/10.1108/S0195-6310(2013)0000030017
- Schneider, S. L. (2016). The Conceptualisation, Measurement, and Coding of Education in German and Cross-National Surveys. GESIS Survey Guidelines, 20. https://doi.org/10.15465/gesis-sg_en_020
- Schröder, H. (2014). Levels and Loadings: Two Methods to Improve the Measurement of Education in Comparative Research [PhD, Vrije Universiteit Amsterdam]. https://research.vu.nl/en/publications/levels-and-loadings-two-methods-to-improve-the-measurement-of-edu
- Shavit, Y., & Blossfeld, H.-P. (Eds.). (1993). Persistent inequality: Changing educational attainment in thirteen countries. Westview.
- Shavit, Y., & Müller, W. (Eds.). (1998). From school to work: A comparative study of educational qualifications and occupational destinations. Clarendon Press.
- Smith, T. W. (1995). Some aspects of measuring education. Social Science Research, 24(3), 215–242. https://doi.org/10/b5nmt7
- UNESCO. (1978). Revised recommendation concerning the international standardization of educational statistics. UNESCO.
- UNESCO Institute for Statistics. (2006). International Standard Classification of Education: ISCED 1997 (re-edition) [UNESCO Institute for Statistics]. UNESCO. http://uis.unesco.org/sites/default/files/documents/international-standard-classification-of-education-1997-en_0.pdf
- UNESCO Institute for Statistics. (2012). International Standard Classification of Education—ISCED 2011. UNESCO Institute for Statistics. https://unesdoc.unesco.org/ark:/48223/pf0000219109
- von Davier, M., Kennedy, A., Reynolds, K., Fishbein, B., Khorramdel, L., Aldrich, C., Bookbinder, A., Bezirhan, U., & Yin, L. (2024). TIMSS 2023 International Results in Mathematics and Science. Boston College, TIMSS & PIRLS International Study Center. https://timss2023.org/results/
- Zawadzki, R. S., Grill, J. D., Gillen, D. L., & and for the Alzheimer’s Disease Neuroimaging Initiative. (2023). Frameworks for estimating causal effects in observational settings: Comparing confounder adjustment and instrumental variables. BMC Medical Research Methodology, 23(1), 122. https://doi.org/10.1186/s12874-023-01936-2
- Zhang, D. (2022). rsq: R-Squared and Related Measures. https://CRAN.R-project.org/package=rsq
-
Keywords
calibration CATI coverage coverage bias cross-national surveys data linkage data quality European Social Survey experiment face-to-face face-to-face survey Facebook hard to reach populations incentives item nonresponse measurement measurement error mixed-mode surveys multitasking non-probability samples Nonresponse nonresponse bias nonresponse rates paradata PIAAC Probability sample probability samples QR codes rare populations response rate Satisficing social desirability Social media survey survey-taking climate survey data survey management survey methods Telephone survey telephone surveys total survey error unit nonresponse validity web survey Web surveys weighting
