

Mitigating Fraud in Incentivized Online Surveys: Lessons from Facebook Recruitment in Nigeria
Arnim Langer  KU Leuven, Belgium
Lucas Leopold KU Leuven, Belgium
Bart Meuleman KU Leuven, Belgium & University of Bremen, Germany
Line Kuppens University of Amsterdam, The Netherlands
Abhishegh Menon KU Leuven, Belgium
Langer A., Leopold L., Meuleman B., Kuppens L. & Menon A. Mitigating Fraud in Incentivized Online Surveys: Lessons from Facebook Recruitment in Nigeria. Survey Methods: Insights From the Field. Retrieved from https://surveyinsights.org/?p=20106
© the authors 2025. This work is licensed under a Creative Commons Attribution 4.0 International License (CC BY 4.0) 
Abstract
In this paper we document our experience with conducting the Perceptions of Inequality and Redistribution Survey (PIRS), which is an online, multi-round survey conducted among Nigerian adults who were recruited via a Facebook ad campaign. The paper discusses our initial and unsuccessful recruitment strategy as well as our subsequent revised strategy in which we were able to effectively address the problems and pitfalls which caused our initial recruitment strategy to be unsuccessful. By discussing both strategies in detail, we provide original methodological and practical insights into how best to conduct online surveys with compensation in low- and middle-income countries (LMICs) with the help of a Facebook ad campaign. On the basis of our experience with the PIRS in Nigeria, we provide several actionable recommendations to researchers who wish to use Facebook for generating a compensated online survey panel in both LMICs and higher income countries.
Keywords
data collection, data quality, Facebook, survey data, Web surveys
Acknowledgement
Funding: We are grateful for the generous project funding (G068320N) we received from the Research Foundation – Flanders (FWO). Declaration of Conflicting Interests: The authors declared no potential conflicts of interest with respect to the research, authorship, and/or publication of this article.
Copyright
© the authors 2025. This work is licensed under a Creative Commons Attribution 4.0 International License (CC BY 4.0)
1. Introduction
The online recruitment of survey respondents has become an increasingly important approach to collect survey samples and panels both in high and low- and middle-income countries (LMIC). Instead of relying on commercial data collection agencies, researchers increasingly recruit participants themselves with the help of adverts on social media sites, in particular Facebook (see, e.g., Pötzschke & Braun, 2017; Rosenzweig et al., 2020; Neundorf & Özturk, 2021). Recruiting survey participants via Facebook ads has proven to be a useful and cost-effective strategy for generating nationwide survey samples, especially in wealthy countries (Grow et al., 2022; Neundorf & Oztürk, 2023). Even if the resulting samples lack representativeness compared to probability samples, this approach can be useful for rapid and affordable data collection, particularly among subgroups of the population that have high rates of internet access or when there are no reliable sampling frames available.
Samples recruited via social media platforms commonly report an overrepresentation of younger respondents, females, and more highly educated – depending on the targeting of the ads and topic of the survey (Zindel, 2022). However, research on the representativeness and quality of survey data that are collected via Facebook ad campaigns in LMICs has been limited, especially surveys which employ (quasi-)monetary incentives. One notable exception is the study by Hoffmann Pham et al. (2019), which found an overrepresentation of participants that are male, highly educated, and residing in more highly developed locations. Most studies either do not offer any survey incentives (particularly in wealthy settings, e.g., Neundorf & Oztürk, 2023; but also in LMICs, Beam, 2023) or they use a raffle (e.g., Olamijuwon, 2021). Yet, while incentives may improve representativeness, they may also reduce data quality through, for instance, enhanced satisficing, which is already a prime concern with online surveys (Beam, 2023). The presence of incentives could also encourage viral sharing, a practice alluded to by Rosenzweig et al. (2020) – one of the few studies that provided direct compensation for participation in their survey.
We aim to fill this important lacuna by documenting our strategy to recruit an online panel of adult Nigerians. Participants were targeted with Facebook ads and received a compensation in the form of mobile phone credit for their participation. Upon assessing the quality of the data that we collected with our initial approach (which we refer to as Strategy 1), we concluded that the data were unsuitable for further analysis. Especially the fact that Facebook users could take the survey immediately after interacting with our ad created ‘perverse’ incentives. In order to receive multiple compensations, Facebook users discovered ways to complete the survey multiple times and often gave inaccurate responses. This forced us to rethink our strategy completely. Our paper discusses both our failed recruitment strategy (i.e., Strategy 1) and our subsequent revised strategy (i.e., Strategy 2) in which we were able to address the pitfalls which caused our initial strategy to fail.
By discussing both strategies, we provide original methodological and practical insights into how to conduct online surveys with compensation in LMICs with the help of Facebook ad campaigns. More specifically, we aim to address the following two research questions in this paper: (1) What are the main pitfalls when using Facebook ads for recruiting compensated survey participants for a panel in Nigeria? And (2) How can Facebook ads be used for conducting a high-quality online panel study in Nigeria? By doing so, we show that subtle differences in the recruitment strategy can have a large impact on the response quality.
The remainder of this paper is structured as follows. First, we describe the context of our survey and our initial recruitment strategy. In doing so, we discuss the main challenges of this strategy, which forced us to rethink our approach. In Section 3, we explain how we revised our strategy and provide a side-by-side comparison of both strategies with a particular focus on how the quality of the data improved. We conclude by discussing some methodological and practical guidelines that emerge on the basis of our study.
2. Perceptions of Inequality and Redistribution Survey (PIRS): Strategy 1
2.1 Survey context and basic campaign characteristics
This study is based on our experience with the Perceptions of Inequality and Redistribution Survey (PIRS)[1], an online survey conducted in Nigeria between October 2022 and January 2023. Its objective was to determine how adult Nigerians residing in Nigeria (18 years and above) perceived the socio-economic and political inequalities between different ethnic groups in Nigeria and how far respondents supported group-based redistribution policies. The PIRS was designed as a multi-round survey, consisting of four thematic rounds. In this paper, we will focus on participant recruitment and the first two rounds of both surveys.
Drawing on previous studies that used Facebook ads to recruit survey respondents, we opted for a traffic campaign, which aims to maximize the number of clicks rather than mere views or survey completions. For optimization, Facebook campaigns go through an initial learning phase during which an algorithm determines who is most likely to interact with an ad (see e.g. Thomson & Ito, 2014; Neundorf & Oztürk, 2023). Further, in order to ensure coverage of the different regions and strata of the Nigerian population, our ad campaign was stratified by gender, age group, and state of residence. Basically, our initial strategy was designed as follows:
- To make sure that Facebook users across the whole country would see our ads, our ad campaign targeted each of Nigeria’s 36 states as well as the Federal Capital Territory (FCT) separately. Full geographic coverage would not have been guaranteed had we opted for a non-stratified, country-wide campaign because of Facebook’s optimization algorithm.
- In each state, separate ads targeted respondents based on their combination of gender (male or female) and broad age group (≤35 and 36+), amounting to 148 unique ad conditions.
- Because the costs (and hence the frequency of ad displays) on Facebook are based on a bid system, we allocated twice as much budget to females and states in the North compared to male respondents in the South of the country, as we expected the former groups to be more difficult to reach.
- We also examined the impact of three different incentive levels on recruitment and data quality. These were advertised on our ad banners and included the following amounts: (1) no compensation; (2) ₦250 (approximately €0.58); and (3) ₦640 (approximately €1.49).
Facebook users who clicked on our ads (see Appendix Figure A1 for ad creative and ad text) were redirected to the survey via a permanent multi-use link, and they could complete the survey straightaway. On our survey platform, we set up quotas for gender, age group, and state of residence to avoid oversampling respondents with specific demographic characteristics. Quotas for each state were based on the most recent population estimates from the National Bureau of Statistics (2020). Since these data did not include gender and age breakdowns, we assumed that the population of each state was evenly divided between males and females, which is in line with a more recent NBS report (National Bureau of Statistics, 2021). Based on data from the international database of the United States Census Bureau, we also assumed that the Nigerian adult population was evenly divided between individuals aged 36 and older and those younger. Incidentally, the African Union’s African Youth Charter defines 35 as the maximum age for youths, making it a meaningful benchmark for comparing respondents considered young versus older individuals from a regional perspective. Respondents who reported to have demographic characteristics for which quotas had already been filled could not proceed past the first battery of survey questions and were informed that they were not eligible to participate in the survey for undisclosed reasons.
After completing the first round, respondents were asked for their phone number so we could send the compensations and the link to the next survey round via SMS. The compensation was paid in the form of mobile phone top-up credit. We adopted a two-step approach, whereby we first implemented our Facebook ad campaign in Lagos and Kebbi state before dropping the less effective incentive conditions and expanding it to the rest of the country. Both states were selected deliberately, with the former being the highest and the latter the lowest ranked state in terms of socio-economic development. It turned out that the high incentive condition of ₦640 was by far the most effective condition for recruiting respondents. While in this condition, we could recruit 2752 respondents (€2.67 per valid response), the other conditions were less successful in terms of the number of valid responses (no compensation: 34; medium compensation: 698) and total cost per valid response (no compensation: €32.23; medium compensation: €5.19). Consequently, we discontinued the other two incentive conditions before expanding the campaign to the rest of the country. The mean cost of each ad set amounted to €48.49 (Median: €11.16; Q1: €8.15; Q3: €22.36). Appendix Table A1 provides further details about the reach and costs of each incentive condition.
Upon completion, a cookie was placed on participants’ devices to prevent multiple submissions from the same individual. Importantly, it turned out that this did not prevent multiple submissions effectively (see below). As mentioned above, our initial recruitment strategy resulted in a sample which was unsuitable for analysis. Before comparing the quality of this sample with the sample collected via our revised strategy (i.e., Strategy 2), we will discuss the main challenges and problems of our initial strategy in the next section.
2.2 Challenges with recruiting an online survey sample in Nigeria
With our initial strategy, we encountered three important pitfalls: 1) Facebook-specific challenges, including the platform’s community guidelines, 2) multiple submissions and data quality, and 3) difficulties with inviting respondents to subsequent rounds of our survey, which we discuss in greater detail in the remainder of this section.
2.2.1 Facebook specific challenges
Rigid advertising rules
Facebook’s community guidelines for advertisers do not offer much flexibility to cater to the needs of specific research projects. For instance, the number of ad conditions that can run simultaneously is being determined by an organization’s monthly ad spending. For pages that have spent less than $100,000 in the highest spending month (which probably applies to most academic clients), this number is limited to 250. This regulation clearly limits the complexity of the targeting which can be implemented.
Advertisers who are new to the platform are initially held to daily spending limits of around €25. As soon as this limit is reached, active ads will be stopped and only resume on the following day. This spending limit curtails the size of the audience which can be reached at the beginning of an ad campaign. As there are also minimum spending amounts for each ad condition (about €1 in our case), the number of ads that can run simultaneously is further limited. As Facebook gains more confidence that advertisers consistently pay their invoices in full, daily spending limits gradually increase until they are completely removed. It is hence crucial that the payment method that is linked to one’s ad account does not reject payment requests from Facebook. In our experience, it took around six weeks until the spending limits were lifted, and we could allocate budgets freely.
Selection bias and “going viral”
Besides bias-inducing effects of the optimization algorithm (see above), selection bias can also be introduced as a result of people sharing the ads with others, either on Facebook or on other platforms. When we conducted our initial survey in October-December 2022, the share function on ads could not be disabled which led to serious complications because many users shared the link to our survey with other people. This increases the risk of bias because people are more likely to share the link with people who have similar characteristics as themselves. In the absence of any compensation, sharing is particularly likely to occur among people who are interested in the topic (as a matter of fact, Rosenzweig et al., 2020 recommend such snowballing to reach populations with a particular interest). Yet, survey incentives provide a financial incentive to share a survey link with potentially considerable consequences for data quality. Examining the Referer variable in our dataset, which captures the website from which the respondents were referred to our survey, showed us that a considerable number of respondents had been redirected from a Nigerian technology blog, which not only shared the URL to our survey, but also motivated the readers to lie about their demographics in order to not be excluded from the survey based on our quota. We thus expected that many responses to the survey were faulty. Moreover, respondents who are predominantly motivated by the offered compensation are less likely to answer accurately and consistently in a survey. In this respect, we found that the median duration of our Strategy 1 survey was only 5:09 minutes. On the basis of an in-person pre-test of our questionnaire in Nigeria, we expected motivated respondents to spend around 10 minutes on the survey (see Appendix Table A2).
2.2.2 Incentives for multiple submissions
Despite our precautions to prevent multiple submissions, an examination of the user agent strings (which contain respondents’ IP addresses and mobile device types) showed that a substantial number of respondents took the survey multiple times back-to-back. Out of the 3485 responses submitted in this round, we flagged 538 responses, which registered with a phone number that had also been used for another submission. Further, we flagged 736 responses because it was submitted from a device which has been used for submitting at least one other response (see Appendix Table A3). Respondents who did this usually provided different responses to the demographic background questions. It turned out that the problem of multiple submissions particularly occurred in the high incentive condition (see Table 1). This clearly suggests that for many respondents the main or possibly the only motivation for taking the survey was the offered compensation in the form of mobile phone credit. The fact that we did not have personalized survey links in round 1, but a public link which could be accessed by anyone, clearly contributed to this problem.
2.2.3 Difficulties contacting respondents for the second round of the survey
A third major challenge was the difficulty to contact respondents via text messages in order to share the link to the next survey round. In contrast to earlier surveys conducted in Nigeria (e.g. Langer et al., 2017), we were unable to deliver our text messages reliably to all respondents. To maximize our chances, we relied on two bulk SMS providers, i.e., one based in Africa and the other based in the EU. However, out of the 1,707 respondents we intended to invite to round 2, we could only reach 1,516 respondents after three contact attempts. We faced these problems despite having an alphanumeric sender ID whitelisted with the major mobile providers in Nigeria (i.e., MTN, Airtel, Glo, 9mobile and Etisalat). However, as a foreign organization, we were offered only limited functionality. We were thus unable to send messages to clients who had the do-not-disturb mode activated and in general it seems that the messages have a higher chance of being delivered if the sender is based in Nigeria.
3. Perceptions of Inequality and Redistribution Survey (PIRS): Strategy 2
3.1 Changes to the recruitment strategy
Given the challenges identified above and the fact that the data were of very low quality, we decided to develop an alternative data collection strategy (‘Strategy 2’), which we document in this section. This revised strategy was implemented between February and May 2023. The mean cost per ad set amounted to €29.72 (median: €19.17; Q1: €13.11; Q3: €38.37).
Luckily, the first constraint, i.e. the confining spending limits, resolved itself. Because the ad campaign of our initial strategy had been running long enough, the spending limitations were lifted by the time that we started our second attempt.
Second, the fact that respondents from Strategy 1 were able to complete the survey immediately after interacting with our ads presented a strong incentive to complete the survey multiple times. In order to reduce the likelihood of multiple submissions, we decided to no longer allow participants to take the survey right away. Instead, our ads would take them to a registration page which only asked a few demographic questions (i.e., gender, age, state of residence, and phone number). Each user was subsequently informed that we would randomly select a sample from those who had registered. The introduction of this registration stage allowed us to draw a sample from prospective respondents in accordance with the different strata.
The revised strategy had several advantages over our initial approach. First, participants would have to wait for a few days before they could take the survey and earn their compensation. Thus, it would not be possible to take the survey multiple times within a short period of time. Second, we were able to drop respondents from the panel if they registered multiple times, which we considered a clear indication of low intrinsic motivation to respond to the survey accurately. Third, we could use personalized single-use survey links right from round 1 of the survey which ensured that the survey link could not be shared with others.
Third, we decided to use WhatsApp instead of SMS to contact participants. To do so, we added a question to the registration page which asked prospective participants whether their phone number was connected to WhatsApp or not. In order to ensure that we did not introduce some sort of selection bias by using WhatsApp, we ran a series of χ2 tests to compare prospective respondents who indicated that they were using WhatsApp with those who indicated they were not. In terms of gender, age, and state of residence, we did not find significant differences (see Appendix Table A4). We thus decided to only invite respondents who were using WhatsApp.
The decision to contact respondents via WhatsApp had three clear advantages. First, sending WhatsApp messages was significantly cheaper compared to SMS messaging. Second, it turned out to be a lot more reliable and less time-consuming. While in some cases in the Strategy 1 survey we could not reach participants even after sending them three SMS-messages over the course of two weeks, WhatsApp messages were delivered smoothly. Out of 2711 respondents that were recruited via Strategy 2 and indicated that they were using WhatsApp, we were able to successfully invite 2563 respondents to the first round of our survey within one week. Finally, using WhatsApp enabled two-way messaging. Thus, we could directly interact with participants in case they had questions about the survey.
3.2 Improvements in data quality
In this section we compare the quality of the data collected via both recruitment strategies. We will use the following metrics for evaluating the quality of the collected data: 1) time spent on questionnaire, 2) suspicious response patterns, 3) the extent of straight-lining, and 4) multiple submissions. Since this is a panel study, we also analyze (5) attrition rates, and 6) the consistency of background characteristics across survey rounds.
3.2.1 Time spent on questionnaire
It appears that respondents who were recruited through Strategy 2 took the survey much more seriously, given that they spent substantially more time on the questionnaires (see Table A2 in supplementary materials for more details). The median duration of the surveys in Strategy 2 was 9:14 minutes for Round 1 and 9:58 for Round 2, which was very close to the anticipated length based on an in-person pilot survey we conducted in Nigeria. For comparison, the median duration among respondents from Strategy 1 was only 5:09 minutes for Round 1 and 6:35 minutes for Round 2. Arguably, the main reason why respondents that were recruited via Strategy 2 took more time to complete our questionnaire was that these individuals were overall more intrinsically motivated to participate in our survey.
3.2.2 Suspicious response patterns
As explained above, in the Strategy 1 survey we employed a set of predetermined quotas based on gender, age, and state of residence. Importantly, we decided to only set up quotas for male and female respondents, but not for the categories ‘Other’ and ‘Prefer not to say’, as we did not expect a large number of responses within these categories. Similarly, we created quotas for each state, but not for the category ‘Prefer not to say’. Even though we did not disclose any details about our quota mechanism, a number of respondents figured out how to get around our quota filter, resulting in suspicious response patterns. After the quota for young male respondents from Lagos state was filled and thus participants with these characteristics were no longer able to take the survey, we saw a sudden surge in the number of respondents opting not to disclose their state of residence (see Figure A1 in supplementary materials). In particular, five days after this quota was filled, 78% of all responses submitted on that day indicated ‘Prefer not to say’ as the chosen option for the state of residence question. In reaction to this, we set up an additional quota for this response option. However, after setting the additional quota for the state of residence variable, the number of respondents who decided not to identify their gender as either male or female sharply increased, i.e. 36% on the first day after adjusting the quotas and 71% on the second day. These patterns clearly suggest that some respondents were strongly motivated by the offered incentive and discovered creative ways to bypass our security measures. In strategy 2, we did not come across similar patterns.
3.2.3 Straight-lining and convergent validity
We further assessed to what extent respondents gave meaningful responses to the survey questions by assessing straight-lining tendencies and the extent of convergent validity of a previously validated construct. For this purpose, we used the responses that participants recruited via both strategies gave to the Short Social Dominance Orientation scale (SSDO; Pratto et al., 2013). This scale consists of the following four items, which were part of the second questionnaire:
- In setting priorities, we must consider all groups.
- We should not push for group equality.
- Group equality should be our ideal.
- Superior groups should dominate inferior groups.
Response options for all items ranged from ‘Strongly agree’ to ‘Strongly disagree’ on a 7-point scale.
We found that among the 779 respondents recruited via Strategy 1 who responded to all four questions, 58 straight-lined this battery (7.4%). These respondents provided the same answer to the four items, despite the fact that two items express high levels and two others low levels of SDO. In contrast, only 3.7% of the 2139 respondents recruited via Strategy 2 straight-lined this set of questions. Thus, the adjustments to our strategy led to a reduction of straight-lining by 50%. What is more, respondents recruited via Strategy 2 appeared to have given responses that had substantially higher levels of convergent validity. In this respect, we expected the scores of items 1 and 3 to be negatively correlated with items 2 and 4. In order to test whether we find this relationship and to what extent it is dependent on the attention that the respondents paid to the survey, we constructed two subscales by summing the scores of the positively worded items and the negatively worded items. Figure 1 visualizes how the Pearson correlation coefficients between the two subscales varies depending on the time that somebody spent on the survey.
Figure 1: Pearson correlation coefficients between SSDO subscales by survey duration
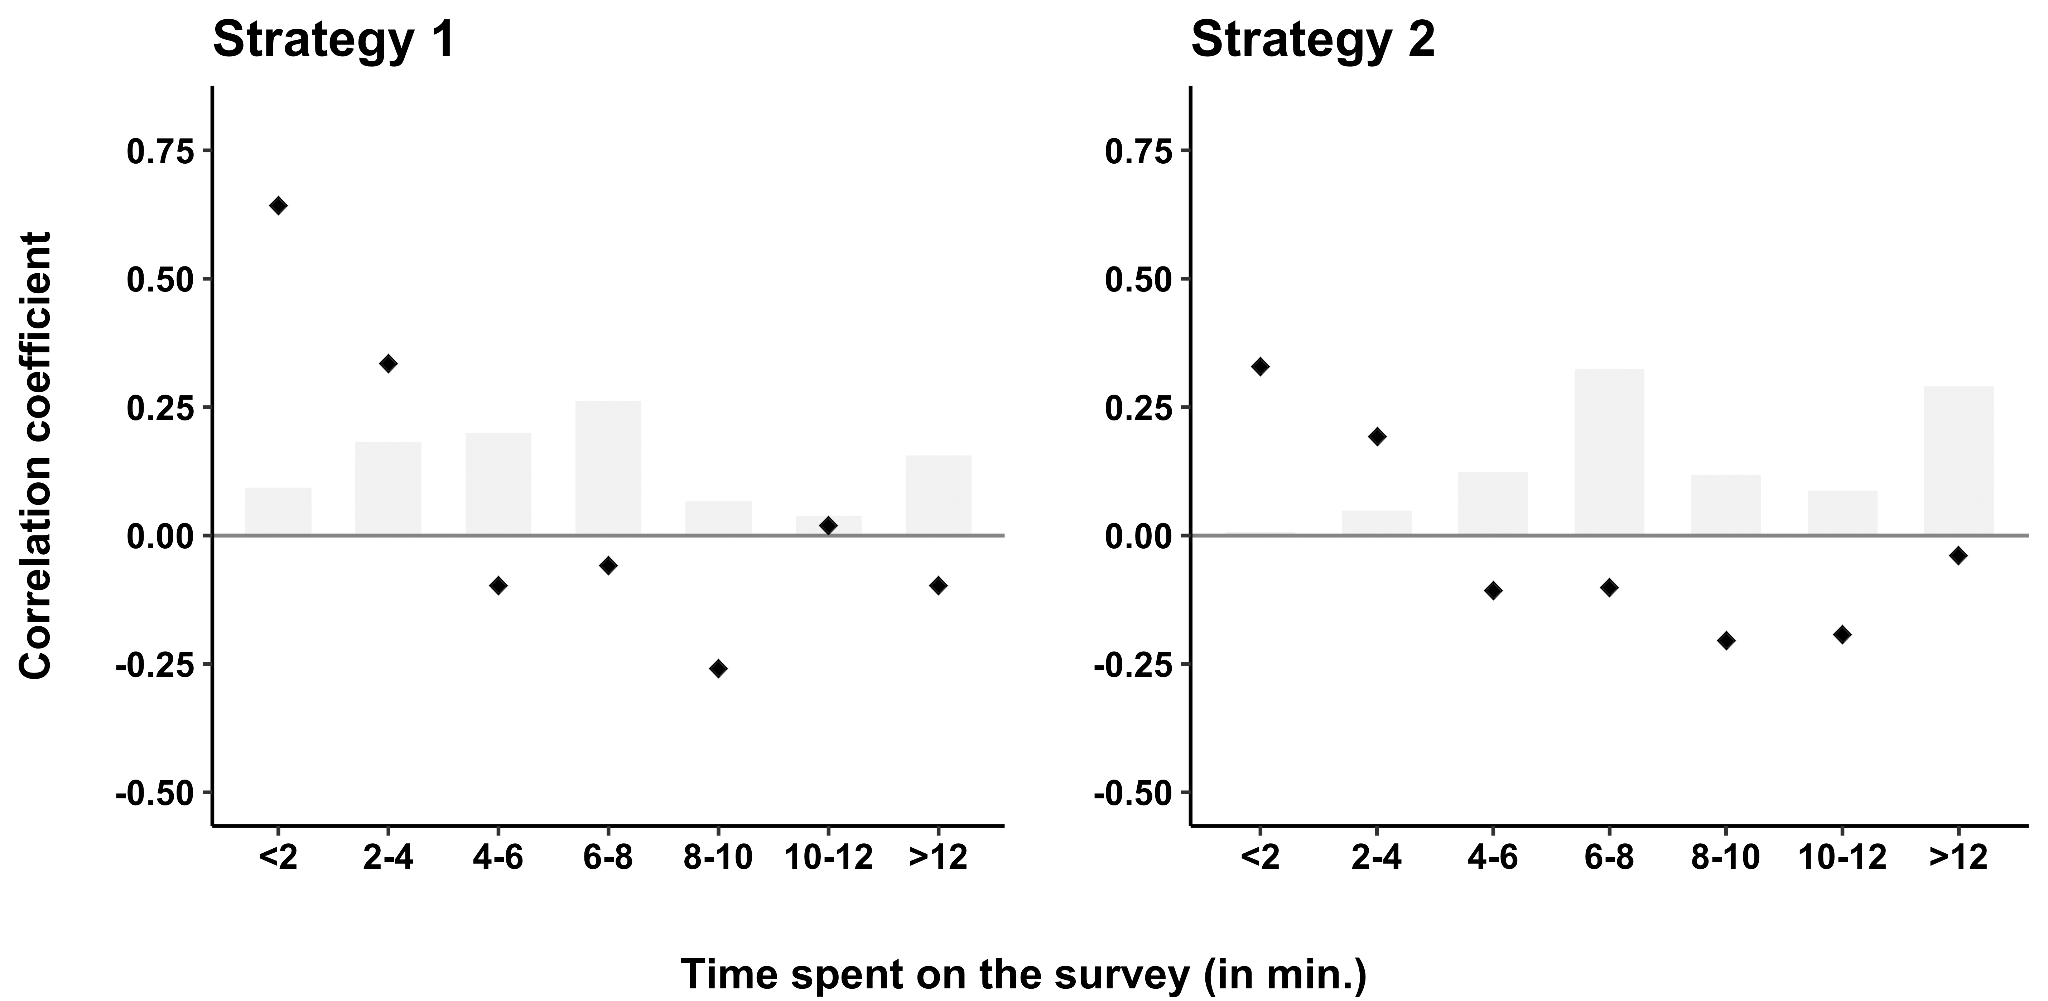
Note: Grey bars visualize the relative frequency of each category
We found that among respondents who were recruited via Strategy 1 and spent less than 4 minutes on the survey, the two subscales were positively correlated, clearly suggesting that these respondents did not pay attention to the survey. Among respondents recruited via Strategy 2, we also found a positive correlation among participants who spent less than four minutes on the survey. Importantly, the correlations for respondents recruited via Strategy 2 who spent between 6 and 12 minutes on our survey were all negative, which strongly implies that the adjustments we made to our initial strategy substantially increased the quality of our data.
3.2.4 Multiple submissions
Given our experience with Strategy 1, we expected a proportion of respondents to try to complete our survey multiple times. In order to assess the extent to which there are multiple submissions from the same person, we analyze two metrics. First, the number of surveys which may have been submitted from the same device. We quantified this metric by combining information about the day on which a given survey was completed, the IP address from which the submission was done, and data from the respondents’ user agent string which includes brand and model of the device and information about the operating system and the browser which was used to complete the questionnaire. Second, we also analyzed the phone numbers which were recorded as part of the submissions and particularly checked for duplicate submissions.
With regard to the former metric (i.e., multiple submissions from the same device), we found that there was a steep decline in the number of duplicate submissions between Strategy 1 and Strategy 2. In Strategy 1, out of the 3485 questionnaires which were completed, we flagged 736 submissions as potential device duplicates (see Table A3 in supplementary materials for more information). This clearly suggests that the cookie which was placed on respondents’ devices did not effectively prevent multiple submissions; possibly because respondents may have been using private browsing or regularly deleted their cookies. Furthermore, 538 of those surveys were submitted with phone numbers which were given more than once. This clearly indicates that a considerable number of respondents recruited via Strategy 1 took the survey multiple times. Because the revised strategy enabled us to identify duplicate devices and phone numbers already at the registration stage and hence drop suspicious participants from the panel, there were only 54 device duplicates in Round 1 and 35 in Round 2 out of 2333 completed questionnaires and there were no longer any duplicate phone numbers.
3.2.5 Attrition rate
Turning to metrics specific to panel data, it is noteworthy that the attrition between the two rounds in the Strategy 2 survey was much lower than in Strategy 1. While in the Strategy 1 survey, 76% of the participants of round 1 did not participate in the second round, 93% of the respondents who were recruited via Strategy 2 completed both rounds of the survey.
3.2.6 Response consistency across survey rounds
Next, we examine to what extent respondents recruited via both strategies answered basic demographic background questions consistently across both survey rounds. In order to test this, we asked respondents the following questions in both rounds of our surveys: the state in which they were born, their ethnic identity, their gender, and their age. While respondents could have made mistakes in answering these questions in different rounds, it is highly unlikely that they would get all 4 answers wrong due to inattention. Clearly, the higher the level of overlap between respondents’ answers, the more confident we can be that the same person has completed both questionnaires attentively. Table 1 below provides detailed information on the response consistency regarding these 4 questions for both strategies.
Table 1: Comparison of response consistency in both strategies
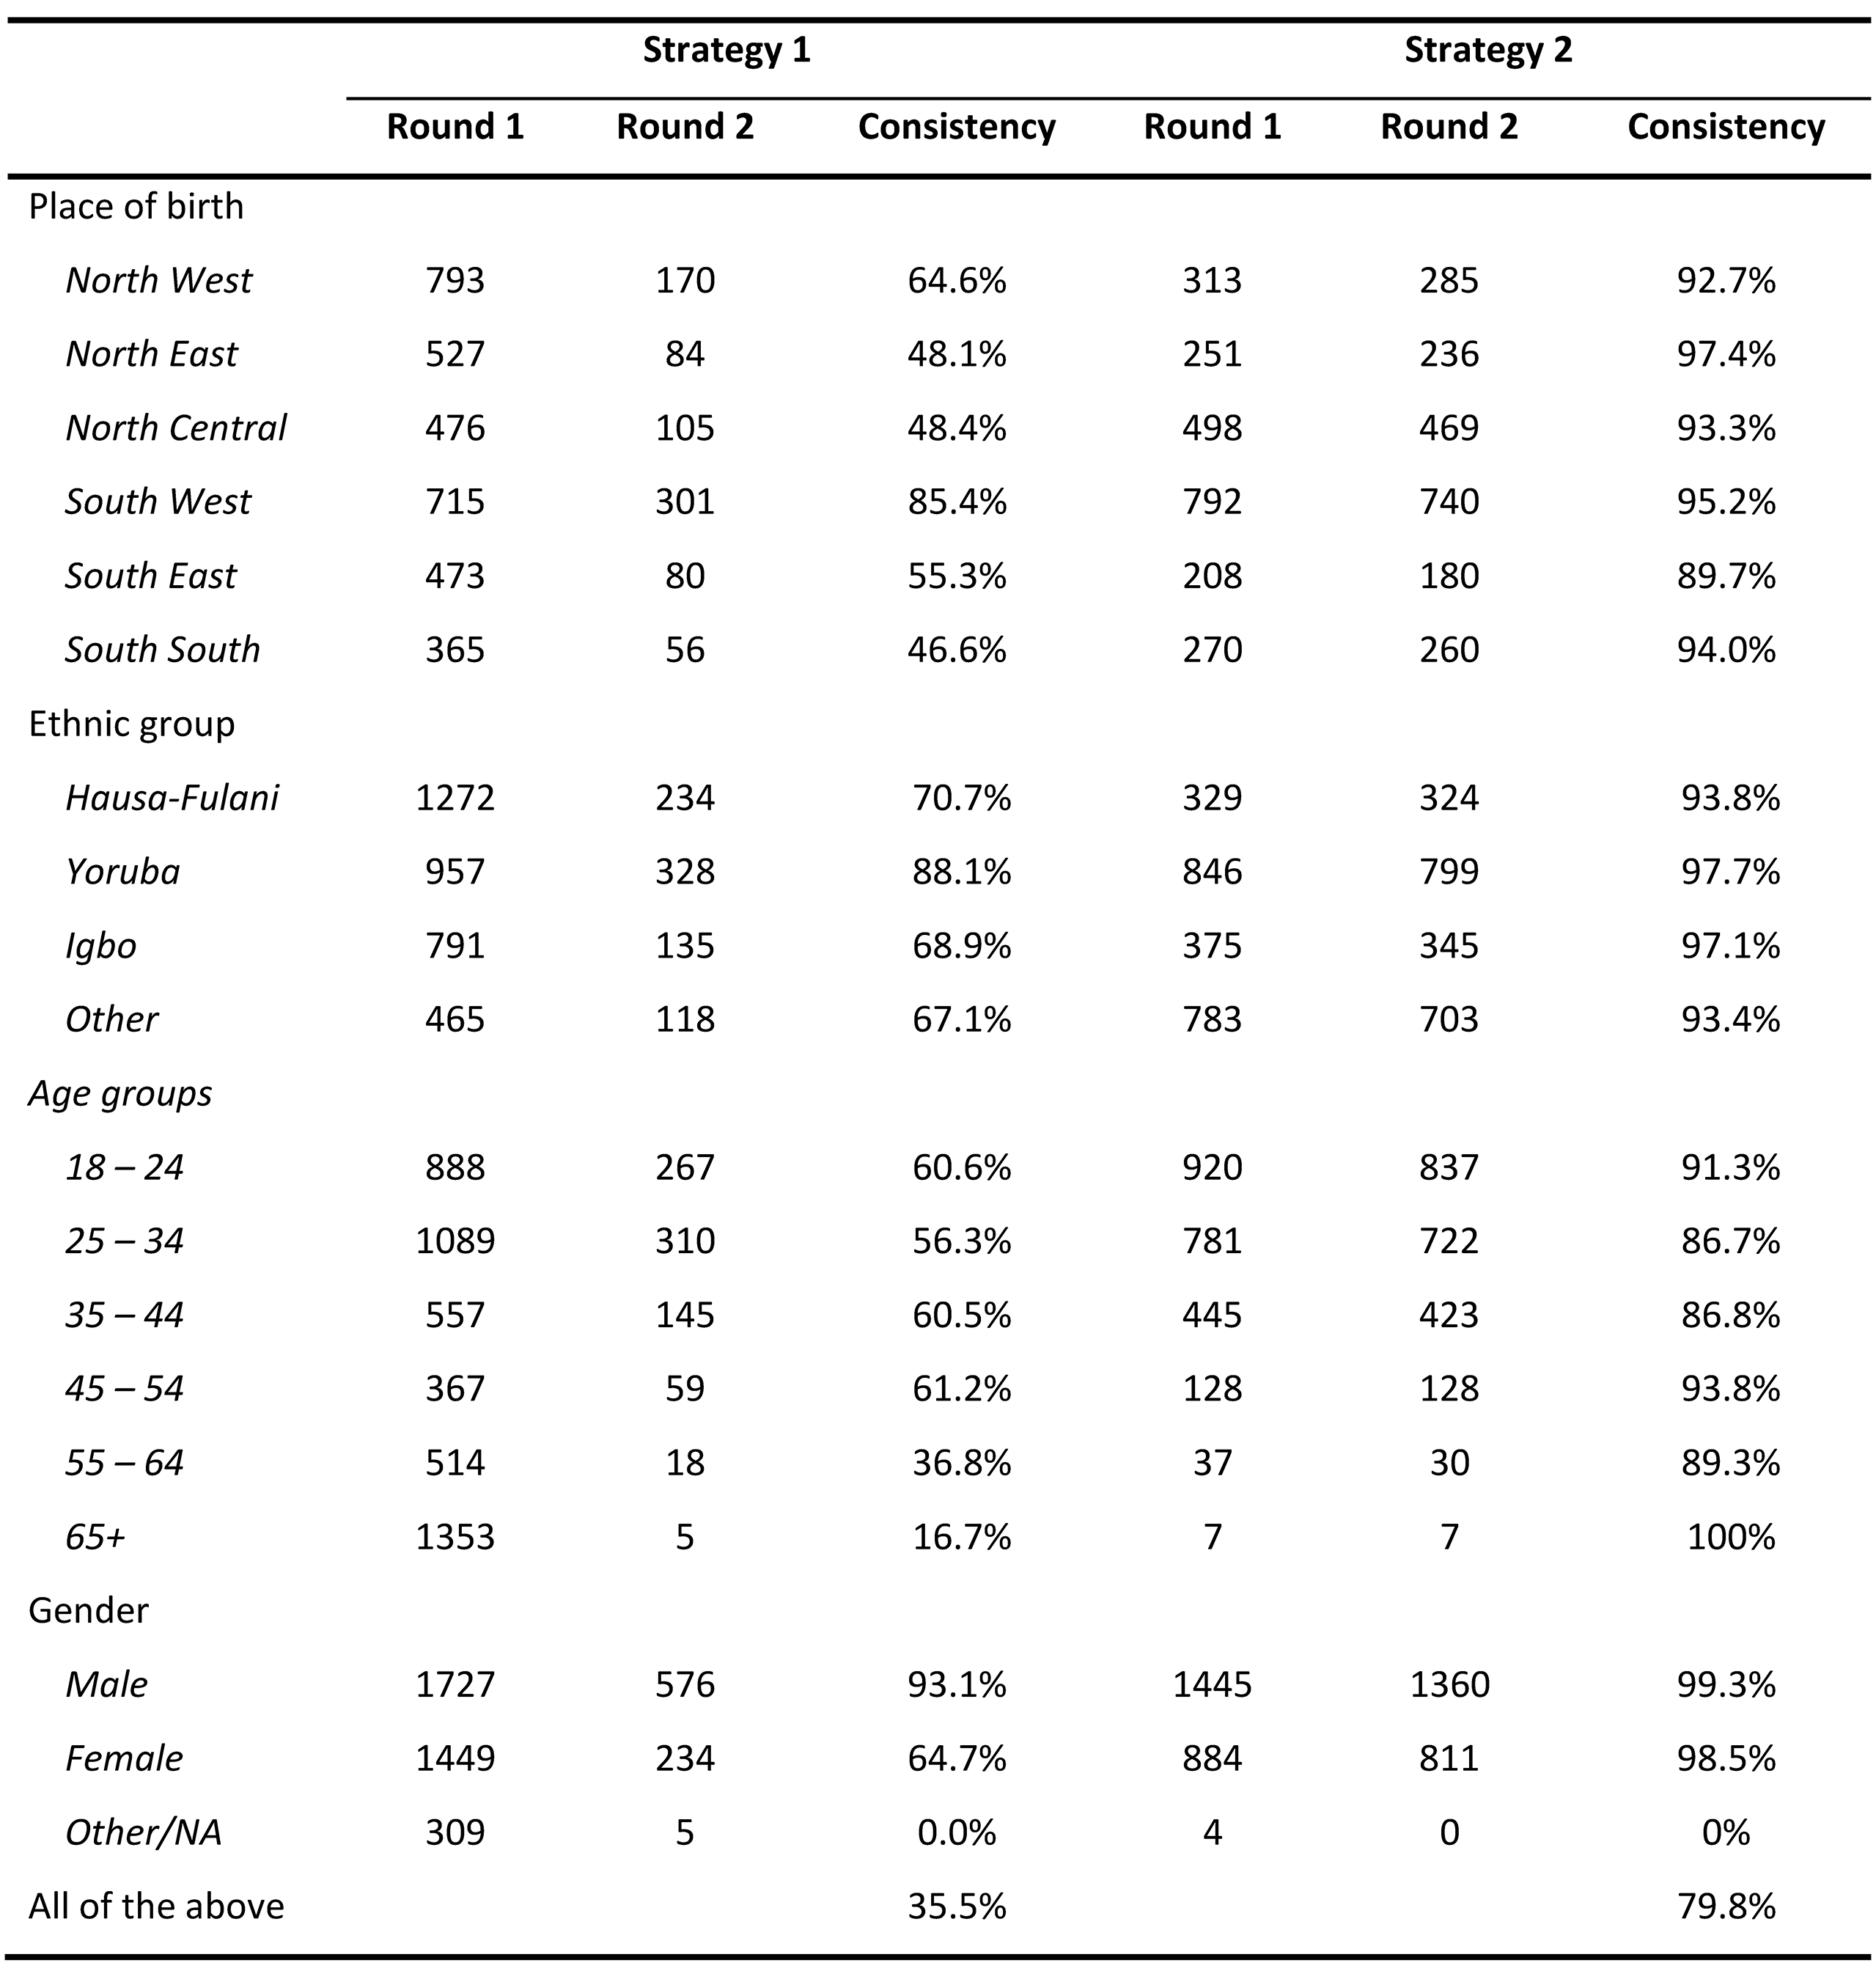
If we analyze the consistency of respondents’ self-reported state of birth at the geopolitical zone level, it emerges that a large proportion of respondents recruited via Strategy 1 provided inconsistent answers to this question between Round 1 and Round 2. Illustratively, among respondents who indicated they were born in a state falling within the South-South geopolitical zone in Round 1, only 46.6% of them gave the same response in Round 2. Respondents recruited via Strategy 2 were much more consistent when answering the question in which state they were born, with consistency levels well over 90% for all geopolitical zones (see Table 1). Interestingly, we found similar answer patterns for the questions regarding ethnic identity, age and gender. If we take a cumulative perspective and compare the proportion of respondents that gave consistent answers to all four background questions in both surveys (i.e., state of birth, ethnicity, age and gender), we found that only 35.5% of respondents recruited via Strategy 1 were fully consistent, while in our survey recruited via strategy 2 this percentage was 79.8%, a very noticeable improvement.
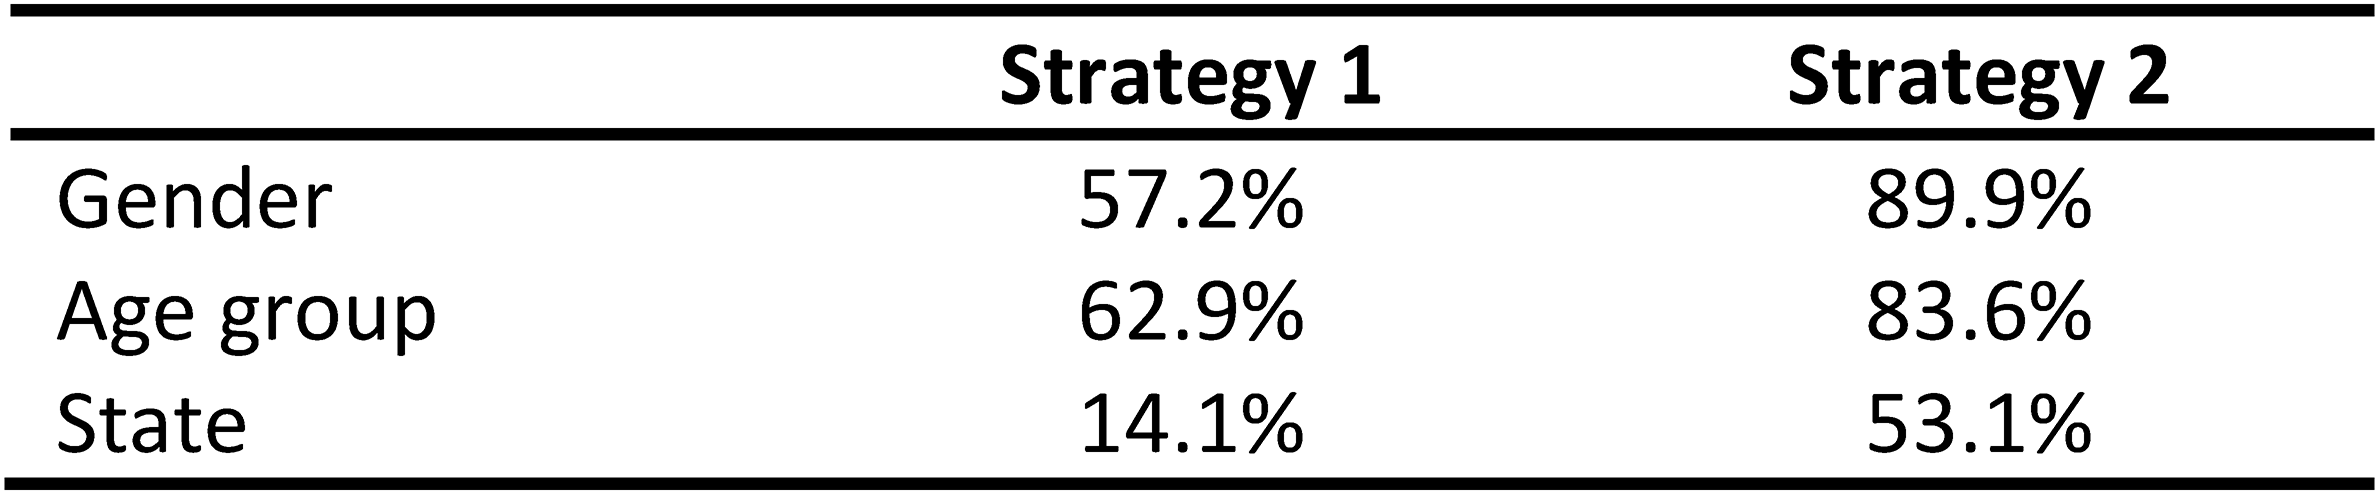
This clearly indicates that many respondents in the strategy 1 survey were untruthful about their demographic characteristics, while we are more confident in their responses to these questions in the strategy 2 survey. This can also be demonstrated by the extent to which the self-reported characteristics age, gender, and state of residence match the targeting of the ads that each respondent interacted with to access our survey. Thanks to the inclusion of URL parameters, we are able to compare this accuracy side-by-side (see Table 2). In strategy 1, we find that the self-reported demographic characteristics of the respondents often do not match the targeting of the ads. Only 57.2% of respondents clicked on an ad that was targeted at the gender they reportedly identified with. We find a similar mismatch for the respondents age group and a very high mismatch for their current state of residence. Only 14% of the respondents actually interacted with an ad that was targeted at residents of the state they were reportedly living in. In strategy 2, these metrics are much improved. The percentage of matches on the gender and age variable range between around 80% and 90% and for the state of residence is as high as 53.1%. This aligns well with the findings by Rosenzweig et al. (2020) that the accuracy of Facebook’s ad targeting generally performs well with respect to age and gender, but less so with respect to the respondents’ location of residence. In any case, the stark improvement between the two strategies reinforces our confidence that respondents in strategy 2 provided us with much more truthful demographic information.
Table 2: Accuracy of Facebook ad targeting
4. Conclusions
This paper provides detailed insights on the recruitment strategy of the Perceptions of Inequality and Redistribution Survey (PIRS), an online survey with quasi-cash incentives in Nigeria. We make a valuable contribution to the literature on Facebook as a recruitment tool for online surveys by showing how the quality of the data obtained can be greatly affected by the chosen recruitment strategy. The paper also provides important methodological and practical guidelines which can help to generate high-quality survey samples by means of a Facebook ad campaign. The changes we made between Strategy 1 and Strategy 2 proved very successful and had positive impacts on the attrition rate, time spent on the survey, the number of multiple submissions, the consistency of responses across multiple survey rounds, and convergent validity. Our paper also convincingly shows that survey recruitment via Facebook ads can be effective not only for generating cross-sectional data but also longitudinal panel data.
On the basis of our experience with the PIRS, we give three concrete pieces of advice to researchers who wish to use Facebook for generating a compensated online survey panel: (1) run a pilot campaign until all spending limitations are lifted before conducting the actual research, (2) ask interested users to register first and do not allow them to take the survey right away, and (3) use WhatsApp for contacting prospective respondents rather than text messages, which proved more expensive and unreliable. While these guidelines are based on our experience of conducting our survey in Nigeria, we think that these guidelines may be useful for conducting surveys in other countries as well, both LMICs and higher income countries.
[1] Ethical approval for this study was obtained from our University’s ethics committee (reference no. G-2022-5238-R3(AMD)).
Supplementary materials
References
- Beam, E. A. (2023). Social media as a recruitment and data collection tool: Experimental evidence on the relative effectiveness of web surveys and chatbots. Journal of Development Economics, 162, 103069.
- Grow, A., Perrotta, D., Del Fava, E., Cimentada, J., Rampazzo, F., Gil-Clavel, S., & Weber, I. (2022). Is Facebook’s advertising data accurate enough for use in social science research? Insights from a cross-national online survey. Journal of the Royal Statistical Society Series A: Statistics in Society, 185 (S2), S343-S363.
- Hoffmann Pham, K., Rampazzo, F., & Rosenzweig, L. R. (2019). Online Surveys and Digital Demography in the Developing World: Facebook Users in Kenya. http://arxiv.org/abs/1910.03448
- Langer, A., Meuleman, B., Oshodi, A. G. T., & Schroyens, M. (2017). Can student populations in developing countries be reached by online surveys? The case of the National Service Scheme Survey (N3S) in Ghana. Field Methods, 29(2), 154-170.
- National Bureau of Statistics. (2020). Demographic Statistics Bulletin. https://nigerianstat.gov.ng/download/1241121
- National Bureau of Statistics. (2021). Statistical Report on Women and Men in Nigeria. 2021_Statistical_Report_On_Women_and_Men.pdf
- Neundorf, A., & Öztürk. A. (2021). Recruiting Research Participants through Facebook Advertisements: A Handbook. https://doi.org/10.31219/osf.io/87rg3
- Neundorf, A., & Öztürk, A. (2023). How to improve representativeness and cost-effectiveness in samples recruited through meta: A comparison of advertisement tools. PLoS ONE, 18(2), e0281243.
- Pötzschke, S., & Braun, M. (2017). Migrant Sampling Using Facebook Advertisements: A Case Study of Polish Migrants in Four European Countries. Social Science Computer Review, 35(5), 633–653. https://doi.org/10.1177/0894439316666262
- Rosenzweig, L. R., Bergquist, P., Hoffmann Pham, K., Rampazzo, F., & Mildenberger, M. (2020). Survey sampling in the Global South using Facebook advertisements. DOI: doi.org/10.31235/osf.io/dka8f.
- Thomson, R., & Ito, N. (2014). Facebook advertisements for survey participant recruitment: considerations from a multi-national study. International Journal of Electronic Commerce Studies, 5(2), 199-218. Comparative Political Studies, 54(12), 2123-2154.
-
Keywords
calibration CATI coverage coverage bias cross-national surveys data linkage data quality European Social Survey experiment face-to-face face-to-face survey Facebook hard to reach populations incentives item nonresponse measurement measurement error mixed-mode surveys multitasking non-probability samples Nonresponse nonresponse bias nonresponse rates paradata PIAAC Probability sample probability samples QR codes rare populations response rate Satisficing social desirability Social media survey survey-taking climate survey data survey management survey methods Telephone survey telephone surveys total survey error unit nonresponse validity web survey Web surveys weighting
