

Who chooses a QR code over a URL to access a web screener in a national probability survey of older adults, and the impact on data quality
Andrew L. Hupp  University of Michigan, USA
Heather M. Schroeder University of Michigan, USA
Brady T. West University of Michigan, USA
Eva Leissou - University of Michigan, USA
David R. Weir University of Michigan, USA
Hupp A.L., Schroeder H.M., West B.T., Leissou E. & Weir D.R. (2025). Who chooses a QR code over a URL to access a web screener in a national probability survey of older adults, and the impact on data quality. Survey Methods: Insights from the Field. Retrieved from https://surveyinsights.org/?p=20208
© the authors 2025. This work is licensed under a Creative Commons Attribution 4.0 International License (CC BY 4.0) 
Abstract
There has been limited research on the impact of the inclusion of a quick response code (QR) code option on recruitment to a web screening survey, and on data quality when a screening instrument can be either self-administered or interviewer-administered. As part of a screening effort to recruit a new birth cohort to a long-standing panel study, an area probability sample of households was randomly assigned to one of two data collection protocols: web-first with in-person follow-up, or in-person first, with nonresponding cases followed up via the web. Both treatment arm protocols included a mailed letter, either as an invitation for the web-first arm or as a form of nonresponse follow-up for the in-person first arm. Each of the mailed letters included a QR code alongside a URL for accessing the web screener. We found that a majority of households chose to use the QR code to access the web screener. We also found that those who chose to use a QR code were under 45 than those who chose to use a URL. We did not observe any data quality differences between those who chose a QR code versus those who chose a URL.
Keywords
data quality, Health and Retirement Study, QR code, QR code choice, web screening survey
Acknowledgement
This work was supported by the National Institute on Aging of the National Institutes of Health [U01 AG009740] and the Social Security Administration. The study design and the analysis were not preregistered.
Copyright
© the authors 2025. This work is licensed under a Creative Commons Attribution 4.0 International License (CC BY 4.0)
Introduction
As survey response rates continue to decline and data collection costs continue to rise, researchers are under continuous pressure to look for innovative ways to combat those trends (Williams and Brick, 2018). One strategy researchers often introduce is a self-administered web option for respondents, either as the only mode, or in a mixed-mode design, which may be appealing to some sampled cases. Obtaining completed surveys from willing cases using self-administered web frees up resources for more challenging cases that require more expensive data collection modes that involve an interviewer, such as telephone or in-person. One way to invite households is via a push-to-web design (Dillman, 2017), implemented with a national address-based probability sample. Area probability-based sampling frames do not typically include email addresses; therefore, a mailed letter is generally used to invite a household (or “push” the household) to participate in a web survey. The mailed invitation letter usually includes a URL and login credentials that need to be entered into a web browser by the respondent to access the survey. Typing in a URL and login credentials, which can be error prone, can be considered burdensome and a barrier for participation for some respondents. One possible way to ease the burden of typing these in is by taking advantage of quick response (QR) codes.
Quick Response (QR) Codes in Surveys
QR codes have existed for decades. A QR code is a two-dimensional matrix barcode developed in 1994 by Denso Wave, a Toyota subsidiary, to track parts in vehicle manufacturing (Shin et al., 2012). A QR code encodes information, including text, a URL, or other data. QR code usage has increased in recent years, with expected growth in the future (eMarketer, 2022). Reasons for this increase are likely due to QR codes working seamlessly with native smartphone technology (i.e., the camera), and the increase in smartphone penetration, which was up to 91% in the U.S. in 2023 (Pew, 2024). The COVID-19 pandemic also increased QR code use (Davies et al., 2023; Gostin, 2021). Further, their ubiquity has broadened the context in which they are being used (Gostin, 2021). For example, they may be used to obtain information, access restaurant menus or bus schedules, recruit for jobs, enable digital payments, or facilitate survey research.
Researchers have considered the use of QR codes in the survey research context (AAPOR, 2014; Dillman, Smyth, and Christian, 2014; Faggiano and Carugo, 2020), and an increasing number of studies are reporting their actual use and subsequent impact on data collection. QR codes have been introduced in several studies and the overall response to their use has been mixed. Response rates for studies that introduce QR codes as a possible method for accessing a web survey have been in the low single digits for some studies, both pre-pandemic (Gluck, 2012; Allen, Marlar, and Steele, 2016; Lugtig and Luiten, 2021) and post-pandemic (Patrick et al., 2022; Endres et al., 2023). However, several studies that occurred after the pandemic report a higher response rate from their use (Leary et al., 2023, Olson and Ganshert, 2024). Even when the impact of QR codes on increasing response is low, the inclusion of a QR code still has a modest, but positive effect on the response rate (Endres et al., 2023, Marlar and Schreiner, 2024), and increases the proportion of web respondents who complete via a smartphone (Endres et al., 2023; Lugtig and Luiten, 2021; Olson and Ganshert, 2024).
The aforementioned literature suggests that including a QR code along with a URL may have benefits, but some studies report that having a QR code as the lone access method could be detrimental. Several studies show that when both a URL and QR code are included in an invitation, there are significantly more web completes (Marlar and Schreiner, 2024). Further, more respondents use a smartphone to complete the survey, with no observed negative effect on login or break-off rates (Lugtig and Luiten, 2021). One experimental study, conducted before the pandemic, found that when a QR code is the lone access method it led to significantly lower completion in a web survey (Allen, Marlar, and Steele, 2016). However, we note that QR code usage changed after the pandemic and this finding may be less relevant post-pandemic.
Some studies have reported heterogeneity of the impact of QR codes among demographic subgroups. Younger adults tend to prefer using QR codes (Allen, Marlar, and Steele, 2016; Endres et al., 2023; Leary et al., 2023; Lee et al., 2023; McDaniel et al., 2023), compared to their older counterparts who tend to prefer using a URL to access a survey. However, a more recent small usability pilot of those 55 and older found that all users were familiar with what a QR code was and how to use it, with half of them having previously used a QR code (Rivas and Schulzetenberg, 2023). In addition to age, QR codes seem to attract females (McDaniel et al., 2023), those who are not currently married (Endres et al., 2023), Hispanics (Lee et al., 2023; Marlar and Schreiner, 2024), and non-whites (Endres et al., 2023; Lee et al., 2023).
The previous research in this area has consistently focused on the effects of offering a QR code, but not necessarily on the actual use of QR codes. Our interest is to further this body of research by looking at the characteristics of those who used the QR code when it is offered alongside a URL. By using an additional parameter embedded on the URL string, we are able to determine when a QR code versus a URL was used.
We are not aware of any research on the impact of including a QR code in invitation materials on the quality of the data collected from the survey. However, a study that compares data quality between web screening and in-person screening found that web screening is a viable option for enumerating households in population surveys (Graber et al., 2022). Web screening generally identified the same persons as in-person screenings, and full names were provided in 95% of web cases, compared to 37% of in-person cases. We hypothesize that QR codes may push more people to the web, leading to increases in web response, resulting in better data quality.
Study Background
The analysis presented in this paper focuses on web screening data from the Health and Retirement Study (HRS) to add to this growing literature. The HRS (https://hrs.isr.umich.edu) is a longitudinal panel study that began in 1992 (Fisher and Ryan, 2018). It is a national sample of adults over 50 and their spouses in the United States. The HRS is conducted every other year with a national probability sample of approximately 20,000 men and women. Every six years a new birth cohort of adults aged 51 to 56 are recruited into the panel to replenish the sample and ensure national representation of adults over age 50. In 2022, in addition to recruiting the next six-year birth cohort (those born between 1966-1971), the HRS recruited Hispanic and Black/African Americans ages 57 and older (born prior to 1966) and identified households with an age eligible person for the next recruitment cycle in 2028 (those born between 1972-1977).
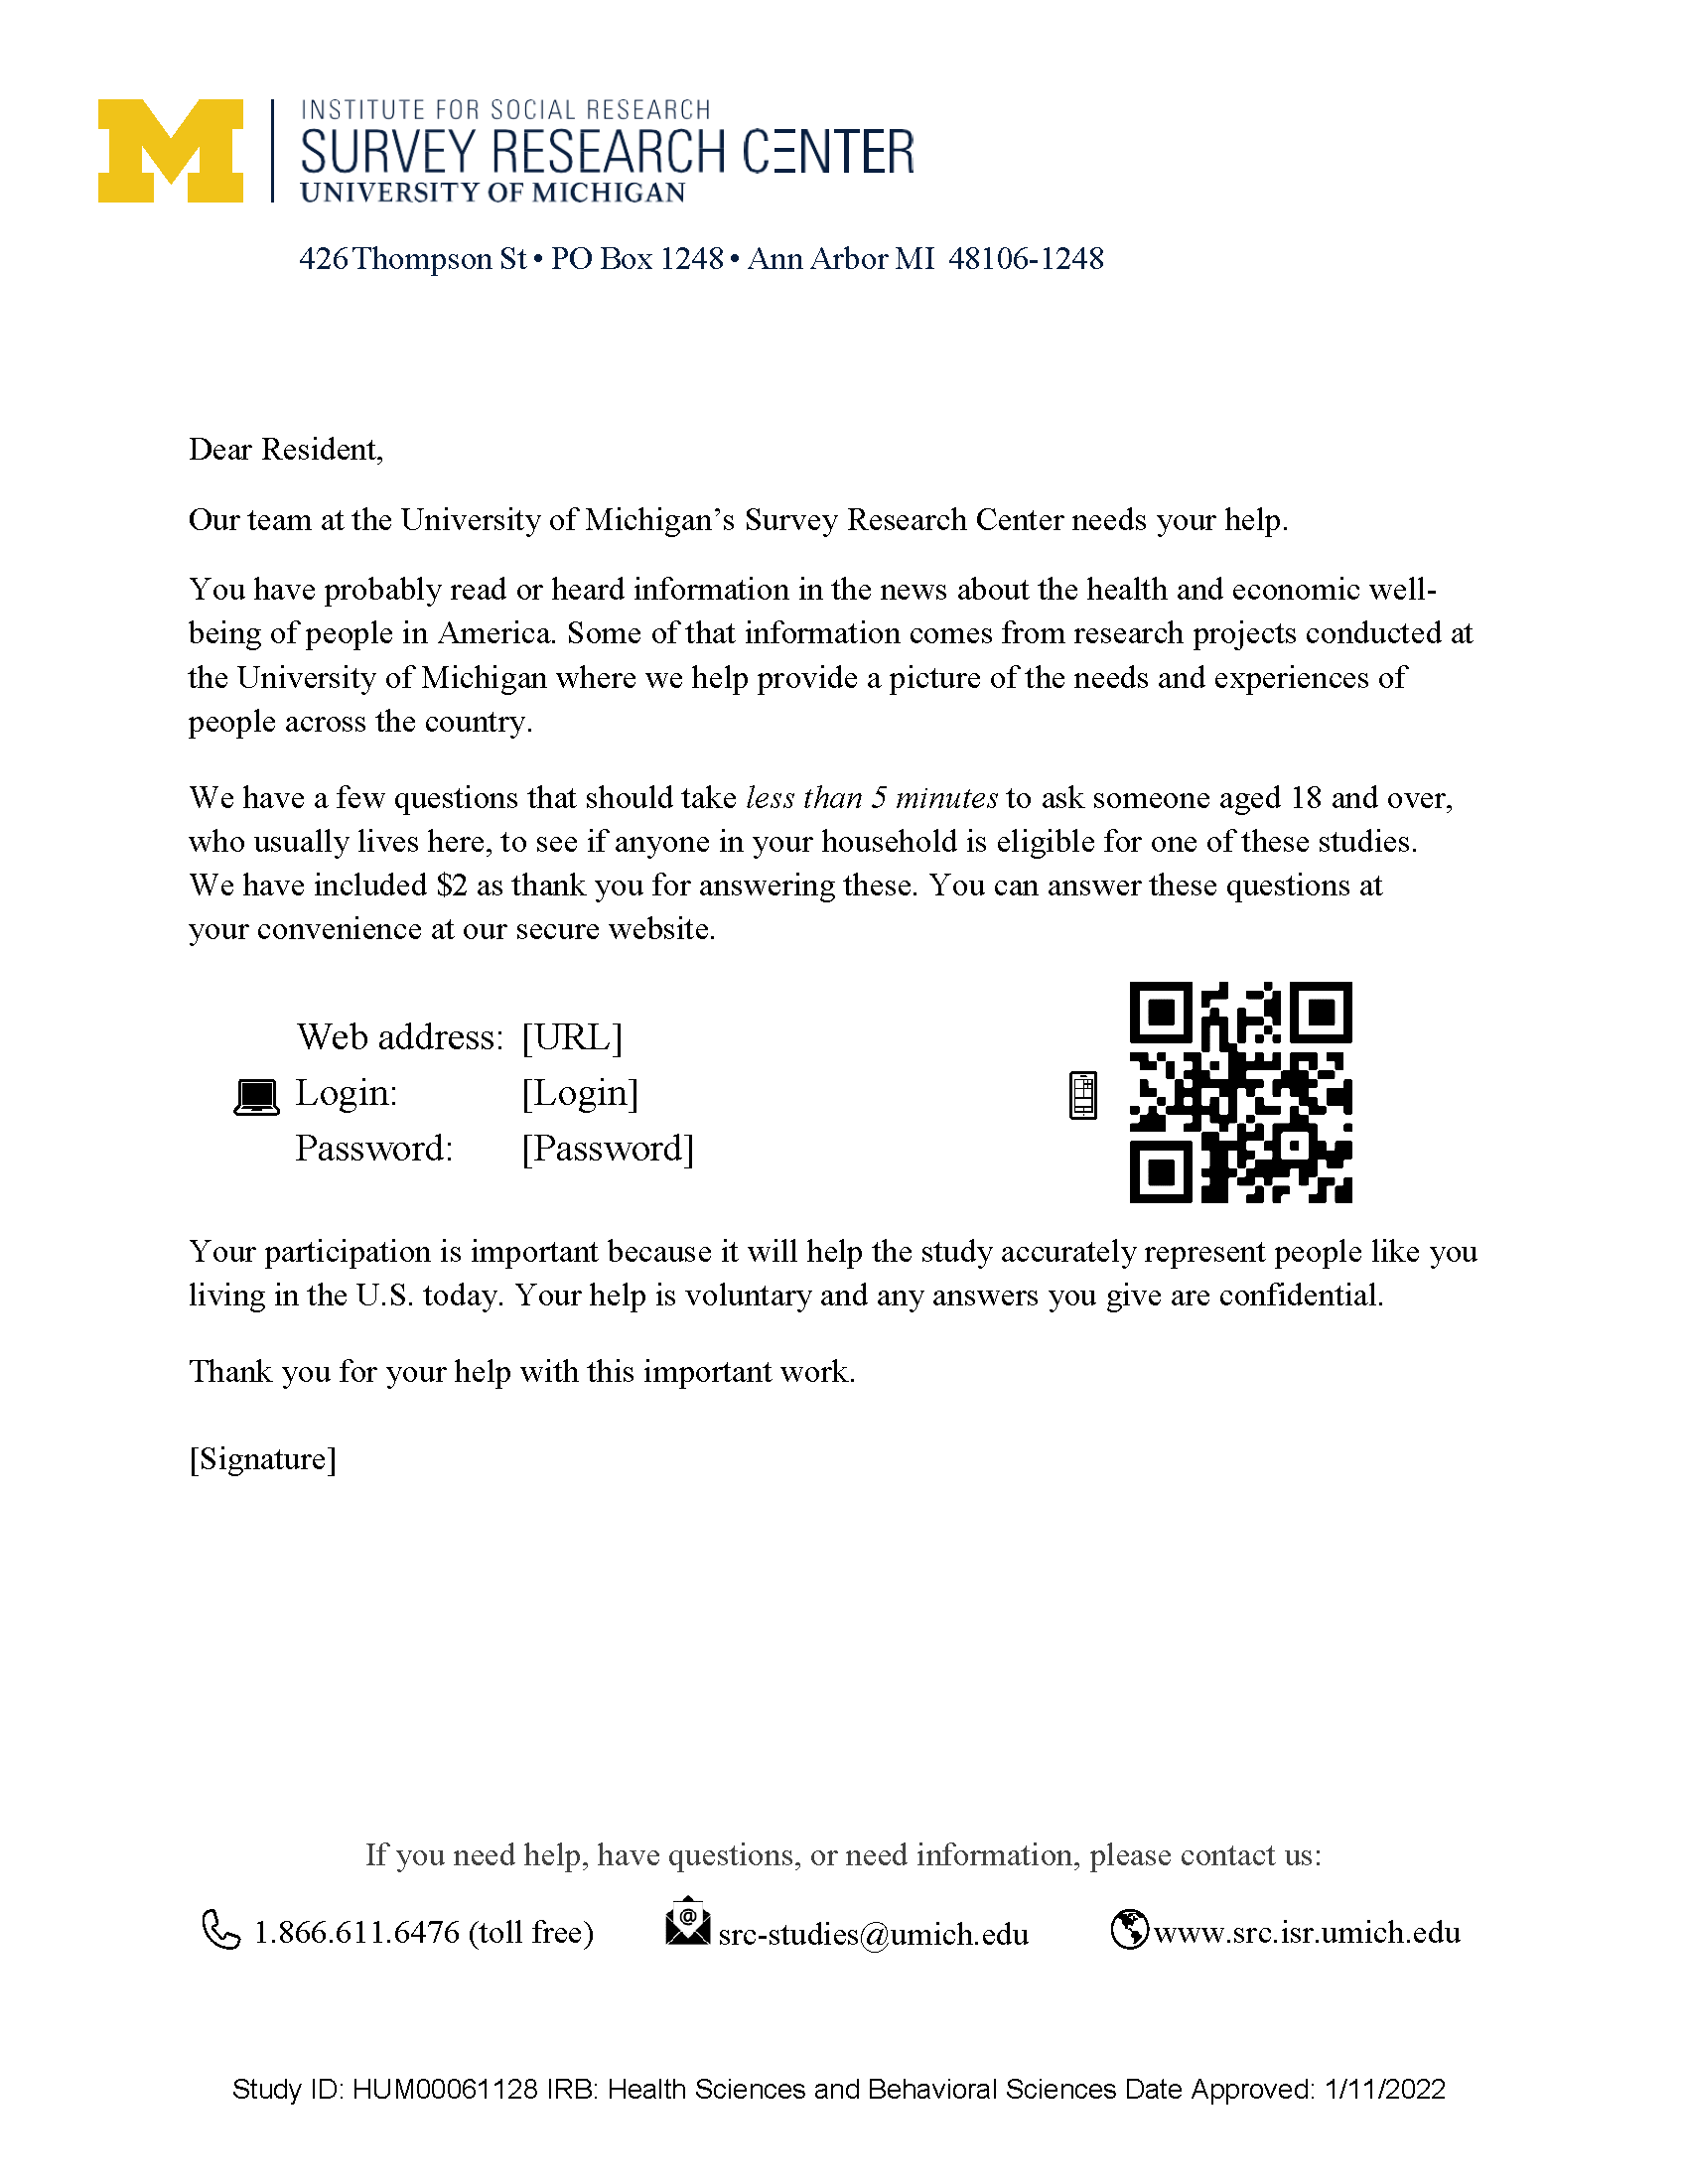
In this 2022 recruitment effort, households were randomly assigned to one of two data collection protocols: 1) web first with in-person follow-up with non-responding households, or 2) in-person first, with nonresponding cases being offered the web. Web first households were mailed an invitation packet containing a letter inviting them to complete a web screener via a URL with login credentials alongside a fully authenticated QR code (see Figure 1), a Survey Research Center brochure, and a two-dollar bill. Two weeks later, nonresponding households were sent a reminder packet. Four weeks later, nonresponding cases were followed up in-person by a field interviewer. The in-person first group received up to 10 interviewer-administered contact attempts. Non-responders were invited to the web screener and received a similar packet as the web first group, but without a two-dollar bill or brochure.
Figure 1: Example Web Invitation Letter
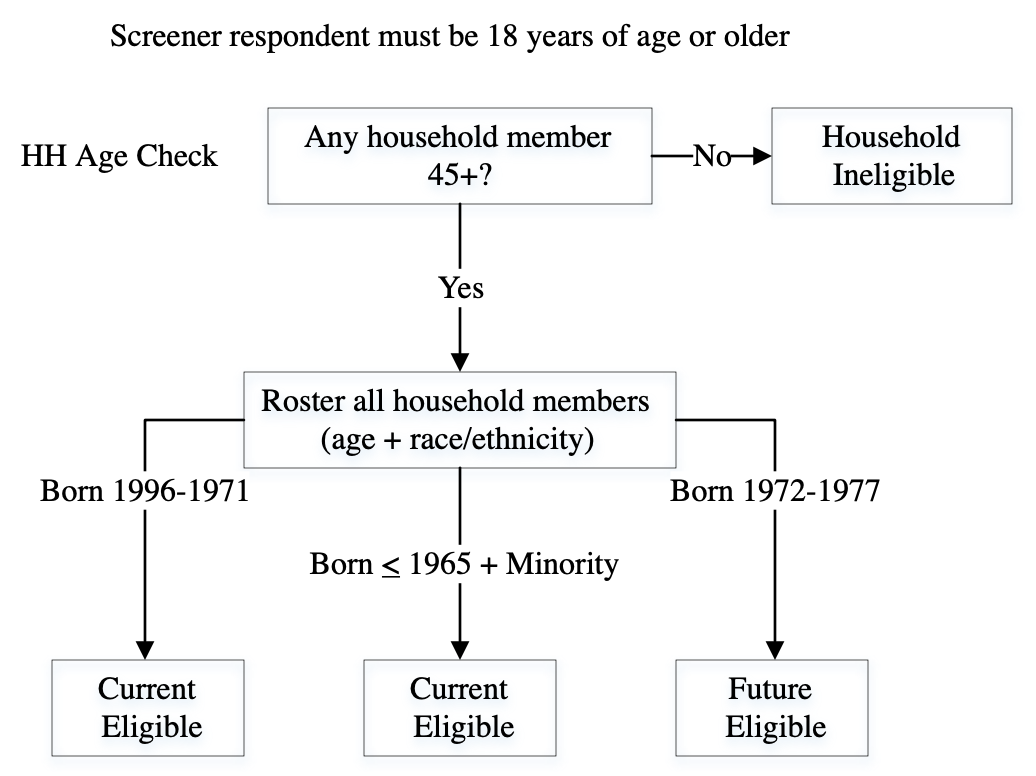
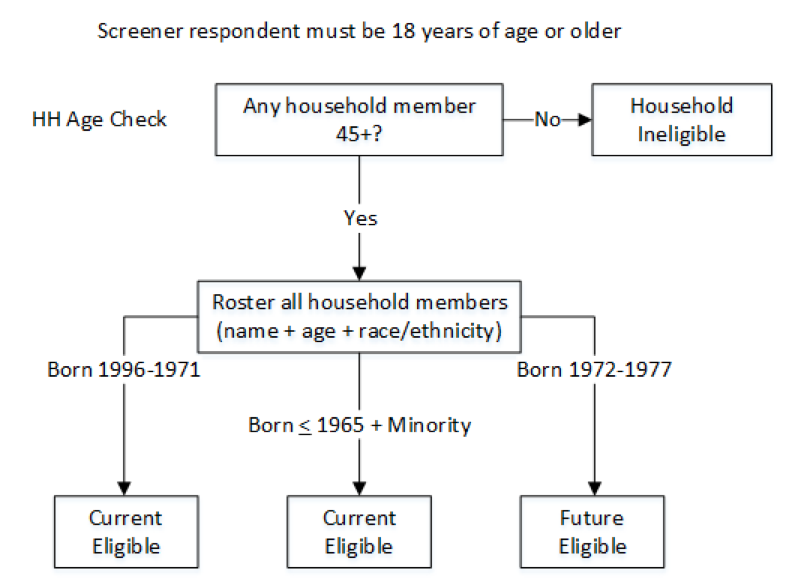
Households completed a short screening instrument programmed in Blaise (5.10.6). The screener asked a set of questions to determine eligibility and confirmed the screener respondent both lived at the selected address and was at least 18 years old. The screener then asked how many people in the household were 18-44, 45-59, and 60 and older. If everyone in the household was under the age of 45, then the screener was complete with no one identified as eligible (see Figure 2). If anyone in the household was 45 or older, then a household roster was collected that gathered detailed information about each person including their name, race, ethnicity, and year of birth to determine eligibility. Eligible individuals were then asked to complete an in-person baseline interview that was approximately 3 hours in length.
Figure 2: HRS Screening Eligibility Pathway
The introduction of the two options for accessing the web screener was not done experimentally. All mail-based communications included a URL alongside a QR code, therefore giving the potential screening respondent the choice of accessing the screener via the URL or the QR code. Therefore, this analysis is purely observational. While this work is not experimental, it offers valuable descriptive insight into what access methods different population subgroups prefer to use. We focus our investigation on the participation preferences among those who elected to screen in via the web.
Research Questions
This analysis seeks answers to the following research questions:
- Among screener respondents that participated via the web, how many chose to use the QR code to access the web screener?
- Among screener respondents that participated via the web, are there particular demographic subgroups that chose to use the QR code to access the web screener?
- Are there differences in screener data quality by access method (QR code vs URL) or mode (web vs. in-person)?
Methods
QR code implementation
The URL string underlying the QR code in the HRS screening invitation and reminder communications was a fully authenticated URL string containing an additional parameter that identified when a QR code had been used to access the screening instrument. Additionally, the QR code for each communication had a unique value for that parameter that allowed us to identify the communication (i.e., invitation or reminder) that was being used. The printing and mailing vendor was provided with the unique fully authenticated URLs and they generated the corresponding unique QR codes for each mailing.
Analytic methods
This analysis focuses on the first five sample releases of the HRS 2022 recruitment effort, and includes screening effort outcomes from April 2022 through August 2023. Our analytic dataset includes households invited to the web screener from both protocol treatment arms who were offered a QR code alongside a URL either in an invitation letter or a non-response follow up letter. We did a sensitivity analysis including only those cases in the web first protocol group and the results did not change because just a small number of cases come from the non-response letter. A total of 1,468 households completed a screener via the web instrument, and only 12 (0.8%) came from a non-response follow-up letter to the field first cases.
Our analyses use demographic information collected from screener respondents age 18 and older. Per HRS project protocols, the exact age and race/ethnicity of household members is not captured from screened households where all household members are 44 or younger. Therefore, race/ethnicity subgroup analyses are limited to households that include at least one person 45 or older. For percentages of QR code choice within race/ethnicity subgroups, age is dichotomized to screener respondents who are 18 – 56 or 57 and older to coincide with HRS-specific eligibility criteria. We use Pearson chi-square tests to test the association between dichotomized age and access method choice within race/ethnicity groups. For the data quality analyses we use two sided z-tests for difference in proportions to compare the incomplete/missing data percentages on first name, last name, year of birth, race, and ethnicity between QR code and URL users and between web and in-person modes. All analyses were conducted using SAS 9.4, and the analytic code can be found in the supplemental materials.
Results
Research Question 1: How many screener respondents chose to use the QR code to access the web screener?
There were 34,313 sampled households invited to complete the screening instrument to determine HRS household eligibility. A total of 26,841 of those were invited to complete the screener via the web. A total of 13,501 households (AAPOR RR1 = 39%) completed a screener. This includes 1,468 by web (11% of all completed screeners, and 5.5% of those invited to complete on the web). Focusing on the 1,468 that completed on the web, 917 (62%) accessed the web screener via a QR code and 551 (38%) via the URL. Overall, 3.4% of the 26,841 sampled cases completed the screener via a QR code, and 2.1% completed via a URL. Among the 917 who used the QR code, 85% used the QR code associated with the invitation letter, with the remaining 15% using the nonresponse follow-up letter.
Research Question 2: Are there particular demographic subgroups that chose to use the QR code to access the web screener?
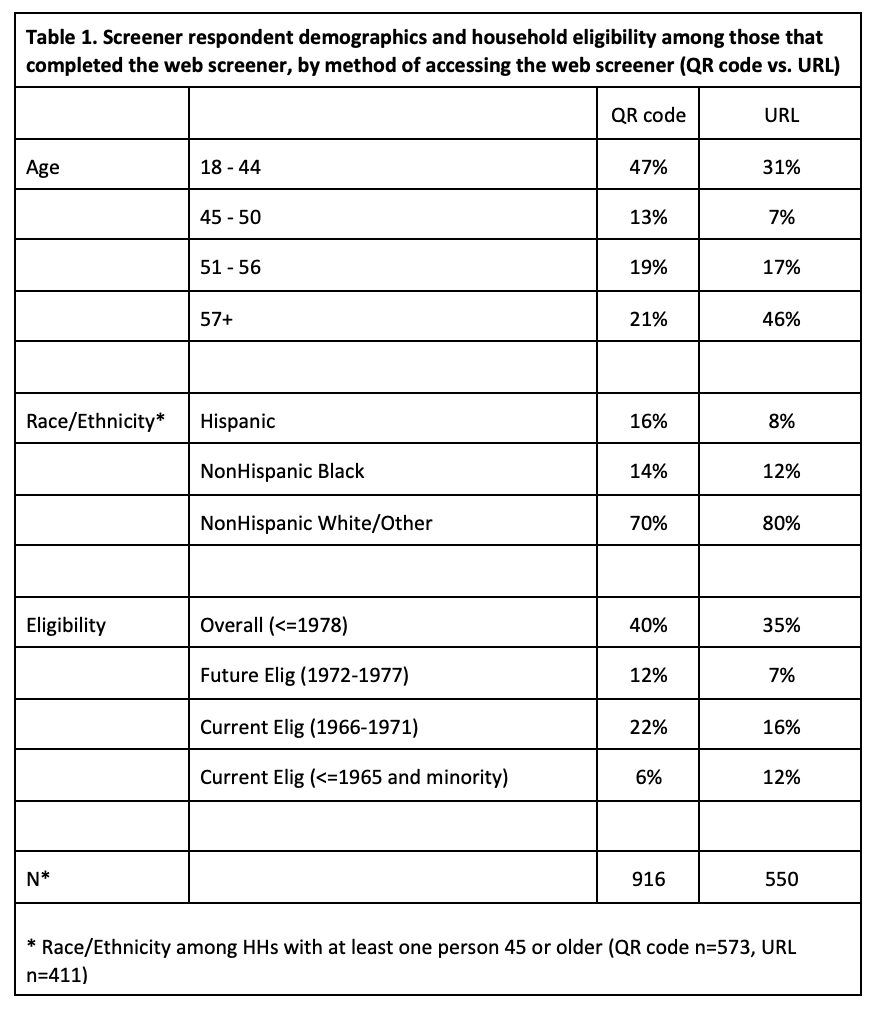
To minimize the time spent at households found to be ineligible for the 2022 HRS, households where all members are under the age of 45 are not asked to complete a full household roster. Among households that accessed the web screener via a QR code, 38% did not meet this initial eligibility criteria. Among households that accessed the web screener via a URL, this ineligibility rate was 25%.
Considering next those households with at least one person 45 or older, Table 1 shows that 47% of screener respondents who chose a QR code to complete the web screener are 18-44, and 21% are 57 or older. Among screener respondents that chose to access the web screener via a URL, 31% were 18-44 and 46% were 57 or older. A total of 16% of QR code users were Hispanic, and 8% of URL users were Hispanic.
Eligibility for the HRS relies on a combination of age and race/ethnicity. Overall, 40% of households were eligible for the HRS among those who chose to use a QR code, and 35% of households were HRS-eligible among those who chose to use a URL. Among those who chose to use a QR code, 12% are eligible for a future wave of HRS (born 1972-1977), 22% are eligible for the current wave (born 1966-1971) of HRS, and 6% are eligible for the current wave (born 1965 or before and minority). Among screener respondents who chose to use a URL, only 7% were eligible for a future wave, 16% for the current wave, and 12% for the current wave as older minorities.
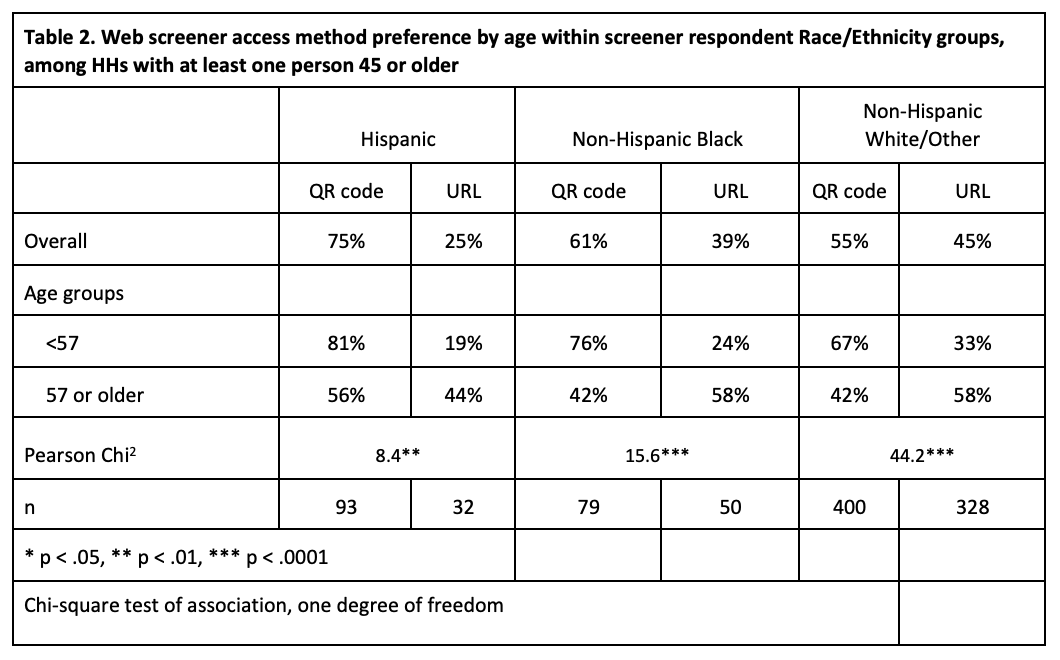
Looking within each race/ethnicity category in more detail, we see consistent overall patterns among web screener respondents. A total of 75% of Hispanics, 61% of non-Hispanic Blacks, and 55% of non-Hispanic White/Others chose a QR code to access the web screener; see Table 2. When we look within race/ethnicity groups, the overall preference for QR codes is driven by the younger members of the group. Among Hispanic screener respondents, 81% aged 56 and younger chose to use a QR code, compared to 56% of those 57 and older (Pearson chi-square=8.4, p < .01). Among non-Hispanic Black screener respondents, 76% aged 56 and younger chose to use a QR code, compared to 42% of those 57 and older (Pearson chi-square=15.6, p < .0001). Among non-Hispanic White/Other screener respondents, 67% aged 56 and younger chose to use a QR code, compared to 42% of those 57 and older (Pearson chi-square=44.2, p < .0001).
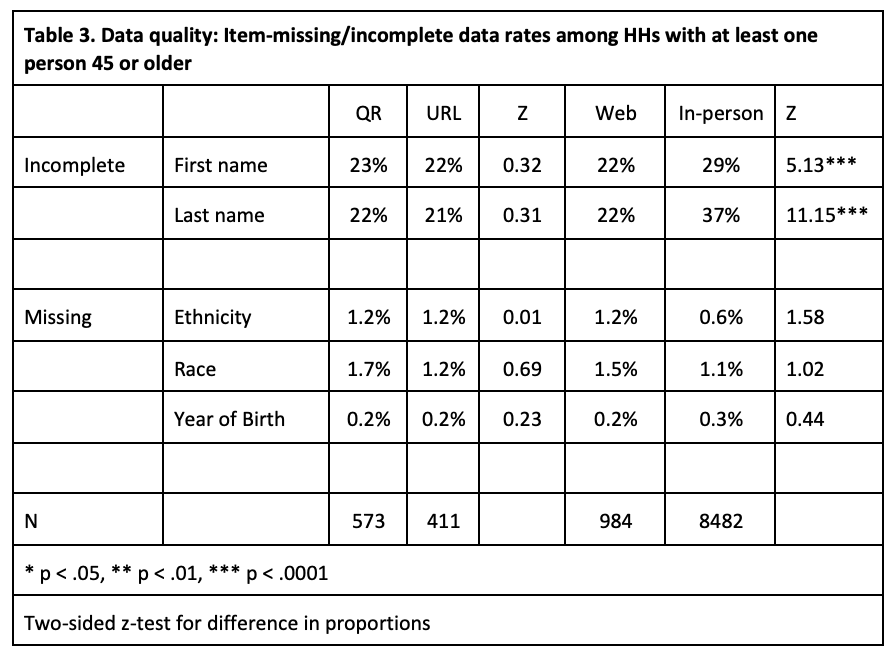
Research Question 3: Are there differences in screener data quality by access method (QR code vs. URL) or mode (web vs. in-person)?
We did not observe any significant differences in any of the data quality metrics we looked at between the QR code and URL access methods; see Table 3. We see significantly higher rates of incomplete name data (first and last) when the screener is administered by an interviewer in-person. The first name is incomplete 29% of the time when the screening is done in-person, compared to 22.2% (z=5.13, p < .01) of the time on the web. The last name is incomplete 37% of the time when the screening is done in-person, compared to 21.7% of the time on the web (z=11.15, p < .0001). The collection of ethnicity, race, and year of birth was consistent in terms of item-missing data across all access methods and modes.
Discussion
When sampled cases for the 2022 HRS were invited to complete a screening instrument online and presented with a QR code alongside a URL, more cases chose to use a QR code to access the web screener. Since QR codes were not experimentally introduced, we cannot make direct comparisons of response rates engendered by these access methods. However, this analysis offers valuable descriptive insight into what different age and race/ethnicity subgroups chose to use the QR codes to access the web screener. About half of those who chose to use a QR code were in our youngest (18-44) age group, although we saw usage in all age groups, with at least one QR code user over the age of 90.
Similar to what Lee et al. (2023) and Marlar and Schreiner et al. (2024) found, we found that Hispanics preferred to use QR codes across all age groups. This preference may be attributable to the 20% of Hispanic U.S. adults who are smartphone dependent (i.e., they have a smartphone but do not have home broadband), which is second only to Black U.S. adults at 21% (Pew, 2024), leaving their smartphone as their major means of regularly accessing the Internet. Regardless of the reason, this is an important finding as Hispanics and other minorities are often underrepresented in research, and lowering the barriers for their participation is beneficial.
Most importantly from this analysis, we found that data quality of the self-administered web screener was equivalent or better than an interviewer-administered in-person screener. Given that an interviewer needs to follow-up with any eligible cases from a web screener, we were happy to see that the data quality seems to be as good or better when the screener is completed via the web. Having just as much or more information to follow-up with during the first in-person visit for the baseline interview will hopefully make the interviewers’ jobs easier. Furthermore, if the inclusion of QR codes helps to increase the percentage of sampled cases responding by web, there may be data quality benefits overall introduced by providing this access option.
A primary limitation of our study is that we did not offer a QR code experimentally. Everyone invited to complete the web screener was able to choose between the URL and the QR code. While this may provide some insight into who prefers different access methods, it does not allow for formal comparisons between the two access methods. As noted earlier, researchers are including QR codes as an access method for their surveys more frequently, and having insight into how they are implemented and used is valuable. QR codes are an inexpensive, easy way of making it more convenient to access a survey, but QR codes do have potential downsides. They can be used for quishing (i.e., QR code phishing), or they can be a barrier to participation for those without a device that can read or interpret them. Those who chose to use a QR code will also be using mobile devices, so a researcher will need to make sure their surveys are optimized for viewing on smaller screens. Future research into QR code implementation and usage is needed to determine the optimal way in which to maximize their potential benefit.
References
- Allen, L., Marlar, J., and Steele, E. (2016). QR Codes for Survey Access: Is It Worth It? Paper presented at the 71st Annual Meeting of the American Association for Public Opinion Research, Austin, TX.
- American Association for Public Opinion Research (2014). Mobile Technologies for Conducting, Augmenting and Potentially Replacing Surveys: Report of the AAPOR Task Force on Emerging Technologies in Public Opinion Research, AAPOR. https://aapor.org/wp-content/uploads/2022/11/REVISED_Mobile_Technology_Report_Final_revised10June14.pdf
- Davies, H., Hjorth, L., Andrejevic, M., Richardson, I., and DeSouza, R. (2023). QR Codes During the Pandemic: Seamful Quotidian Placemaking, Convergence, 29(5), 1121–1135, https://doi.org/10.1177/13548565231160623
- Dillman, D., Smyth, J., and Christian, L. (2014). Internet, Phone, Mail and Mixed-Mode Surveys. The Tailored Design Method. (4th ed.) Wiley: Hoboken, New Jersey.
- Dillman, D.A. (2017). The promise and challenge of pushing respondents to the web in mixed-mode surveys. Survey Methodology, 43(1), 3-30.
- Endres, K., Heiden, E.O., Park, K., Losch, M.E., Harland, K.K., and Abbott, A.L. (2023). Experimenting With QR Codes and Envelope Size in Push-to-Web Surveys, Journal of Survey Statistics and Methodology, 00, 1–13, https://doi.org/10.1093/jssam/smad008
- eMarketer. (2022). Number of smartphone users in the United States who used a QR code scanner on their mobile devices from 2020 to 2025 (in millions). Statista. Statista Inc.. Accessed May 01, 2023. https://www.statista.com/statistics/1297768/us-smartphone-users-qr-scanner/aap
- Faggiano A., Carugo S. (2020). Can the implementation of electronic surveys with quick response (QR) codes be useful in the COVID-19 era? International Journal of Epidemiology, 49(5), 1732–1733. https://doi.org/10.1093/ije/dyaa170
- Fisher, G. G., and Ryan, L. H. (2018). Overview of the health and retirement study and introduction to the special issue. Work, aging and retirement, 4(1), 1-9. https://doi.org/10.1093/workar/wax032
- Gluck, A. (2012). Do Surveys That Are Completed on Mobile Devices Differ from Surveys Completed Online, Over the Phone, or via Mail? Paper presented at the 67th Annual Meeting of the American Association for Public Opinion Research, Orlando, FL.
- Gostin I. (2021). How the pandemic saved the QR code from extinction. Forbes. https://www.forbes.com/sites/forbescommunicationscouncil/2021/03/25/how-the-pandemic-saved-the-qr-code-from-extinction/?sh=337c615d6905
- Graber, J.E., Williams, D., and Clark, J. (2022). Comparability of in-person and web screening: Does mode affect what households reports?, PLOS One, 17(10), e0277017, https://doi.org/10.1371/journal.pone.0277017
- Leary, S., Pate, K., Schafer, B., Rizwan, J., and Langetieg, E. (2023). Can You Drive Response With a QR Code? An Experiment on a U.S. Government Web-Only Survey. Paper presented at the 78th Annual Meeting of the American Association for Public Opinion Research, Philadelphia, PA.
- Lee, N., Lewis, T., Scott, L., Prachand, N., Singh, M., and Matzke, H. (2023). The use of QR codes to increase rate of survey participation in a web survey. Paper presented at the 78th Annual Meeting of the American Association for Public Opinion Research, Philadelphia, PA.
- Lugtig, P., and Luiten, A. (2021). Do shorter stated survey length and inclusion of a QR code in an invitation letter lead to better response rates?. Survey Methods: Insights from the Field Retrieved from https://surveyinsights.org/?p=14216
- McDaniel, K., Carr, C., Jayaram, P., Suresh, R., and Guyer, H. (2023). Web Data Collection: Reviewing Device Preferences and the use of QR Codes on the Mental and Substance Use Disorders Prevalence Study (MDPS). Paper presented at the 78th Annual Meeting of the American Association for Public Opinion Research, Philadelphia, PA.
- Marlar, J., and Schreiner, J. (2024). The Use of QR Code to Encourage Participation in Mail Push-To-Web Surveys: An Evaluation of Experiments from 2015 and 2022. Journal of Survey Statistics and Methodology, smae0240(0). https://doi.org/10.1093/jssam/smae024
- Olson, K., and Ganshert, A. (2024). Remember, You Can Complete This Survey Online! Web Survey Links and QR Codes in a Mixed-Mode Web and Mail General Population Survey. Social Science Computer Review, 0(0). https://doi.org/10.1177/08944393241277553
- Patrick, M.E., Couper, M.P., Jang, B.J., Laetz, V.B., Schulenberg, J.E., O’Malley, P.M., and Johnston, L.D. (2022). A Sequential Mixed-Mode Experiment in the U.S. National Monitoring the Future Study, Journal of Survey Statistics and Methodology, 6(1), 72–97, https://doi.org/10.1093/jssam/smaa030
- Pew Research Center, January 2024, “Americans’ Use of Mobile Technology and Home Broadband”. https://www.pewresearch.org/internet/2024/01/31/americans-use-of-mobile-technology-and-home-broadband/
- Rivas, A. G., and Schulzetenberg, A. (2023). QR Codes as a Method for Older Adults to Access a Mobile Survey. In International Conference on Human-Computer Interaction (pp. 128-141). Cham: Springer Nature Switzerland. https://link.springer.com/chapter/10.1007/978-3-031-34866-2_10
- Shin, D.H., Jung, J., and Chang, B.H. (2012). The psychology behind QR codes: User experience perspective. Computers in Human Behavior, 28, 1417-1426. https://doi.org/10.1016/j.chb.2012.03.004.
- Williams, D., and Brick, J. M. (2018). Trends in US face-to-face household survey nonresponse and level of effort. Journal of Survey Statistics and Methodology, 6(2), 186-211. https://doi.org/10.1093/jssam/smx019
-
Keywords
calibration CATI coverage coverage bias cross-national surveys data linkage data quality European Social Survey experiment face-to-face face-to-face survey Facebook hard to reach populations incentives item nonresponse measurement measurement error mixed-mode surveys multitasking non-probability samples Nonresponse nonresponse bias nonresponse rates paradata PIAAC Probability sample probability samples QR codes rare populations response rate Satisficing social desirability Social media survey survey-taking climate survey data survey management survey methods Telephone survey telephone surveys total survey error unit nonresponse validity web survey Web surveys weighting
