

Do shorter stated survey length and inclusion of a QR code in an invitation letter lead to better response rates?
Lugtig, P. & Luiten, A. (2021). Do shorter stated survey length and inclusion of a QR code in an invitation letter lead to better response rates? Survey Methods: Insights from the Field. Retrieved from https://surveyinsights.org/?p=14216
© the authors 2021. This work is licensed under a Creative Commons Attribution 4.0 International License (CC BY 4.0) 
Abstract
Invitation letters to web surveys often contain information on how long it will take to complete a web survey. When the stated length in an invitation of a survey is short, it could help to convince respondents to participate in the survey. When it is long respondents may choose not to participate, and when the actual length is longer than the stated length there may be a risk of dropout. This paper reports on an Randomised Control Trial (RCT) conducted in a cross-sectional survey conducted in the Netherlands. The RCT included different version of the stated length of a survey and inclusion of a Quick Response (QR) code as ways to communicate to potential respondents that the survey was short or not. Results from the RCT show that there are no effects of the stated length on actual participation in the survey, nor do we find an effect on dropout. We do however find that inclusion of a QR code leads respondents to be more likely to use a smartphone, and find some evidence for a different composition of our respondent sample in terms of age.
Keywords
experiment, invitation letter, nonresponse rates, QR codes, Smartphones, survey length
Copyright
© the authors 2021. This work is licensed under a Creative Commons Attribution 4.0 International License (CC BY 4.0)
Introduction
Questionnaire design guidelines often state that questionnaires should not be too long and only contain questions that are relevant for the purpose of the survey (Converse & Presser 1986; Fowler, 1995). But when is a questionnaire too long for a respondent?
When a survey is interviewer-administered, respondents are often willing to participate in (very) long interviews (eg. Loosveldt & Beulens, 2013). In self-administered interviews, it is much easier for respondents to stop doing a survey than in interviewer-administered ones. Break-offs are a particular problem in web surveys, mostly because it is very easy to close a Web browser (Peytchev 2009).
The fact that web surveys are now often completed on mobile devices pressures survey designers to further shorten questionnaires. The survey experience on mobile devices is often suboptimal, and because mobile phones are mostly used for short tasks in everyday life, there is perhaps an implicit assumption among respondents that mobile web surveys should be even shorter than traditional web surveys. There is evidence for increased breakoff rates when a survey is completed on a mobile device (Mavletova & Couper, 2015; Roberts & Bakker, 2018).
Many respondents would like to know how long a survey will take before they take a decision to participate (Groves & Couper, 2012). For this reason, invitation letters or e-mails often contain information on how long a questionnaire is estimated to complete. The idea here is that respondents make a decision to participate in the survey or not depending on several ‘leverage’ factors such as the topic of the survey, the time it will take to complete the survey, and how easy it is to participate. These factors can be given more or less ‘saliency’ in the request to participate (Groves, Singer & Corning, 2000). All other things equal, we would expect that a shorter stated survey length will lead to more respondents participating in the survey, as the survey will take less time and effort. The actual survey length will in turn affect whether respondents will complete the survey or break off. The stated length should correspond more or less with the actual length, as respondents have been shown to dropout quickly when a survey takes longer than what was promised (Yan et al., 2011).
Past research has explored two approaches for finding out how long web surveys should be in order to achieve high response rates and avoid dropouts. Revilla and Ochoa (2017) simply asked respondents how long web questionnaires should be. According to them, the optimal length was about 10 minutes, and the maximum length 20 minutes. Kelly et al. (2013) asked the same question to respondents of an American online panel, and found that 90% of respondents would do a survey of 10 minutes on a PC, but only 35% would do the same survey on a smartphone.
Apart from directly asking respondents what length they prefer, a second way to find out acceptable and optimal survey lengths is to use experiments. Generally, experiments find that the shorter the stated length of a survey in an invitation letter the higher the response, but effects are not very large. Edwards et al (2009) analysed several experiments in health sciences (both web and mail) and found an average odds ratio of 1.64 for a short vs. long announced length on response rates. Marcus et al (2007) find a 12% difference in response rates between an (announced) short and long survey among website owners. Kaplowitz et al (2012) find a more modest 6% difference in response rates when a survey is announced as being 10 vs. 30 minutes. Galesic & Bosnjak (2009) test e-mail invitations which announce the survey to be 10, 20 or 30 minutes, and find the response rate to be 75% in the 10-minute version, 65% in the 20-minute version and 62% in the 30 minute one. Liu & Wronski (2018) use nonexperimental evidence from more than 25,000 SurveyMonkey web surveys, and find a response rate of about 90% when surveys contain ten questions, and 80% when they contain 55 questions.
Not all studies find higher response rates for surveys with shorter stated survey lengths. Mavletova, Deviatko and Maloshokov (2014) find no effect. Heerwegh and Loosveldt (2006) argue that it may be better to avoid stating a specific length in the survey invitation at all, especially when the survey is long. It could be better to embed the stated length within a general statement showing the survey was designed carefully (e.g. “we have done our best to make this survey as short as possible”). In their study, they found no difference for such a vague vs. a specific (“20-25 minutes”) statement however.
Many of the experimental studies investigating the effect of stated survey length on response rates and break-off have included other leverage-saliency factors relevant to the survey invitation in their designs. For example, the subject line (Kaplowitz et al. 2012), whether personalization is used (eg. Heerwegh & Loosveldt, 2006; Luiten, 2011) or progress feedback (Galesic & Bosnjak, 2009; Yan et al, 2010). In this study, which reports on an experimental study from the Netherlands, we are interested in another factor that we cross with survey length: the use of Quick Response (QR) codes. These are small two-dimensional barcodes that can be printed on the invitation letter, and when scanned with a smartphone or tablet camera will directly lead to the website where the questionnaire is hosted. Previous research suggested that including a QR code could actually be detrimental for response however (Smith 2017). Marlar (2018) found no effect of using a QR code on response rates. We hypothesize however that the inclusion of QR codes may serve as a sign to respondents that the survey is smartphone-friendly, and invoke the anticipation that the survey duration is short, especially when combined with a statement on survey length.
The web response rates of younger persons (16 to 30 years old) in surveys conducted by Statistics Netherlands (CBS) lags about 10 percentage points behind those of the group with the highest response rates: middle-aged persons (45 to 65 years old). Although Revilla and Ochoa (2017) found 10 minutes to be the optimal length, qualitative research with groups of young persons at Statistics Netherlands indicated that 5 minutes would be more attractive for younger people. Moreover, in 2018, about 20% of all web responses at Statistics Netherlands was completed with the smartphone. This proportion is about 30% for young respondents. Little is known of the effects of combining a QR code with different stated survey lengths in the invitation letter. We hypothesize that a QR code, combined with stated length that the survey is short may lead respondents to be keener to participate generally, and more likely to use a smartphone. We expect a stronger effect for young people as they are generally more likely to use a smartphone for surveys.
Method
An experiment was performed in the survey of consumer sentiments (SCS). This is a cross-sectional survey conducted monthly by Statistics Netherlands (SN) to estimate consumer confidence in the Dutch economy. This survey has a median duration of eight minutes. The population of the study consists of persons of 16 year and older who live in the Netherlands. For SCS, a monthly two-stage self-weighting cluster sample is drawn from the Dutch population register. The SCS has a web – CATI sequential mixed mode design, but in this study we are only using data from the web-part of the study. A personalized invitation letter that includes a URL, login code and password for the web questionnaire is sent to every sample member. An example of the invitation letter can be found in Appendix A.
The default SCS design is to use a QR code and mention ‘a short questionnaire’ in the invitation letter along with a lottery incentive of iPads. Two reminder letters are sent. For the experiment, the regular invitation letter was changed experimentally in two ways. There were four experimental time conditions: ‘5 minutes’ (a few minutes shorter than the actual length), ’10 minutes’ (a few minutes longer than the actual length), ‘a short questionnaire (default)’, or no time indication. The latter condition is SN’s operational procedure for longer surveys. The web-part of the regular SCS served as control group and was therefore larger in size. A second experiment with QR codes experiment was crossed with the Time conditions: the invitation letter either showed a QR code (default in SCS) or the QR code was left out. The lottery incentive of iPads was included in all experimental conditions.
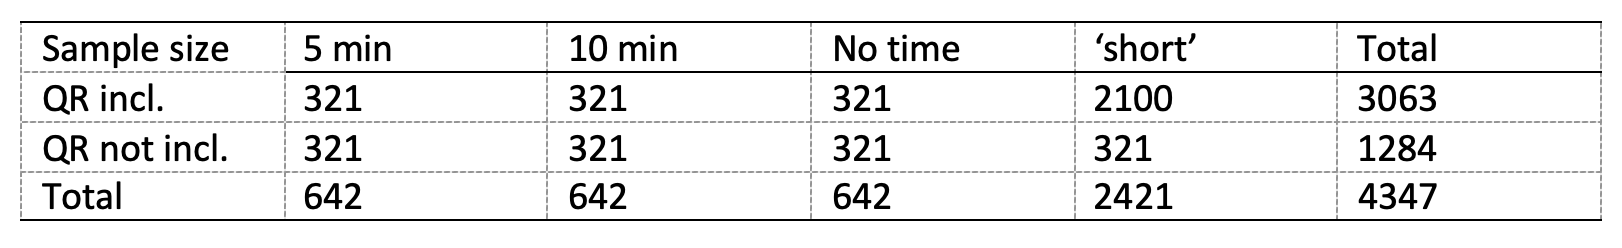
The monthly SCS sample contains 2100 individuals. In parallel to the regular survey, the experimental sample contained 2247 individuals, and was split across the remaining 7 conditions to achieve a factorial design. The sample sizes per experimental condition amount to 2247/7 = 321 (see Table 1).
Table 1. Sample sizes and experimental assignment to QR and Time conditions in invitation letter
Our analyses will focus on the effects of the Time and QR-code experiments separately for three outcome measures:
- the percentage of sample units starting the questionnaire,
- the percentage of respondents starting the survey, but breaking off, and
- the total completion rate.
In addition, we will analyze what device people use to complete the survey in relation to Time and QR conditions, and we will study age effects for the experimental effect on response rates. We are using register data on age for every sample member, split into 4 groups: those <30 years, between 30-44, between 45 and 65, and those >65. These age categories are frequently used by Statistics Netherlands, and earlier studies have shown that device use in survey differs across these age categories (Haan et al, 2019, Maslovskaya et al., 2019).
Results
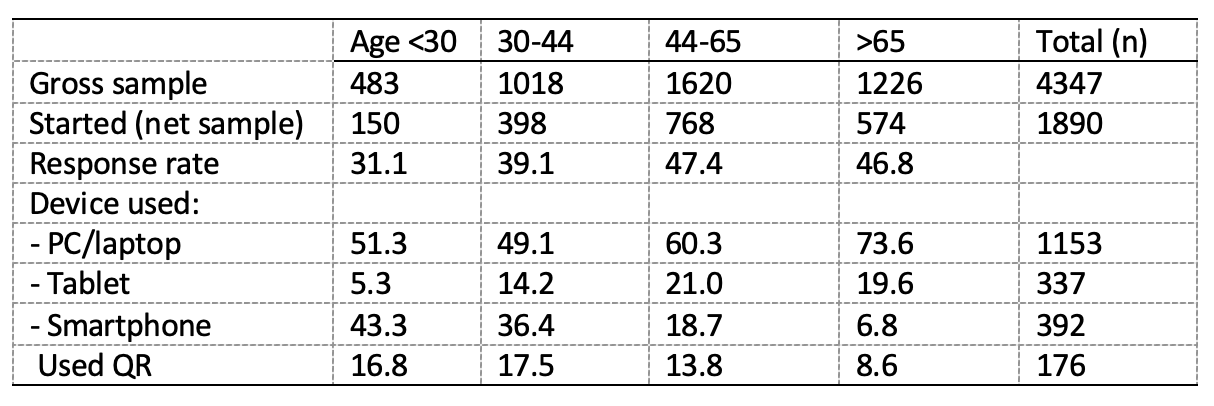
Table 2 shows the device respondents used to start the survey, as well as whether respondents used a QR code to access the survey, split by age group. We find that younger people are more likely to start the survey on a smartphone. The oldest age group (>65) is not likely to use smartphone at all. The QR code is used by 12.2% of all respondents, implying that about 88% type in the URL[1]. Both tablet and smartphone respondents can use a QR code to login to the survey, and we find that for smartphone and tablet respondents, about one in three actually used a QR code to access the survey.
Table 2. Participants Smartphone use by age, Time and QR code
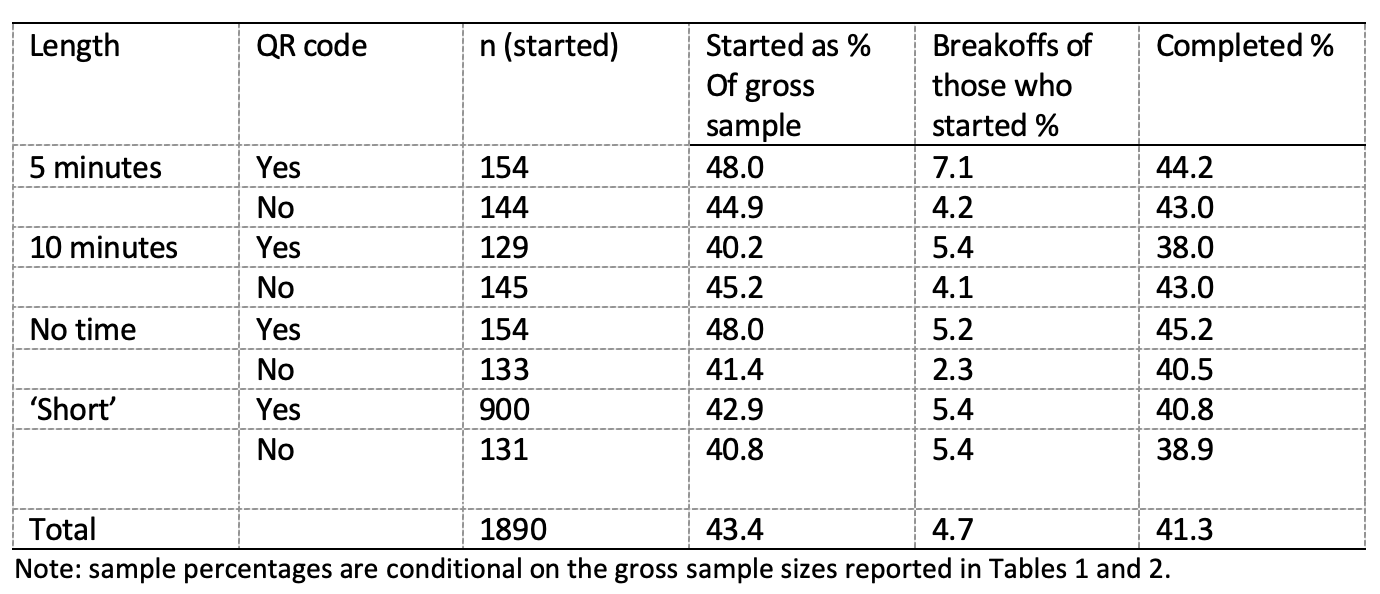
For an evaluation of our experiment, we turn to table 3. This table shows the percentage of sampled individuals starting the questionnaire, the percentage of respondents who broke off prematurely, and the percentage of respondents completing the survey by Time and QR conditions. Overall, we find that 43.4% of the sample starts the questionnaire. There appear to be small differences between the login rates in the factor Time (5 minutes: 46% 10 minutes: 43%, no time: 45%, short: 43% ), but there is no significant difference (χ2(3) = 3.60, p =.31), nor do we find an effect of Time on dropout (5 minutes: 6%, 10 minutes: 5%, no time: 4%, short: 5% ). There is no effect of the QR-code on the login rate either (yes: 44%, no: 43%, χ2(1) = 0.10, p =.75).
Analyses of the experiment: do stated length and QR codes matter?
Table 3. Percentage of sampled persons starting, breaking off and completing the web questionnaire by Time and QR condition
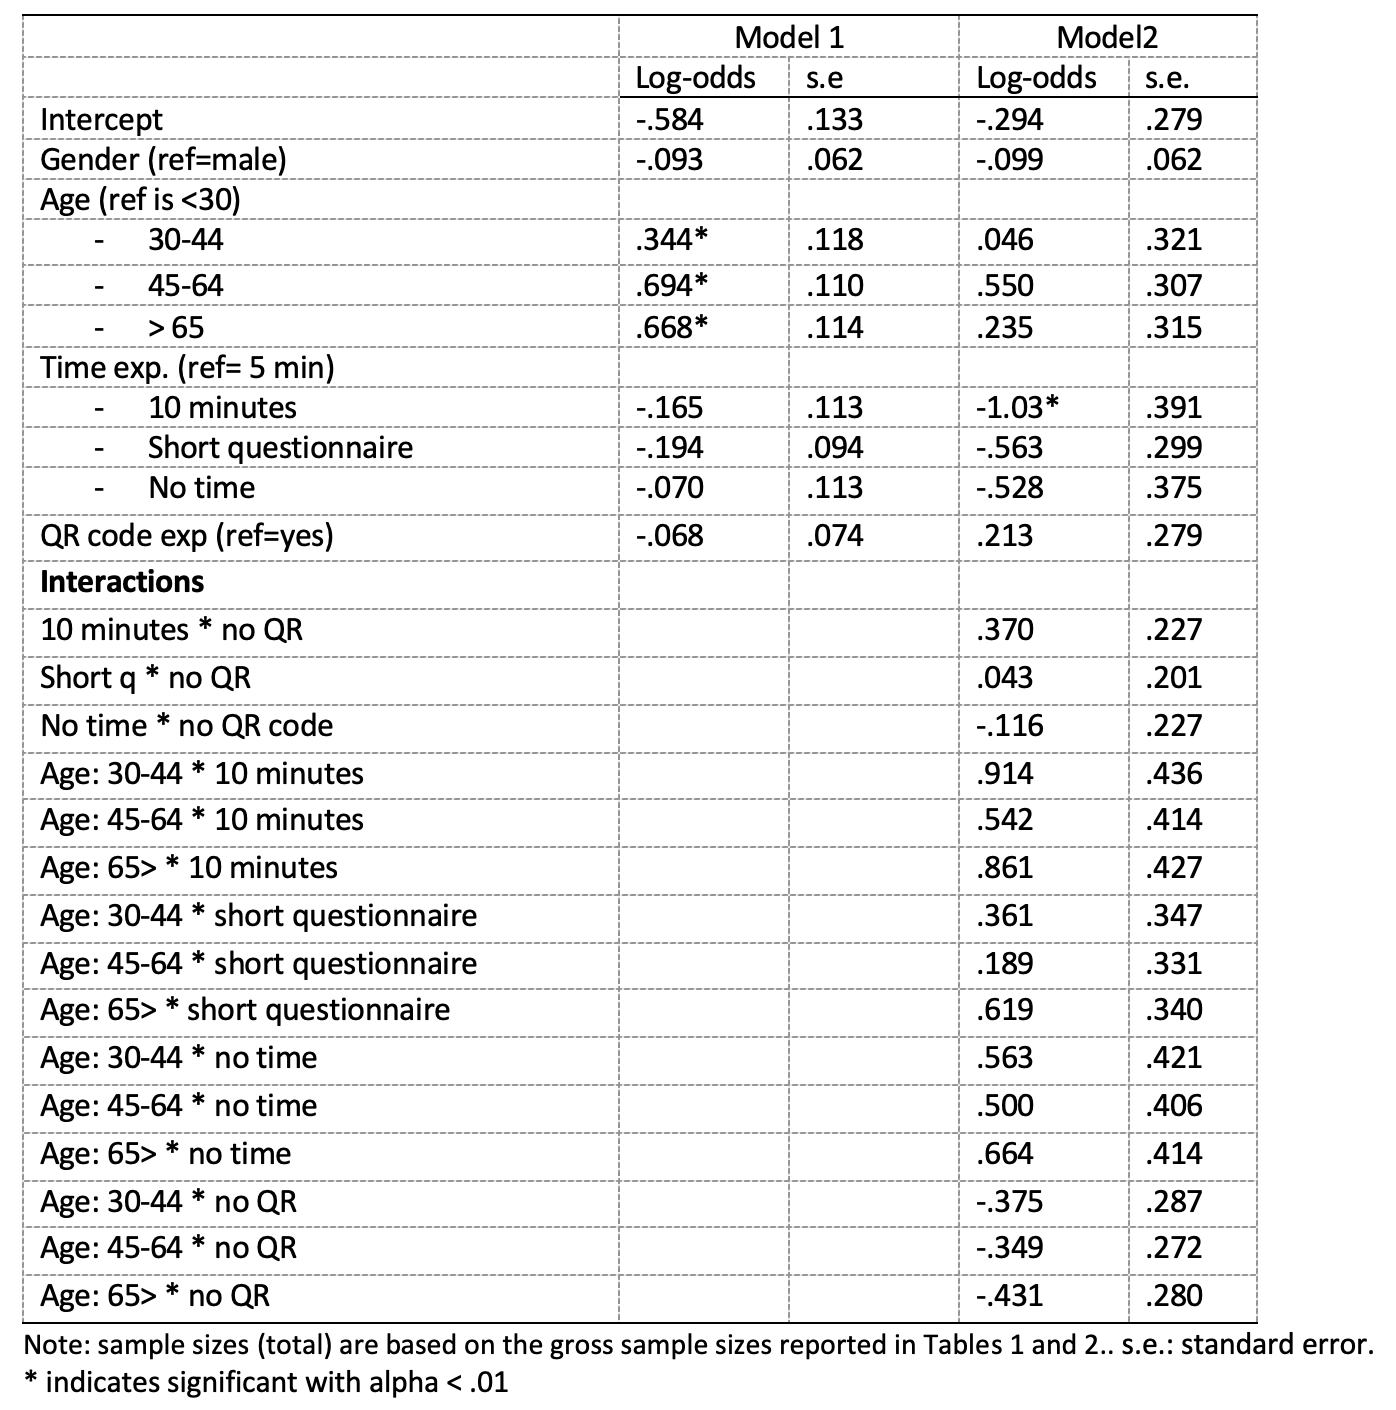
We next study the effects of age across the experimental conditions on the likelihood to start the survey. Table 4 documents the results of a logistic regression analysis, where we predict participation in the study with gender, age, our experimental manipulation as well as the interaction between age and the experiments. We here again find evidence that there is no effect of our experimental conditions. When we only test the main effects in model 1, we only find an effect of age: respondents older than 30 years in all three categories are more likely to participate. We find no effect of our experiment. When we add interaction effects between our two experiments, and add interaction effects with age, we find only one main effect: the condition where the stated length in the invitation was 10-minutes leads to fewer people starting the survey than in the 5-minute condition, but table 3 already showed this effect is very small. Because of small sample sizes when testing the interaction effects, our standard errors in model 2 are relatively large. Still, we must conclude that the experiments on the stated length of the survey and inclusion of a QR code do not lead to main effects on participation rates, nor are these effects different across age categories.
Table 4. Results from a logistic regression analysis predicting starting the survey
As a final step in our analyses we investigate whether the experiments caused respondents to use different devices. The manipulations with the QR code and statement on length were perhaps not strong enough. To test this, we look at whether respondents were more likely to use a smartphone in particular conditions.
Table 5 shows the percentage of respondents using a smartphone to complete the survey. Of all people who start the survey, 24% use the smartphone when they received the invitation with the QR code and 5-minute condition. This is only 11% when no QR code and no time is mentioned. There is no effect of the Time condition (χ2(3) = 5.00, p =.17), but a strong effect of the QR code (χ2(1) = 23.9, p < .001). The QR code thus does in general not lead to more respondents, but it does lead more respondents to use a smartphone to complete the survey.
Table 5. Percentage of people choosing smartphone by QR code and time condition
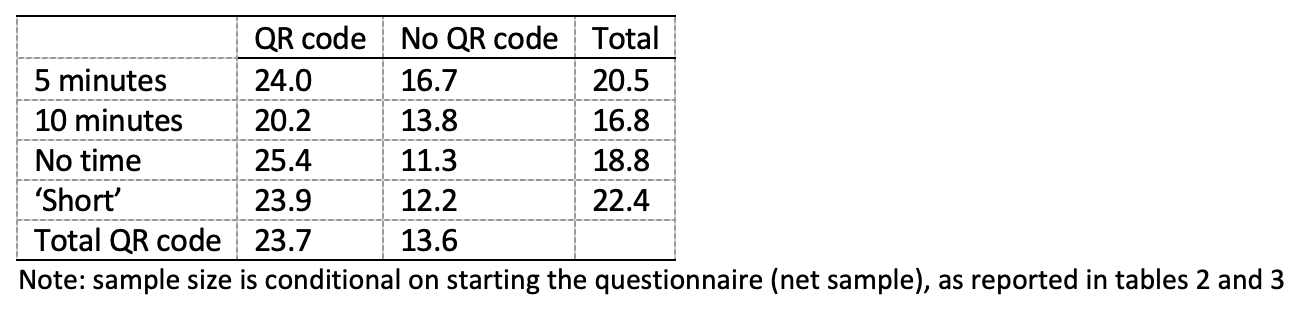
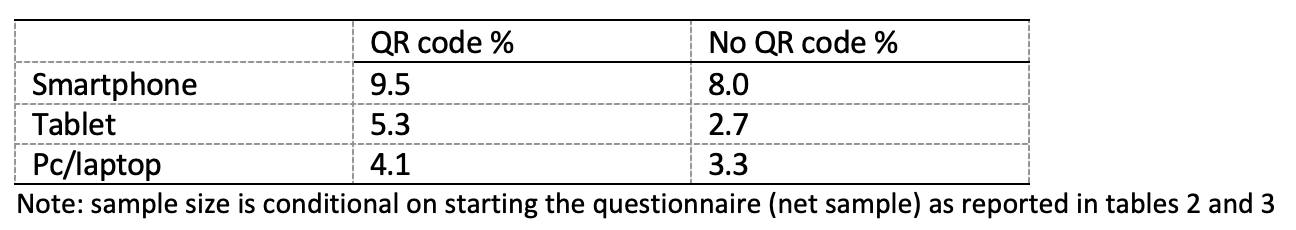
Table 6 shows that if people start the survey on their smartphone, they are somewhat more likely to break-off. Break-off is 9.2% when people use a smartphone, 4.5% when they use a tablet, and 3.8% when people use a PC/laptop (χ2(2) = 17.89, p =<.01) We do not find that dropout is higher when a QR code is offered (yes: 5.6%, no: 3.8%).
Table 6. Percentage of people breaking off by device and QR code
Discussion
The stated length of a relatively short survey did not affect response rates in this experiment. The four time conditions studied here did not have large effects on either login, break-off or completion rates. Overall, we find small differences that were mostly not significant. These findings confirm to some degree earlier findings that the effects of the announced survey length in the invitation letter or e-mail only have a small, or even no effect on response rates. Conventional wisdom says that web surveys have to be kept short, but we find no evidence that respondents are very sensitive to whether a survey is announced to be 5 or 10 minutes, or just short. Earlier studies did find that the length of the survey had an effect on break-off rates. As our survey was relatively short, break-off rates were relatively low, especially given the fact we used a fresh cross-sectional sample from the general population in our study. It may well be that there are effects on response rates, and more likely on breakoffs for longer web surveys.
Inclusion of a QR code in the invitation letter had no effect on login rates or break-off rates either. One could conclude that the leverage-saliency factors that we manipulated (time and method to access the survey), were perhaps not strong enough to make a difference. However, we did find signs that both the Time and QR conditions affect the sample members’ decision about the device they will use, so many respondents at least noticed the experimental manipulations. The fact that the condition where no time was mentioned at all performed about as well as the conditions where the stated length was 5 minutes or ‘short’ is remarkable, and goes against conventional wisdom. However, we do not want to make a case for longer web surveys, as many studies have shown that dropout is a large problem in longer web surveys.
Even in this short survey, the break-off rates for people participating by smart phone were considerably higher than with other devices. The web design of the Survey of Consumer Sentiments is suitable for smartphones but the questionnaire was not designed specifically for smartphones. There are strong indications that the difference in break-off may disappear if surveys are designed for smartphone specifically (Bakker, Meertens, Blanke et al, 2020).
The Survey of Consumer Sentiments is a relatively short survey and produces a relatively high web participation rate, as compared to other surveys conducted by Statistics Netherlands. One of the reasons this study was conducted was to inform a possible future design for Splitting Questionnaires. In Split Questionnaire design (also called modularization), respondents receive only a subset of all questions from a longer survey. The idea behind SQD is that we may increase response rates, and reduce breakoffs at the cost of missing data within our dataset.
Ideally, such an SQD design should stimulate respondents who would otherwise not have responded. Based on the findings of this study, the main effect of announcing a short survey length and including a QR code is that we push respondents to smartphones, without attracting new ones.
Although the differences in login rates and response rates were not significant with these sample sizes, they would be relevant in a mixed mode setting if they would actually be this large (almost 8 percentage points difference between the highest and lowest login rate across our experimental conditions). The findings in this paper may inspire replication experiments in other surveys, with different topics or different survey lengths. Such studies would also enable us to study interaction effects and subgroup differences across devices in a better way. Despite our relatively large sample size of 4300 sample members we lacked statistical power to study these effects well in the current study.
Appendix A: Advance Letter
[1] We have only been able to record the method of login for 1337 of a total of 1890 respondents. We have assumed that the proportion of respondents using a QR code is the same for those whom we know the login method, and those for whom we don’t know. If we assume that all people who have missing values did not use a QR code, the proportion is 9,3%. If they all would have used the QR code, the proportion would be 15,1%
References
- AAPOR (2019) The American Association for Public Opinion Research. 2015.Standard Definitions: Final Dispositions of Case Codes and Outcome Rates for Surveys. 8th edition. AAPOR
- Bakker, J., Meertens, V., Blanke, K., Nolan, A., Wilson, L., Plate, M., Kallio-Peltoniemi, M., Gravem, D., Geurden-Slis, M., Giesen, G., & Schouten, B. (under review). Future proof questionnaire design for social research: challenges and opportunities of a smartphone first approach.
- Bogen, K. (1996) The effect of questionnaire length on response rates – a review of the literature. U.S. Census Bureau papers SM96/05, https://www.census.gov/srd/www/abstract/sm9605.html
- Converse, J. M., & Presser, S. (1986). Survey questions: Handcrafting the standardized questionnaire (No. 63). Sage.
- Crawford, Couper & Lamias (2001) Web surveys. Perception of burden. Social science Computer Review, 19, 146-162.
- Edwards, P. J., Roberts, I., Clarke, M. J., DiGuiseppi, C., Wentz, R., Kwan, I., … & Pratap, S. (2009). Methods to increase response to postal and electronic questionnaires. Cochrane database of systematic reviews, (3).
- Fowler, F. J. (1995). Improving survey questions: Design and evaluation (Vol. 38). Sage.
- Galesic. M. & Bosnjak. M. (2009). Effects of questionnaire length on participation and indicators of response quality in a web survey. Public opinion quarterly. 73(2). 349-360.
- Guo, Y., Kopec, J. A., Cibere, J., Li, L. C., & Goldsmith, C. H. (2016). Population survey features and response rates: a randomized experiment. American journal of public health, 106(8), 1422-1426.
- Heerwegh, D., & Loosveldt, G. (2006). An experimental study on the effects of personalization, survey length statements, progress indicators, and survey sponsor logos in Web Surveys. Journal of Official Statistics, 22(2), 191.
- Kelly, F., Johnson, A., and Stevens, S. (2013). Modular Survey Design: Bite sized chunks 2. Paper presented at the CASRO Online Research Conference, San Francisco, March 7-8.
- Kaplowitz, M. D., Lupi, F., Couper, M. P., & Thorp, L. (2012). The effect of invitation design on web survey response rates. Social Science Computer Review, 30(3), 339-349.
- Liu, M., & Wronski, L. (2018). Examining completion rates in web surveys via over 25,000 real-world surveys. Social Science Computer Review, 36(1), 116-124.
- Luiten, A. (2011). Personalisation in advance letters does not always increase response rates. Demographic correlates in a large scale experiment. Survey Research Methods, 5(1), 11-20.
- Marcus, B., Bosnjak, M., Lindner, S., Pilischenko, S., & Schütz, A. (2007). Compensating for low topic interest and long surveys: A field experiment on nonresponse in web surveys. Social Science Computer Review, 25(3), 372-383.
- Marlar, J. (2018) Do Quick Response Codes Enhance or Hinder Surveys? Gallup Methodology blog, August 30 2018. https://news.gallup.com/opinion/methodology/241808/quick-response-codes-enhance-hinder-surveys.aspx
- Mavletova, A., Deviatko, I., & Maloshonok, N. (2014). Invitation design elements in web surveys–can one ignore interactions? Bulletin of Sociological Methodology/Bulletin de Méthodologie Sociologique, 123(1), 68-79.
- Mavletova, A., & Couper, M. P. (2015). A meta-analysis of breakoff rates in mobile web surveys. Mobile research methods: Opportunities and challenges of mobile research methodologies, 81-98.
- Peytchev, A. (2009). Survey breakoff. Public Opinion Quarterly, 73(1), 74-97.
- Revilla, M. and Ochoa, C. (2017). Ideal and maximum length for a web survey. International Journal of Market Research, 59, 557-566.
- Roberts, A., & Bakker, J. (2018). Mobile device login and break-off in individual surveys of Statistics Netherlands. Statistics Netherlands discussion paper. Accessible at https://www.cbs.nl/en-gb/background/2018/06/mobile-device-login-and-break-off-in-individual-surveys
- Smith, P. (2017). An experimental examination of methods for increasing response rates in a push-to-web survey of sport participation. Paper presented at the 28th Workshop on Person and Household Nonresponse, Utrecht, the Netherlands.
- Walston, J. T., Lissitz, R. W., & Rudner, L. M. (2006). The influence of web-based questionnaire presentation variations on survey cooperation and perceptions of survey quality. Journal of Official Statistics, 22(2), 271.
- Yan, T., Conrad, F., Tourangeau, R. and Couper, M.P. (2010). Should I Stay or Should I go: The Effects of Progress Feedback, Promised Task Duration, and Length of Questionnaire on Completing Web Surveys. International Journal of Public Opinion Research, 23, 131-147.
-
Keywords
calibration CATI coverage coverage bias cross-national surveys data linkage data quality European Social Survey experiment face-to-face face-to-face survey Facebook hard to reach populations incentives item nonresponse measurement measurement error mixed-mode surveys multitasking non-probability samples Nonresponse nonresponse bias nonresponse rates paradata PIAAC Probability sample probability samples QR codes rare populations response rate Satisficing social desirability Social media survey survey-taking climate survey data survey management survey methods Telephone survey telephone surveys total survey error unit nonresponse validity web survey Web surveys weighting
