

Examining Predictors of Unsuccessful Mail Delivery for a National Address-Based Sample During the COVID-19 Pandemic
Raphael Nishimura  University of Michigan, USA
Rebecca Gatward - University of Michigan, USA
Brady T. West University of Michigan, USA
Htay-Wah Saw University of Michigan, USA
Nishimura R., Gatward R., West B.T. & Saw H.-W. Examining Predictors of Unsuccessful Mail Delivery for a National Address-Based Sample During the COVID-19 Pandemic. Survey Methods: Insights From the Field. Retrieved from https://surveyinsights.org/?p=20596
© the authors 2025. This work is licensed under a Creative Commons Attribution 4.0 International License (CC BY 4.0) 
Abstract
Many surveys have changed modes because of the COVID-19 pandemic. Surveys using mailed letters and/or reminders may have been adversely affected by staff shortages affecting the delivery times of the United States Postal Service (USPS). In this study, we analysed daily USPS mail delivery reports for each of 21 National Distribution Centers (NDCs) for two specific mailings that were sent to a national probability sample of addresses in 2020. We linked concurrent aggregate rates of COVID-19 infection and mortality to each of the NDCs and examined the variability in cumulative delivery rates across the NDCs as a function of these rates. We also collected paradata on whether any of the mailings sent to a sampled address were returned as undeliverable and then modeled the probability of any undeliverable mailing as a function of auxiliary variables available, including the COVID-19 rates. We found no consistent relationship between COVID-19 rates and mail delivery rates for the 21 NDCs analysed. In our models of undeliverable mail, we found that counties with higher COVID-19 mortality rates had marginally significant reduced odds of undeliverable mailings, and that vacant or seasonal addresses and missing commercial information increased significantly the likelihood of mail being returned as undelivered.
Keywords
COVID-19, data collection methods, follow-up mailing, mail survey, web survey
Acknowledgement
This work was supported by the Eunice Kennedy Shriver National Institute of Child Health and Human Development (NICHD) of the National Institutes of Health (grant number R01HD095920).
Copyright
© the authors 2025. This work is licensed under a Creative Commons Attribution 4.0 International License (CC BY 4.0)
Introduction
The COVID-19 pandemic caused widespread disruptions to ongoing data collection activities, delayed planned research and data collection activities, prompted several large-scale nationally representative studies to switch from face-to-face to non-contact modes (such as telephone) and to completely shift interviewers from centralized call centers to work from their homes. Several studies adapted to the pandemic – some examples are included in this paper (Becker et al. 2022; Burton, Lynn and Benzeval 2020; Cornesse et al. 2021; Gummer et al. 2020; Sakshaug et al. 2020; Sastry, McGonagle and Fomby 2020; Scherpenzeel et al. 2020; Will, Becker and Weigand 2020). Initial results from studies analyzing the overall impact of the COVID-19 pandemic on research and data collection activities have been mixed, with some studies finding positive or null results and some studies finding negative results, depending on mode of data collection, study design and population, field protocols used, time period, and geographical location.
While various survey modes faced disruptions, the adaptability of different approaches varied significantly. Among these, online panels proved to be particularly resilient due to their flexibility, speed of data collection, cost-effectiveness, and use of non-contact web mode, most established probability-based online panels were able to adapt to the COVID-19 challenges easily and quickly, and collect high-frequency data during the pandemic (Blom et al. 2020; Burton, Lynn and Benzeval 2020; Gummer et al. 2020; Kapteyn et al. 2020; Kühne et al. 2020). The field outcomes for most online panels during COVID-19 have been positive. Becker et al. (2022) analysed response rate data from two survey waves in the Swiss DAB probability-based online panel and found that: (1) the response rate to a survey wave during the pandemic was significantly higher than a comparable period in the previous survey wave; and (2) respondents responded to a survey request during the pandemic faster than to a request in a comparable period in the previous survey wave. These findings were robust to adjustment for a set of respondent demographics, survey-level and contextual variables, paradata, weather condition, temporal variables, and number of digital reminders. The authors attributed the positive effects of the pandemic on the response rate and response latency to decreased opportunity costs (coupled with increased benefits) associated with taking an online survey during COVID-19 lockdowns, when most panel respondents were required to stay home and outdoor social and leisure activities were limited.
The positive field outcomes during COVID-19 lockdowns for online panels were also reported by a study conducted among probability-based online respondents in Australia. Using longitudinal data collected from the Live in Australia Online Panel, Biddle (2022) analysed the extent to which local variations in COVID outcomes and policy stringency measures impacted someone’s willingness to participate in ongoing probability-based online longitudinal surveys. He found that: (1) a higher stringency index value or greater policy restrictions on activities is associated with a higher probability of survey completion; and (2) parts of Australia most impacted by the pandemic had a greater level of active participation in a particular wave of data collection.
Reardon (2022) analysed project and delivery data from the Healthy NYC panel study, which is a probability-based panel of 13,000 adult New Yorkers launched in April 2020 to respond to the emerging COVID-19 pandemic. Healthy NYC panelists were recruited using address-based sampling (ABS) frames. In this push-to-web survey, participants without internet access completed surveys via paper questionnaires. The study found longer than anticipated intervals between initial survey invitations being mailed out and participants completing the surveys online, or initial survey invitations being mailed out and the receipts of completed paper surveys. The study attributed the delay to local United States Postal Service (USPS) branches being greatly impacted by COVID-19 as well as to USPS staff shortages resulting in reduced ability to process mailings.
Unlike online panels, which could quickly adapt to remote data collection, the field operations and data collection activities for large-scale national longitudinal studies that rely on non-web modes such as telephone or face-to-face were particularly hard hit during the COVID-19 outbreak due to their complex field protocols, mixed-mode designs, and lengthy field periods. For instance, two major supplements of the Panel Study of Income Dynamic (PSID) – the 2019 waves of the PSID Child Development Supplement (CDS-19) and the PSID Transition into Adulthood Supplement (TAS-19) – were in the field during the early COVID-19 outbreak. Sastry, McGonagle and Fomby (2020) found that the COVID-19 pandemic led to: (1) a significant reduction in response rates for both supplements; (2) terminations of in-person visits that represented a key study component in CDS-19 and could not be easily adapted to remote administration (e.g., administering achievement tests for children); (3) high field costs associated with adapting to COVID-19 and providing paid time-off benefits to staff affected by the pandemic; (4) an overall reduction in field staff productivity; and (5) increased measurement and recording errors arising from some respondents being asked to self-administer a subset of the tasks that would otherwise be administered by trained field workers.
Like the PSID, longitudinal studies conducted in other countries were also negatively affected by the pandemic. The Understanding Society: UK Household Longitudinal Study (https://www.understandingsociety.ac.uk/) – a large national probability-based household panel survey that has been collecting data continuously since January 2009 – decided to suspend face-to-face interviewing and instead shift to internet interviewing (with a telephone follow up for non-responding units) for all remaining interviews when the UK Government introduced COVID-19 related restrictive measures in March 2020, potentially introducing mode effects (Burton, Lynn and Benzeval 2020). Similarly, in Germany, all ongoing as well as planned face-to-face interviews for all major longitudinal data collection efforts were suspended and then adapted and switched to telephone interviews immediately after COVID-19 was declared a global pandemic in March 2020 (Gummer et al. 2020; Sakshaug et al. 2020; Will, Becker and Weigand 2020).
Longitudinal data collections that span several countries and focus on individuals aged 50 and above – a population group most vulnerable to COVID-19 – also had to adapt to various COVID-19 infection rates and health-preventive and lockdown measures across participating countries. The Survey of Health, Ageing and Retirement in Europe (SHARE) (http://www.share-project.org) – a multi-national study that collects longitudinal data on aging, health and retirement from 50+ populations across 28 European countries – was in the middle of Wave 8 data collection when the WHO declared COVID-19 a global pandemic. Overall, the pandemic caused SHARE to: (1) immediately suspend all face-to-face interviewing in all 28 participating countries; (2) change its interviewing mode to telephone in a short period of time so that some of the data collection activities could resume in some participating countries; and (3) discontinue recruitment of its Wave 8 refreshment samples (Scherpenzeel et al. 2020).
Unlike natural disasters such as hurricanes, floods, and earthquakes that tend to disrupt survey operations mostly in small and limited geographical areas for a relatively short period of time, the COVID-19 pandemic has affected survey operations globally with an open-ended time duration. This has created uncertainties for ongoing research projects, requiring them to continuously adapt to the changing and evolving COVID-19 situations both locally and globally.
While most prior studies analysed the impact of COVID-19 in terms of mode switches and response rates, research on its effects on mail delivery has been limited, except for Reardon (2022), which focused on NYC but has limited generalizability to a national sample. This is particularly important because COVID-19-related disruptions—such as workforce shortages due to illness or absenteeism—may have reduced the efficiency of mail processing and delivery, especially in areas experiencing higher infection and mortality rates. We also explore whether these disruptions varied across different geographic regions and mailing phases. By investigating these factors, this study contributes new empirical evidence to the discussion on how external shocks, such as a public health crisis, affect survey mailings—an aspect of survey operations categorically distinct from studying response rates and mode switches. Additionally, by focusing on a national sample, this research enhances the generalizability of findings beyond a single regional context such as NYC.
Most importantly, existing studies on the broader impact of COVID-19 on survey operations have primarily focused on established panel surveys, while comparable research on new national-level cross-sectional surveys remains limited. The German General Social Survey (ALLBUS) 2021 and the European Social Survey (ESS) Wave 10 are two notable cross-sectional studies that collected data during the pandemic. Both surveys are conducted biennially, with ALLBUS focusing on the German population and ESS covering multiple European countries.
In the case of ESS Wave 10 (https://www.europeansocialsurvey.org/sites/default/files/2024-09/ESS10_Quality_Report.pdf), response rates varied substantially across countries, ranging from 20.9% in the United Kingdom to 72.9% in Czechia, likely due to country-specific factors. Fieldwork periods also differed across countries. For ALLBUS 2021 (https://doi.org/10.4232/1.14151), data collection took place between June and August 2021, whereas our response rates were analysed for the period of July to August 2020. These countries’ differences, along with variations in data collection windows, distinguish our study from other cross-sectional surveys conducted during COVID-19.
In this study, we document and report findings from a national web/mail data collection conducted in the U.S. between April 2020 and June 2022. Data collection spanned two time periods, and the first began in the early stages of the COVID-19 pandemic. Our specific objectives were twofold: (1) to examine mail delivery rates across major National Distribution Centers (NDCs) and how the NDC-level delivery rates varied as a function of local COVID-19 infection and death rates; and (2) to identify significant predictors of undeliverable mail addresses, including infection and mortality rates associated with COVID-19.
Methods
Overview of the American Family Health Study
The context for this study is the American Family Health Study (AFHS) – a national address-based probability sample of more than 41,000 U.S. addresses (see afhs.isr.umich.edu for additional details), implemented in two replicates: Replicate 1 with 19,381 sampled addresses and Replicate 2 with 22,381 sampled addresses. Both replicates used a two-phase stratified random sample design. Two-phase sampling was used to stratify the sample on predicted eligibility using commercial data appended to the sample. In both replicates, the Phase 1 sample consisted of 110,000 addresses obtained from the commercial vendor Marketing Systems Group, using their ABS frame with all the address from the USPS Computerized Delivery Sequence file, including vacant and seasonal addresses, but not including the No-Stat file, which contains addresses considered inactive for mail delivery, including addresses in new housing developments, vacant properties, rural routes where mail is forwarded to post office boxes, and gated communities where mail is delivered to a central location. Since most of the analysis and results in the current study are based on Replicate 1, we focus the description of the survey on this replicate. A few modifications were made in the Replicate 2 protocol, and we describe further below those that are relevant for the results of this study.
The AFHS used a sequential mixed-mode mail/web protocol for push-to-web household (HH) screening to identify eligible persons aged 18-49. In the first phase of the protocol, sampled households received a mailed invitation (including a $2 cash incentive) addressed to the residents of a particular state, inviting an adult member of the household to complete a screening questionnaire online. The AFHS screening questionnaire was designed to collect a list of persons aged 18 years and over in the household from which one eligible person would be selected to be invited to participate in the main AFHS survey. In the second phase of the contact protocol, a follow-up reminder in the form of a postcard was mailed to non-responding addresses one week after the mailed invitation. The postcard reminder was followed a week later with a mailing that included a paper version of the screening questionnaire. In the third and final non-response follow-up mailing, we also included a copy of the paper screener questionnaire but, for Replicate 1, it was mailed to a randomly selected sub-group (n=5,000) using USPS priority mail and including an additional a $5 cash incentive (Wagner et al., 2022).
This study is divided into two parts: 1) the evaluation of the impact of the COVID-19 pandemic on mail delivery rates; and 2) the general predictor of undeliverable mail. Each part is important to consider when designing and implementing a national address-based sample that uses mail as one of its primary modes of data collection.
Mail delivery rates across NDCs and across local COVID-19 infection and mortality rates. The first part of this study reports mailing outcomes from the second and third phases of the study protocols of the AFHS implemented during the peak of the pandemic (July-August 2020). Specifically, one week after the initial mail invitations were sent out, we implemented the second phase of the study protocol on July 28, 2020, by mailing out follow-up reminders in the form of a postcard to 19,196 addresses. On August 4, 2020, we implemented the third phase of the study protocol by sending out mailings to 18,755 addresses that included a paper version of the screening questionnaire. For each of the two mailings, we received daily reports from the USPS IMB (Intelligent Mail® Barcode) tracking service (via our vendor) to monitor delivery times for all sampled addresses. These data are aggregated at the USPS National Distribution Center (NDC) level (because tracking and scanning of mailings are completed at the NDCs). The United States Postal Service (USPS) has 21 NDCs across the U.S. and each of them is assigned with a set of ZIP Code Tabulation Areas (see https://pe.usps.com/archive/html/dmmarchive20100607/L601.htm for a complete list of 3-digit ZIP Code prefixes assigned to each NDC).
We aggregated infections and deaths due to COVID-19 across days in July 2020 and then across counties within each NDC to calculate total infection and death counts for the month of July at the NDC level. COVID-19 infection and death data were extracted from the New York Times’ ongoing repository of data on coronavirus infections and deaths in the U.S. (https://github.com/nytimes/covid-19-data), which reported daily COVID-19 infections and deaths at the county level. The population data were extracted from the U.S. Census (https://www2.census.gov/geo/docs/maps-data/data/rel/zcta_county_rel_10.txt), which reports population totals at the Zip Code level. We aggregated the population data across Zip Codes and then across counties to obtain total population counts for each NDC. We then calculated per capita infection and death rates at the NDC-level for July 2020 by dividing: (1) monthly total COVID-19 infections by total population; and (2) monthly total deaths by total population, respectively. We also report summary statistics of the number of days from the dates the second and third reminders were dropped until the dates they were scanned at NDCs, by NDC-level COVID-19 infections and death rates.
Predictors of undeliverable mail
A mailing is considered undeliverable if it was returned with a label from the USPS indicating one of the following reasons for being returned: vacant, attempted not known, no mail receptacle, no such number, no such street, not deliverable as addressed, return to sender – unable to forward, refused – unable to forward, insufficient address, temporarily away – return to sender, illegible or unclaimed. The returned mailings for some addresses were not always consistent across the multiple mailings that we sent, per the AFHS study protocol: in some cases, the mailings were not returned, and in others they were returned but with a different USPS code. There were even instances in which we obtained a completed survey for a household for which we had at least one indication of an undelivered mailing. We classified an address as undeliverable mail if one or more of its mailings was returned with one of the aforementioned USPS codes and the screening survey was not started for that address.
In this second part of the study, we seek to understand what the general predictors of undeliverable mail are. For such, we estimated a logistic regression model predicting undeliverable mail addresses. For that, we first fitted a logistic regression model with all the covariates using only Replicate 1 sample data and applying the LASSO technique for variable selection. The full set of covariates that initially entered on this LASSO logistic regression model included: (1) NDC-level COVID-19 infection and death rates; (2) demographic information available from the 2019 Block-Group Level Planning Database (https://www.census.gov/data/developers/data-sets/planning-database.2019.html), with data from both the 2010 Census and the 2013-2017 American Community Survey; and (3) household information available from the ABS frame and the commercial variables appended to it. The full list of covariates included in the initial LASSO model is presented in Table A.1 in the Appendix.
Then, we fitted a final logistic regression model only with the retained variables in the initial model from the LASSO technique, again using Replicate 1 sample data. This model was used to create predicted probabilities of undeliverable mailing status for sampled addresses in Replicate 2, so that we could under-sample addresses with a high predicted probability of having undeliverable mail.
The main reason we opted for this estimation approach is because we wanted to both conduct a variable selection to get a more parsimonious model and obtain a model that could be interpreted, together with standard error estimates and Wald tests for the regression coefficients. However, the LASSO procedure, as far as we understand, does not provide the latter, due to the introduction of a regularization bias to reduce overfitting. Therefore, we had to rely on a second logistic regression model to obtain such output. This naïve approach can lead to some omitted variable bias, which can have an impact on the inferential results of the model (Belloni et al., 2014; Felderer et al., 2023).
In order to address this potential issue, we ran the LASSO procedure in a random half of Replicate 1 sample, and then we fitted the logistic regression model in the remaining half of the sample. Since the results were nearly the same, for simplicity, we present the results from the naïve approach.
We first present results of the mail delivery rates at the NDC-level COVID-19 infection and death rates analysis. Then, we report the odds ratios, 95% confidence intervals, and levels of statistical significance of the logistic regression model from the undeliverable mail analysis, along with some metrics of the performance of the predictions with the Replicate 2 sample data. All analyses were conducted using R version 4.1.1 and Stata for Windows version 17.
Results
Mail delivery rates across NDCs and by COVID-19 infection and death rates
Figure 1 presents cumulative delivery rates for postcard reminders mailed out on July 28, 2020 (Column 1) and for the third reminder screener package mailed out on August 4, 2020 (Column 2) for each of the 21 NDCs. The top row presents cumulative delivery rates by NDC-level COVID-19 infection rate (below median, above median) and the bottom row presents cumulative delivery rates by NDC-level COVID-19 death rate (below median, above median). Tables 1 and 2 present total mailings tracked and cumulative delivery rates for individual NDCs for the postcard reminders and third reminder, respectively. In Tables 3 and 4, we present summary statistics of the cumulative delivery rates by COVID-19 infection and death rates for the postcard reminders and third reminders, respectively. In Tables 5 and 6, we present summary statistics of the gap in days between the date mailed and the dates they were scanned at NDCs, by NDC-level COVID-19 infection and death rates for the postcard reminders and third reminders, respectively.
Overall, the average cumulative delivery rate is 89.31% for the postcard reminders (Table 1) and 87.39% for the third reminders (Table 2). It is worth mentioning that there are two NDCs with deliver rates below 70% (Detroit and St. Louis NDCs with cumulative delivery rates 61.46% and 59.01%, respectively) for the postcard reminders (Table 1), while there is only one NDC falling behind this threshold (Jacksonville NDC with 58.18% cumulative delivery rates) for the third reminders (Table 2). We found no significant differences in cumulative delivery rates across the 21 NDCs (Figure 1) and across NDC-level COVID-19 infection and death rates (Tables 3 and 4), for both the postcard and third reminder mailings. Similarly, we did not find any systematic association between NDC-level COVID-19 infection and death rates and the gap in days between the dates the mailings were dropped and the dates they were scanned by NDCs for both types of mailings (Tables 5 and 6). In sum, our analysis suggests that the spread of the COVID-19 pandemic in early 2020 did not have a significant negative effect on the mailings of AFHS reminder letters at the national level.
Table 1: Cumulative postcard reminder delivery results one week after the mailings were dropped on July 28, 2020, separated by NDC
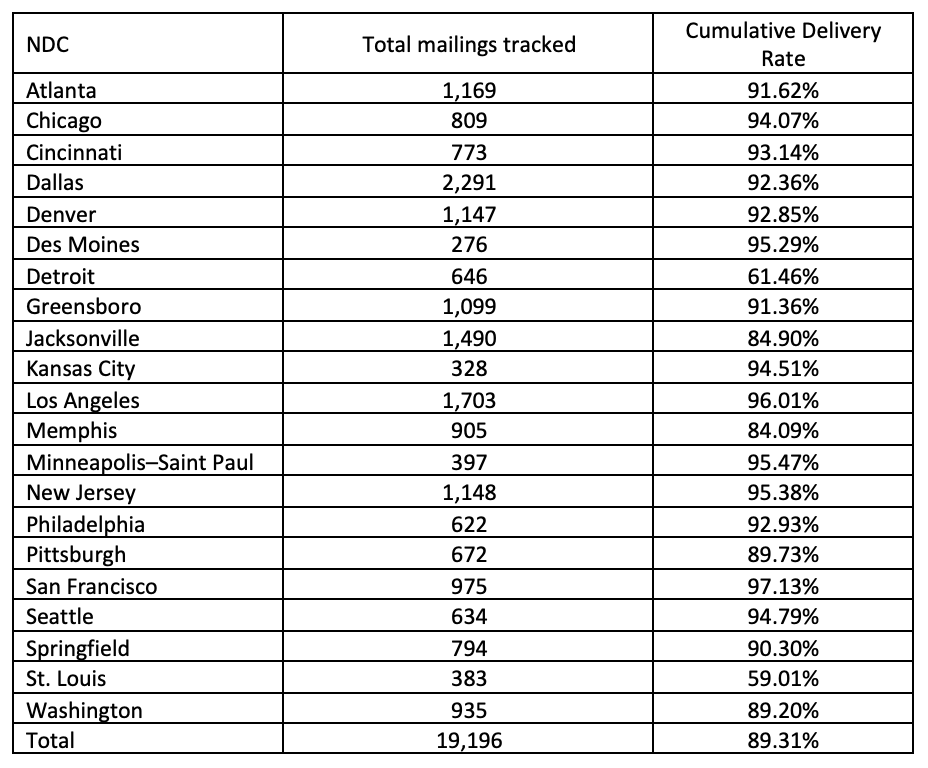
Figure 1: Cumulative Mail Delivery Rates by NDC-level COVID-19 Infection Rates and Death Rates (Panel 1 represents cumulative delivery rates for postcard reminders mailed out on July 28, 2020; Panel 2 represents cumulative delivery rates for third reminder screener package mailed out on August 4, 2020)
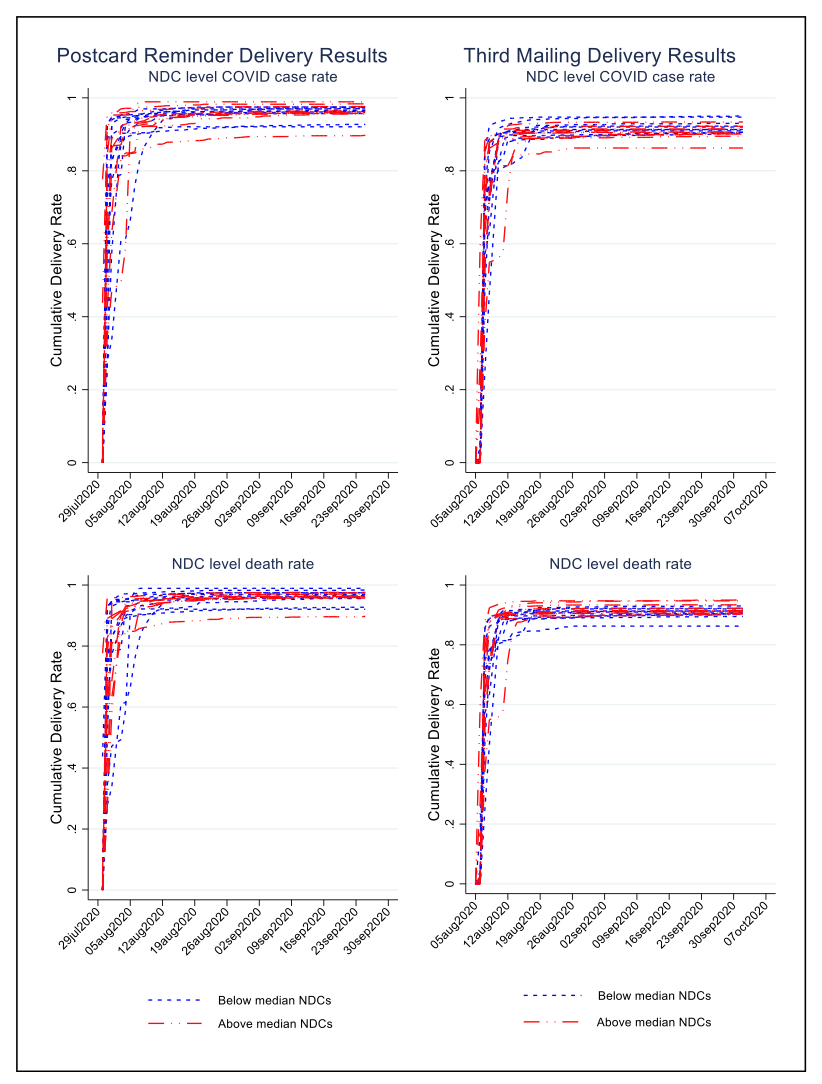
Table 2: Third reminder cumulative delivery results one week after the mailings were dropped on August 4, 2020, separated by NDC
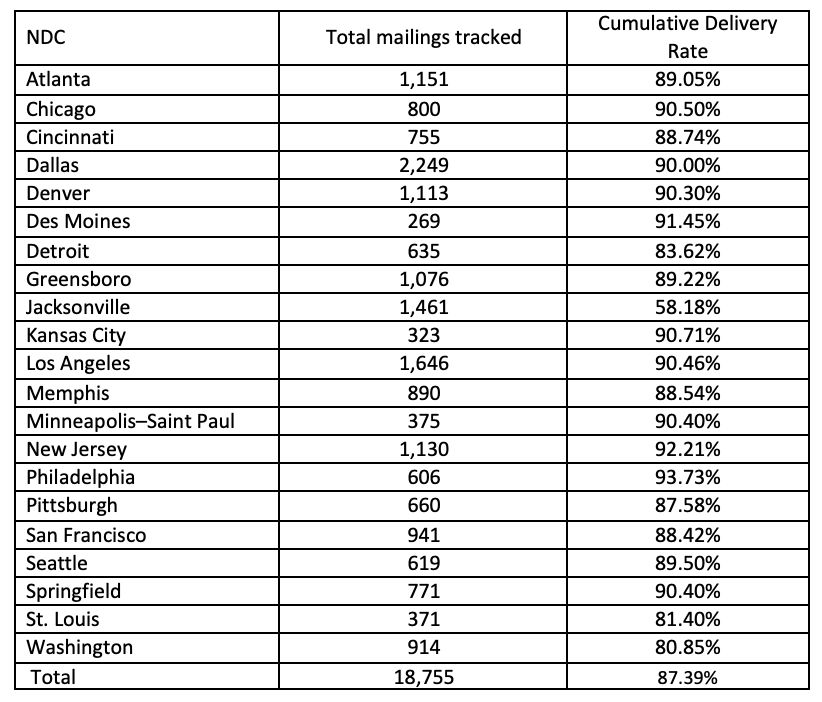
Table 3: Summary statistics for cumulative postcard reminder delivery rates one week after the mailings were dropped on July 28, 2020 by NDC-level COVID-19 infection and death rates
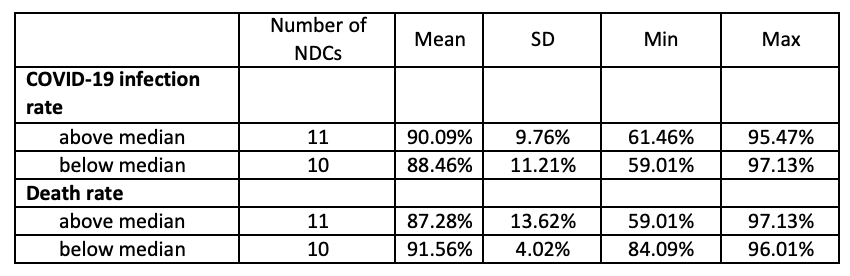
Table 4: Summary statistics for third reminder cumulative delivery rates one week after the mailings were dropped on August 4, 2020, by NDC-level COVID-19 infections and death rates
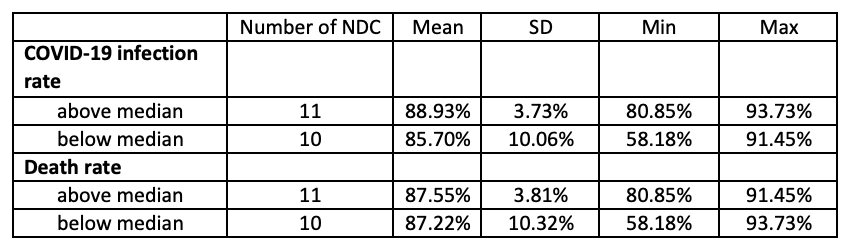
Table 5: Number of days from the dates the postcard reminders were dropped on July 28, 2020 until the dates they were scanned at NDCs, by NDC-level COVID-19 infections and death rates
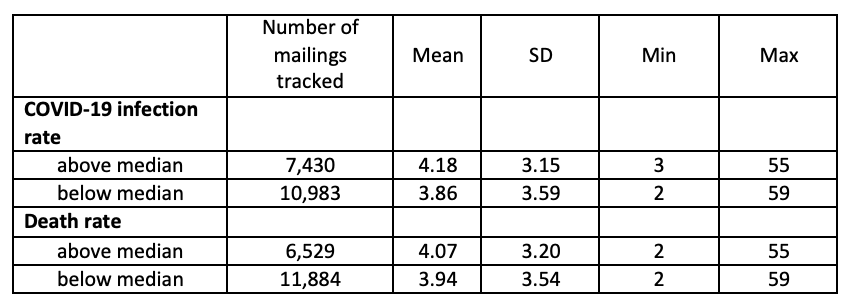
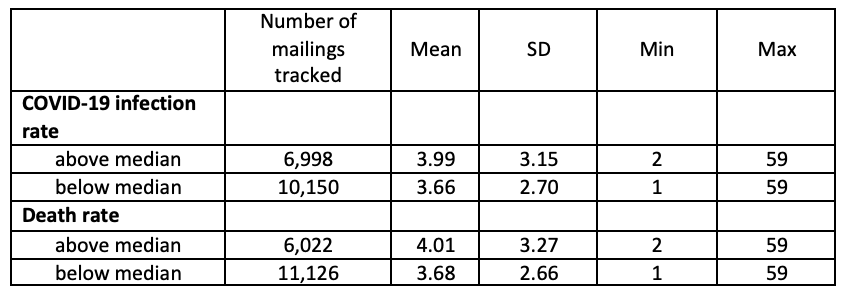
Table 6: Number of days from the dates the third reminders were dropped on August 4, 2020 until the dates they were scanned at NDCs, by NDC-level COVID-19 infections and death rates
Predictors of undeliverable mail
From the 19,381 addresses selected in Replicate 1, 1,431 of them (7.4%) had undeliverable mail. To create a prediction model of undeliverable mail addresses, we used a random sub-sample of 70% of the entire Replicate 1 data as a training dataset to fit a logistic regression model. Initially, we included in the model all the covariates available and used LASSO with cross-validation for variable selection. The indicator of the address being in a county with COVID-19 infection rate above the national median was not retained in the model after the variable selection. While the corresponding indicator for the COVID-19 death rate was retained in the model by LASSO, it was not statistically significant at the 5% level (p = 0.064). Since we were aiming at developing a more general prediction model, regardless of the state of the COVID-19 pandemic, we ultimately decided to drop both indicators from the models.
After fitting the logistic regression model again with LASSO, removing the two COVID-19 indicators, and performing cross-validation, we selected the variables whose coefficients were not shrunk to zero and fitted the logistic regression model using the training dataset. The final estimated model is presented in Table 7.
Table 7: Logistic regression model to predict undeliverable mail addresses using AFHS Replicate 1 data
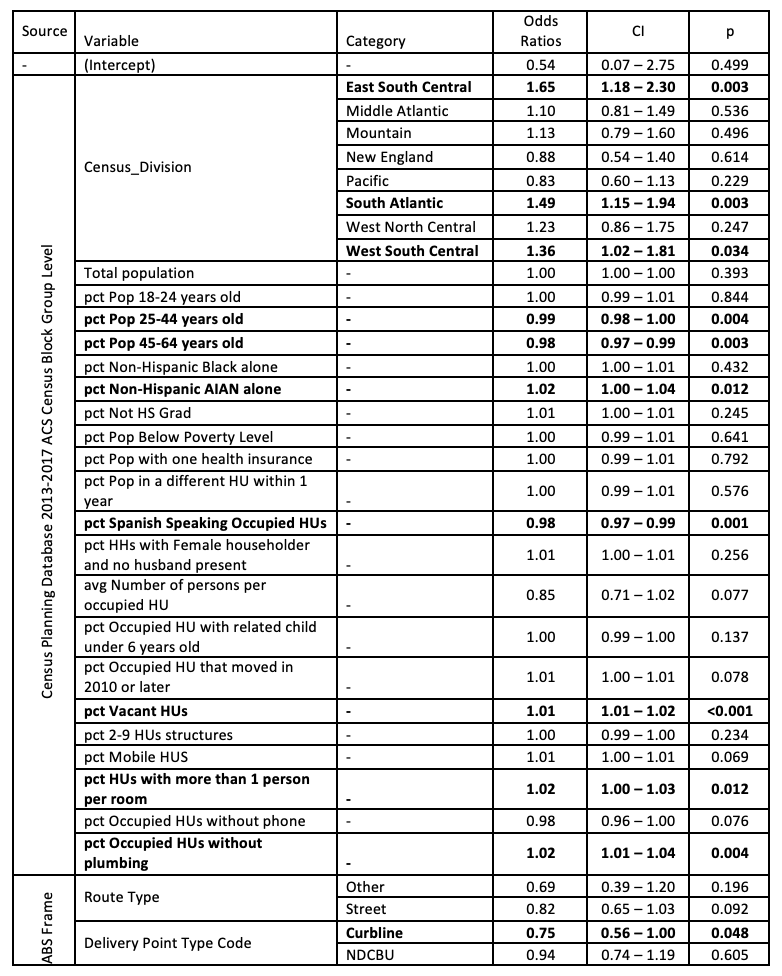
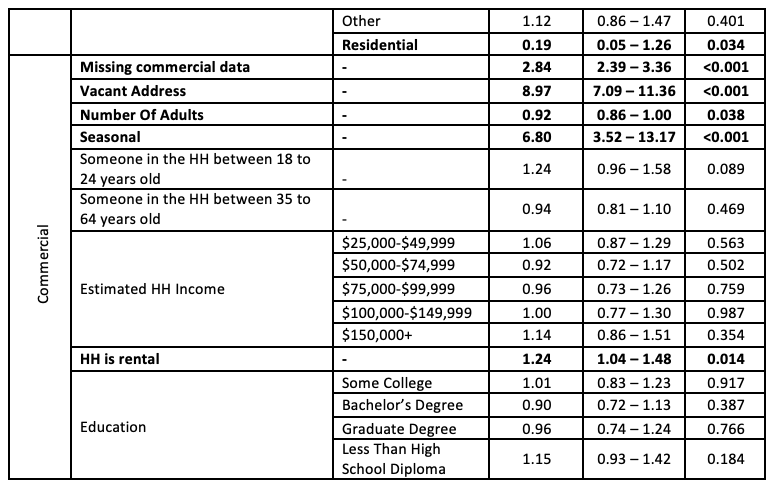
Coefficients significantly different from zero at a 5% level are in bold.
This estimated model gives us a few clues on what might explain mailings being undelivered to certain types of addresses. First, an indication that the address is vacant or seasonal seems to be an important factor in explaining a higher probability of mailings sent to that address being undelivered. In the AFHS sample selection, to reduce any potential coverage bias, we decided to keep in the sampling frame any addresses that the sample vendor flagged as being either of those two, consistent with the recommendations from Harter et al. (2016). Another strong predictor of undeliverable mail is the lack of any commercial data provided by the sample vendor, which might also provide another indication that the address is vacant.
We applied the resulting model to a testing dataset, formed by the remaining 30% of Replicate 1 data, to evaluate its prediction performance. The AUC was 0.77 and Nagelkerke’s pseudo R2 was 0.21. To classify a new sample of addresses as being undeliverable or not, we established a classification threshold for the predicted probabilities from analyses of confusion matrices, using cut-off points from 0.01 to 0.99. We assessed various statistics, such as accuracy, false positive and false negative rates, and detection rates. Based on this analysis, we decided to set the threshold to 0.46 (i.e., cases with a predicted probability above 0.46 were classified as being an undeliverable address), as this threshold led to the highest level of accuracy (93.1%). While with this threshold we had a moderately low sensitivity (17.4%), we had a very high specificity (99.1%). For our application, false positives (classifying an address as being undeliverable mail when it is not) tend to be more important than false negatives (classifying an address as not being undeliverable mail when it is), since it has more implications for coverage error, whereas the associated cost implications of false negatives are relatively minor.
Using the estimated model with the associated cut-off point of 0.46, from the 110,000 addresses selected in Phase 1 sampling of the Replicate 2 sample, 2,335 of them were predicted to be undeliverable. In the second sampling phase, we under-sample those cases at a rate approximately 90% lower than we would have under an equal probability sample design, selecting a total of 204 such addresses. From those, 139 (68.1%) turned out to be undeliverable mail addresses. From the remaining 22,177 addresses selected in the Phase 2 sample, 1,623 (7.3%) of them resulted in undeliverable mail. Overall, this corresponds to an accuracy rate of 92.4%, with a low sensitivity (7.9%) but very high specificity (99.7%).
Discussion
The first part of this study investigated the impact, if any, of the COVID-19 pandemic on the mail delivery rates for a national survey in the US. We found that there were no significant differences in cumulative delivery rates across the 21 NDCs for two different types of mailings, indicating that the pandemic did not negatively affect mail delivery. The study also found no systematic association between NDC-level COVID-19 infection and death rates and the gap in days between the dates the mailings were dropped and the dates they were scanned by NDCs for both types of mailings.
The study’s findings suggest that despite the COVID-19 pandemic’s impact on various aspects of society, it did not significantly affect mail delivery at the national level. This is important, because an increasing number of surveys rely on mailing to maintain their study samples and ensure accurate data collection. The study’s findings also suggest that mail delivery systems in the US remained robust during the early stages of the pandemic. It is also worth noting the potential differences in delivery rates and response rates between contact attempts involving established panelists and those involving new respondents in cross-sectional studies, with the latter being the focus of this study.
In the second part of this article, we presented results from a model aimed at predicting undeliverable mail addresses. The model identified an indication that the address is vacant or seasonal as an important factor in explaining a higher probability of undeliverable mail, as well as the lack of any commercial data provided by the sample vendor. After conducting a variable selection, we realized that COVID-19 infection and mortality were either non-significant or just marginally significant to predict an undeliverable mail. Therefore, to make the model more parsimonious and more general, that is, regardless of whether it is used during a period like the COVID-19 pandemic or not, we decided to drop the infection and mortality rates from the model. When we run the logistic regression model with and without these variables (not presented here), the general results of the coefficients of the other variables stayed relatively the same. Also, given that in the first part of the study we did not find any consistent relationship between COVID-19 rates and mail delivery rates, this suggests to us that our model can be also applied during non-pandemic periods.
While removing such types of addresses from the ABS frame could improve efficiency, as we would avoid sending mailed survey invitations to addresses that would potentially return them as undeliverable, we reiterate the Harter et al. (2016) advice to refrain from doing so, given that 31.2% of the addresses predicted to be undeliverable turned out not to be in Replicate 2 of AFHS; this rate is similar to what has been observed in previous studies (Amaya et al. 2014; Kalton et al. 2014). In turn, this could result in some coverage bias. Instead, we advocate for a sub-sampling approach, in which this type of address could be selected at a lower sampling rate. This would improve operational efficiency without the risk of coverage bias. The sub-sampling rates can be determined in a cost-error trade-off analysis, which should also account for the weighting effect due to the differential selection probabilities.
An important limitation of this second part of the study is that we used a naïve approach for the model estimation, in which we first conducted a variable selection using a LASSO procedure and then fitted the logistic regression model using only the retained variables. This can potentially bias the inferential results due to an omitted variables bias. To avoid that, we also estimated the model using a random half-sample in the LASSO procedure and the remaining half of the sample for the logistic regression model fitting. The similarity of the results indicates that we may not be suffering from such problems on these results, but a more robust approach, such as a double machine learning (Felderer et al., 2023) can potentially further confirm that.
Overall, this study adds to the growing body of research examining the impact of the COVID-19 pandemic on various aspects of society, including public health research. Moreover, we demonstrate how a modelling approach can be a useful tool for predicting undeliverable mail addresses, with a high level of accuracy and specificity. However, its low sensitivity suggests that additional methods may be necessary to identify all undeliverable mail addresses. Future research could investigate the impact of the pandemic on other aspects of mail delivery systems or explore the potential use of alternative methods for mail delivery during pandemics or other crises.
Appendix
References
- Amaya A., LeClere F., Fiorio L., & English, N. (2014). Improving the utility of the DSF address-based frame through ancillary information. Field Methods 26:70-86.
- Becker, Rolf, Sara Möser, Nora Moser, and David Glauser. 2022. “Survey Participation in the Time of Corona.” Survey Research Methods 16(1):61-74.
- Belloni, Alexandre, Victor Chernozhukov, and Christian Hansen. “Inference on treatment effects after selection amongst high-dimensional controls”. Review of Economic Studies, 81(2), 608–650.Biddle, Nicholas. 2022. “Linking and analyzing a geographic/time specific stringency index to a probability-based longitudinal survey in Australia.” in CIPHER 2022 Conference Presentation.
- Blom, Annelies G, Carina Cornesse, Sabine Friedel, Ulrich Krieger, Marina Fikel, Tobias Rettig, Alexander Wenz, Sebastian Juhl, Roni Lehrer, and Katja Möhring. 2020. “High frequency and high quality survey data collection.” Survey Research Methods 14(2):171-78.
- Burton, Jonathan, Peter Lynn, and Michaela Benzeval. 2020. “How Understanding Society: The UK household longitudinal study adapted to the COVID-19 pandemic.” Survey Research Methods 14(2):235-39.
- Cornesse, Carina, Ulrich Krieger, Marie‐Lou Sohnius, Marina Fikel, Sabine Friedel, Tobias Rettig, Alexander Wenz, Sebastian Juhl, Roni Lehrer, and Katja Möhring. 2021. “From German Internet Panel to Mannheim Corona Study: Adaptable probability‐based online panel infrastructures during the pandemic.” Journal of the Royal Statistical Society: Series A (Statistics in Society).
- Felderer, Barbara, Jannis Kueck, and Martin Spindler. “Using double machine learning to Understand Nonresponse in the recruitment of a mixed-Mode Online Panel.” Social Science Computer Review 41.2 (2023): 461-481.
- Gummer, Tobias, Claudia Schmiedeberg, Martin Bujard, Pablo Christmann, Karsten Hank, Tanja Kunz, Detlev Lück, and Franz J Neyer. 2020. “The impact of Covid-19 on fieldwork efforts and planning in pairfam and FReDA-GGS.” Survey Research Methods 14(2):223-27.
- Kapteyn, Arie, Marco Angrisani, Dan Bennett, Wändi Bruine de Bruin, Jill Darling, Tania Gutsche, Ying Liu, Erik Meijer, Francisco Perez-Arce, and Simone Schaner. 2020. “Tracking the effect of the COVID-19 pandemic on the lives of American households.” Survey Research Methods 14(2):179-86.
- Kühne, Simon, Martin Kroh, Stefan Liebig, and Sabine Zinn. 2020. “The need for household panel surveys in times of crisis: the case of SOEP-CoV.” Survey Research Methods 14(2):195-203.
- Reardon, Leigh. 2022. “The impact of mail delays on timely research: experiences from the Healthy NYC survey panel ” in CIPHER 2022 Conference Presentation.
- Sakshaug, Joseph W, Jonas Beste, Mustafa Coban, Tanja Fendel, Georg-Christoph Haas, Sebastian Hülle, Yuliya Kosyakova, Corinna König, Frauke Kreuter, and Benjamin Küfner. 2020. “Impacts of the COVID-19 pandemic on labor market surveys at the German Institute for Employment Research.” Survey research methods 14(2):229-33.
- Sastry, Narayan, Katherine McGonagle, and Paula Fomby. 2020. “Effects of the COVID-19 crisis on survey fieldwork: experience and lessons from two major supplements to the US Panel Study of income dynamics.” Survey research methods 14(2):241.
- Scherpenzeel, Annette, Kathrin Axt, Michael Bergmann, Salima Douhou, Andrea Oepen, Gregor Sand, Karin Schuller, Stephanie Stuck, Melanie Wagner, and Axel Börsch-Supan. 2020. “Collecting survey data among the 50+ population during the COVID-19 outbreak: The Survey of Health, Ageing and Retirement in Europe (SHARE).” Survey Research Methods 14(2):217-21.
- Will, Gisela, Regina Becker, and Dominik Weigand. 2020. “COVID-19 lockdown during field work.” Survey Research Methods 14(2):247-52.
-
Keywords
calibration CATI coverage coverage bias cross-national surveys data linkage data quality European Social Survey experiment face-to-face face-to-face survey Facebook hard to reach populations incentives item nonresponse measurement measurement error mixed-mode surveys multitasking non-probability samples Nonresponse nonresponse bias nonresponse rates paradata PIAAC Probability sample probability samples QR codes rare populations response rate Satisficing social desirability Social media survey survey-taking climate survey data survey management survey methods Telephone survey telephone surveys total survey error unit nonresponse validity web survey Web surveys weighting
