

From Face-to-Face to Push-to-Web: Methodological Lessons from the Transition of the “Social Survey Austria”
Matthias Penker  University of Graz, Austria
Anja Eder University of Graz, Austria
Markus Hadler University of Graz, Austria
Penker M., Eder A. & Hadler M. (2025). From Face-to-Face to Push-to-Web: Methodological Lessons from the Transition of the “Social Survey Austria”. Survey Methods: Insights from the Field. Retrieved from https://surveyinsights.org/?p=21010
© the authors 2025. This work is licensed under a Creative Commons Attribution 4.0 International License (CC BY 4.0) 
Abstract
Numerous national and international survey programs, including general population surveys, have been shifting their mode of data collection from face-to-face to self-completion designs. Push-to-web designs are a particularly promising approach that, however, also introduces methodical challenges. In this paper, we address several of these challenges by providing in-depth empirical analyses of selection and measurement effects from a cross-sectional and longitudinal perspective (time trends across years and survey modes). We use data from the Social Survey Austria (SSA) 2018, 2023 and 2024, including questions from the Austrian implementation of the International Social Survey Programme (ISSP). The survey transitioned from Computer-Assisted Personal Interviewing (CAPI) to a mixed-mode approach, combining CAWI with a paper-and-pencil mail option, implemented as a push-to-web design. The findings show (1.) that the shift in modes particularly led to an increasing underrepresentation of individuals with lower educational attainment; that (2.) observed differences in response distributions between modes can be sharply reduced by accounting for selection effects; and that (3.) the analysis of changes in public opinion with cross-sectional data from surveys that shifted modes makes it necessary to carefully adjust for differential nonresponse. In sum, the findings speak in favour of design-based solutions that ensure comparability and data quality over time.
Keywords
CAWI, measurement effects, mixed-mode, push to web survey, selection effects
Acknowledgement
We would like to thank the anonymous reviewer for the constructive feedback and our colleagues from the Social Survey Austria consortium for the great collaboration, as well as everyone else who contributed to the generation of the data used in this article.
Copyright
© the authors 2025. This work is licensed under a Creative Commons Attribution 4.0 International License (CC BY 4.0)
1. Introduction
In recent years, general population surveys around the world have faced increasing methodological and operational challenges. Declining response rates, rising fieldwork costs and a growing shortage of trained interviewers have led many survey programs to reconsider traditional face-to-face, interviewer-administered approaches. In response, a widespread shift toward self-completion designs with a focus on web-based data collection has taken hold (de Leeuw, 2018; Dillman, 2017; Lynn, 2020). This transition carries important implications for data quality, including changes in sample composition, response behaviour and the comparability of longitudinal survey data.
Against this backdrop, we present and analyse the Austrian Social Survey (SSA) to examine the methodological and substantive effects of transitioning from face-to-face to a mixed-mode, push-to-web (P2W) design. The SSA is a probability based general population survey conducted since the 1980s by the University of Graz in cooperation with the Universities of Linz, Salzburg and Vienna. It includes both Austria-specific questions and thematic modules from the International Social Survey Programme (ISSP), facilitating comparative research on attitudes, values and behaviours across more than 40 countries. Since its inception, the SSA has been fielded in irregular intervals using random samples of the adult Austrian population.
Until 2018, the SSA relied exclusively on face-to-face data collection via Paper-and-Pencil Personal Interviewing (PAPI) and later Computer-Assisted Personal Interviewing (CAPI). Beginning in 2021, a mixed-mode design was introduced, combining CAPI and Computer-Assisted Telephone Interviewing (CATI) (see Penker & Eder, 2024), followed by a further shift in 2023 and 2024 to a P2W-approach that incorporated Computer-Assisted Web Interviewing (CAWI) and paper questionnaires administered by mail. The adoption of a P2W-design—in which respondents are invited to complete the survey online, while additional paper questionnaires might increase the likelihood for digitally excluded and older individuals to participate—reflects broader trends in survey methodology (Dillman, 2017; Lynn, 2020). While such approaches aim to reduce coverage and nonresponse errors by capitalizing on the selection effects of different modes (de Leeuw, 2018; Vannieuwenhuyze et al., 2014) they also introduce risks, particularly in the form of measurement effects that may bias response distributions and hinder cross-mode comparability (de Leeuw, 2005; Hox et al., 2015).
In light of these considerations, this article examines the implications of transitioning the SSA from CAPI to a self-completion P2W-design with regard to (1.) sample composition (i.e., selection effects), (2.) the impact of survey mode on response distributions (i.e., measurement effects), and (3.) the identification of time trends across years and survey modes. We report results of the implementation of the new P2W-design and its specific challenges, with a special focus on the years 2018 (CAPI), 2023 (P2W), and 2024 (P2W). We first present the specific sampling procedures and the characteristics of the achieved samples. We then analyse selection effects in terms of gender, age and education. Finally, we investigate survey mode effects both within and across years, highlighting the challenge of disentangling true shifts in public opinion from methodological variation introduced by changes in survey designs.
2. Methods and Analytical Approach
Our analysis proceeds in four steps. First, we give an overview of the changes in the specific study design and fieldwork procedures of the SSA/ISSP to inform about key methodological aspects. Second, we examine selection effects and the resulting sample compositions across all years and survey modes for gender, age and education, which we benchmark against official statistics data. Based on these distributions, we calculate the Average Absolute Relative Bias (AARB), which quantifies the average of the relative bias (Felderer, 2024) (see Equation 1).
(1) 
 denotes the sample-based estimate of the percentage for each category of a variable, while
  represents the benchmark from official statistics, reflecting the population-level percentage of category
  ,
,  denotes the number auxiliary variables used. Absolute differences are averaged to compute the AARB, which is then compared across years and survey modes to evaluate changes in average relative bias for the three key demographic variables, gender, age and education, resulting from the switch from CAPI to P2W-design.
Third, we look into different mode effects. We estimate measurement effects for the individual P2W-designs separately for 2023 and 2024 by comparing responses between CAWI and the paper-and-pencil mail mode for various substantive questions on different attitudinal and behavioural aspects. We selected 137 variables in 2023 and 138 variables in 2024 which are used as dependent variables in linear regression models. We estimate two models for each dependent variable: one unadjusted using solely the survey mode as predictor, and a second adjusting for selection effects based on several socio-demographic variables: gender, age, education, work-status, marital status, place of residence (urban – rural), federal state of residency, religious affiliation, household-size and country of birth. This set of variables comprises well-established socio-demographic predictors in sociological research and is assumed to (partially) capture selection effects, while not being substantially affected by measurement mode effects. Although we cannot definitively confirm the mode-insensitivity of these selected covariates, prior research suggests that measurement effects tend to be smaller for socio-demographic variables (e.g. Roberts & Vandenplas, 2017). All estimates—unadjusted and adjusted— for SSA 2018 and SSA 2023 are design weighted, and thus account for unequal selection probabilities. In 2024, due to the use of a simple random sample with equal selection probabilities, no design weights were applied. We report the magnitude and significance of the measurement effects in form of standardized regression coefficients and p-values, and compare them between the unadjusted and adjusted models.
Fourth and finally, we investigate time trends for six repeated questions from the SSA that are available across all three survey years. These six variables are used as dependent variables in linear regression models. For each, we estimate two models: one unadjusted using only the survey year as a predictor (with 2018 as the reference category), and a second that adjusts the estimates using post-stratification weights, as well as the same set of covariates applied in step three. This adjustment accounts for the over- and underrepresentation of different socio-demographic groups and helps to mitigate potential biases from differential nonresponse across survey modes and designs (Felderer et al., 2019; Kreuter & Olson, 2011). Again, unadjusted and adjusted estimates for SSA 2018 and SSA 2023 are also design-weighted to account for unequal selection probabilities.
3. Fieldwork and Sample Compositions 2018, 2023 and 2024
Table 1 provides an overview of the sampling procedures across the three selected survey waves. Each wave includes two different ISSP-Modules and one Austria-specific SSA. The total number is therefore approximately 210 questions per survey wave. Fieldwork was conducted and organized by the market research institute IFES; the fieldwork itself took about 2.5 months each. All data, including field reports and documentation, are publicly accessible at AUSSDA (Austrian Social Science Data Archive).
Originally, from the 1980s onwards, SSA data were collected in face-to-face interviews. In 2023, a push-to-web approach was implemented using the same household-based address database as in previous years—a stratified random sample drawn from Austrian Postal Service address data, with stratification based on NUTS-3 regions. Hence, respondents are still recruited offline by random sampling. As the address data were households, respondents were finally selected by the next-birthday method. To encourage participation, a non-conditional €5 cash incentive was provided upfront, along with a conditional €10 multi-purpose gift voucher upon survey completion. A first reminder was sent eight days after the initial contact by mail, followed by a second reminder after 21 days by mail, which included a paper questionnaire to increase response rates and participation of the less tech-savvy. As the correctness of the next-birthday method could not be checked by an interviewer, we tried to evaluate it using additional questions about the birthdays (months and year) of all persons living in the household, as well as the question about the year and month of birth of the respondent. Respondents were also asked twice to ensure that only the person with the next birthday completed the questionnaire. The analysis of the aforementioned control questions indicated that, in total, 241 cases had to be excluded on the basis that they were not the subsequent person in the household to have a birthday, highlighting the challenges of using this technique for within-household selection in self-administered survey designs (Olson et al., 2014).
Another methodological shift occurred in 2024, when the central population register was used as the sampling frame, allowing for the inclusion of named individuals rather than just household addresses. Consequently, the next-birthday method, which was applied in 2023, was dropped. This approach also allowed for a simple random sampling. All other procedural steps regarding the mail reminders, paper questionnaire and incentives remained the same as in 2023. In the course of data cleaning and quality control, 105 cases were excluded because they had >30% missing data or completed the questionnaire in less than 20 minutes and were therefore identified as „speeders”. An analysis of the sociodemographic background of this group revealed no substantial differences compared to the overall sample. In the 2023 wave, such quality controls had not yet taken place.
While 51% of sampled individuals participated in 2018, response rates declined to 28% in 2023 and 41% in 2024, which can partly be explained by a higher share of invalid responses that had to be excluded due to the incorrect selection within households and the speeding checks. Despite this decline both rates remain satisfactory and are consistent with those reported in other survey programmes (Hoven et al., 2025). However, it remains somewhat unclear why the response to the 2024 survey was exceptionally high. It is likely related to the module topics—digital societies and health—which may have attracted greater interest. Additionally, the use of a new sampling frame that allowed for directly addressing respondents likely contributed to the high response rate in 2024.
Table 1. Sampling Characteristics Social Survey Austria 2018, 2023 and 2024
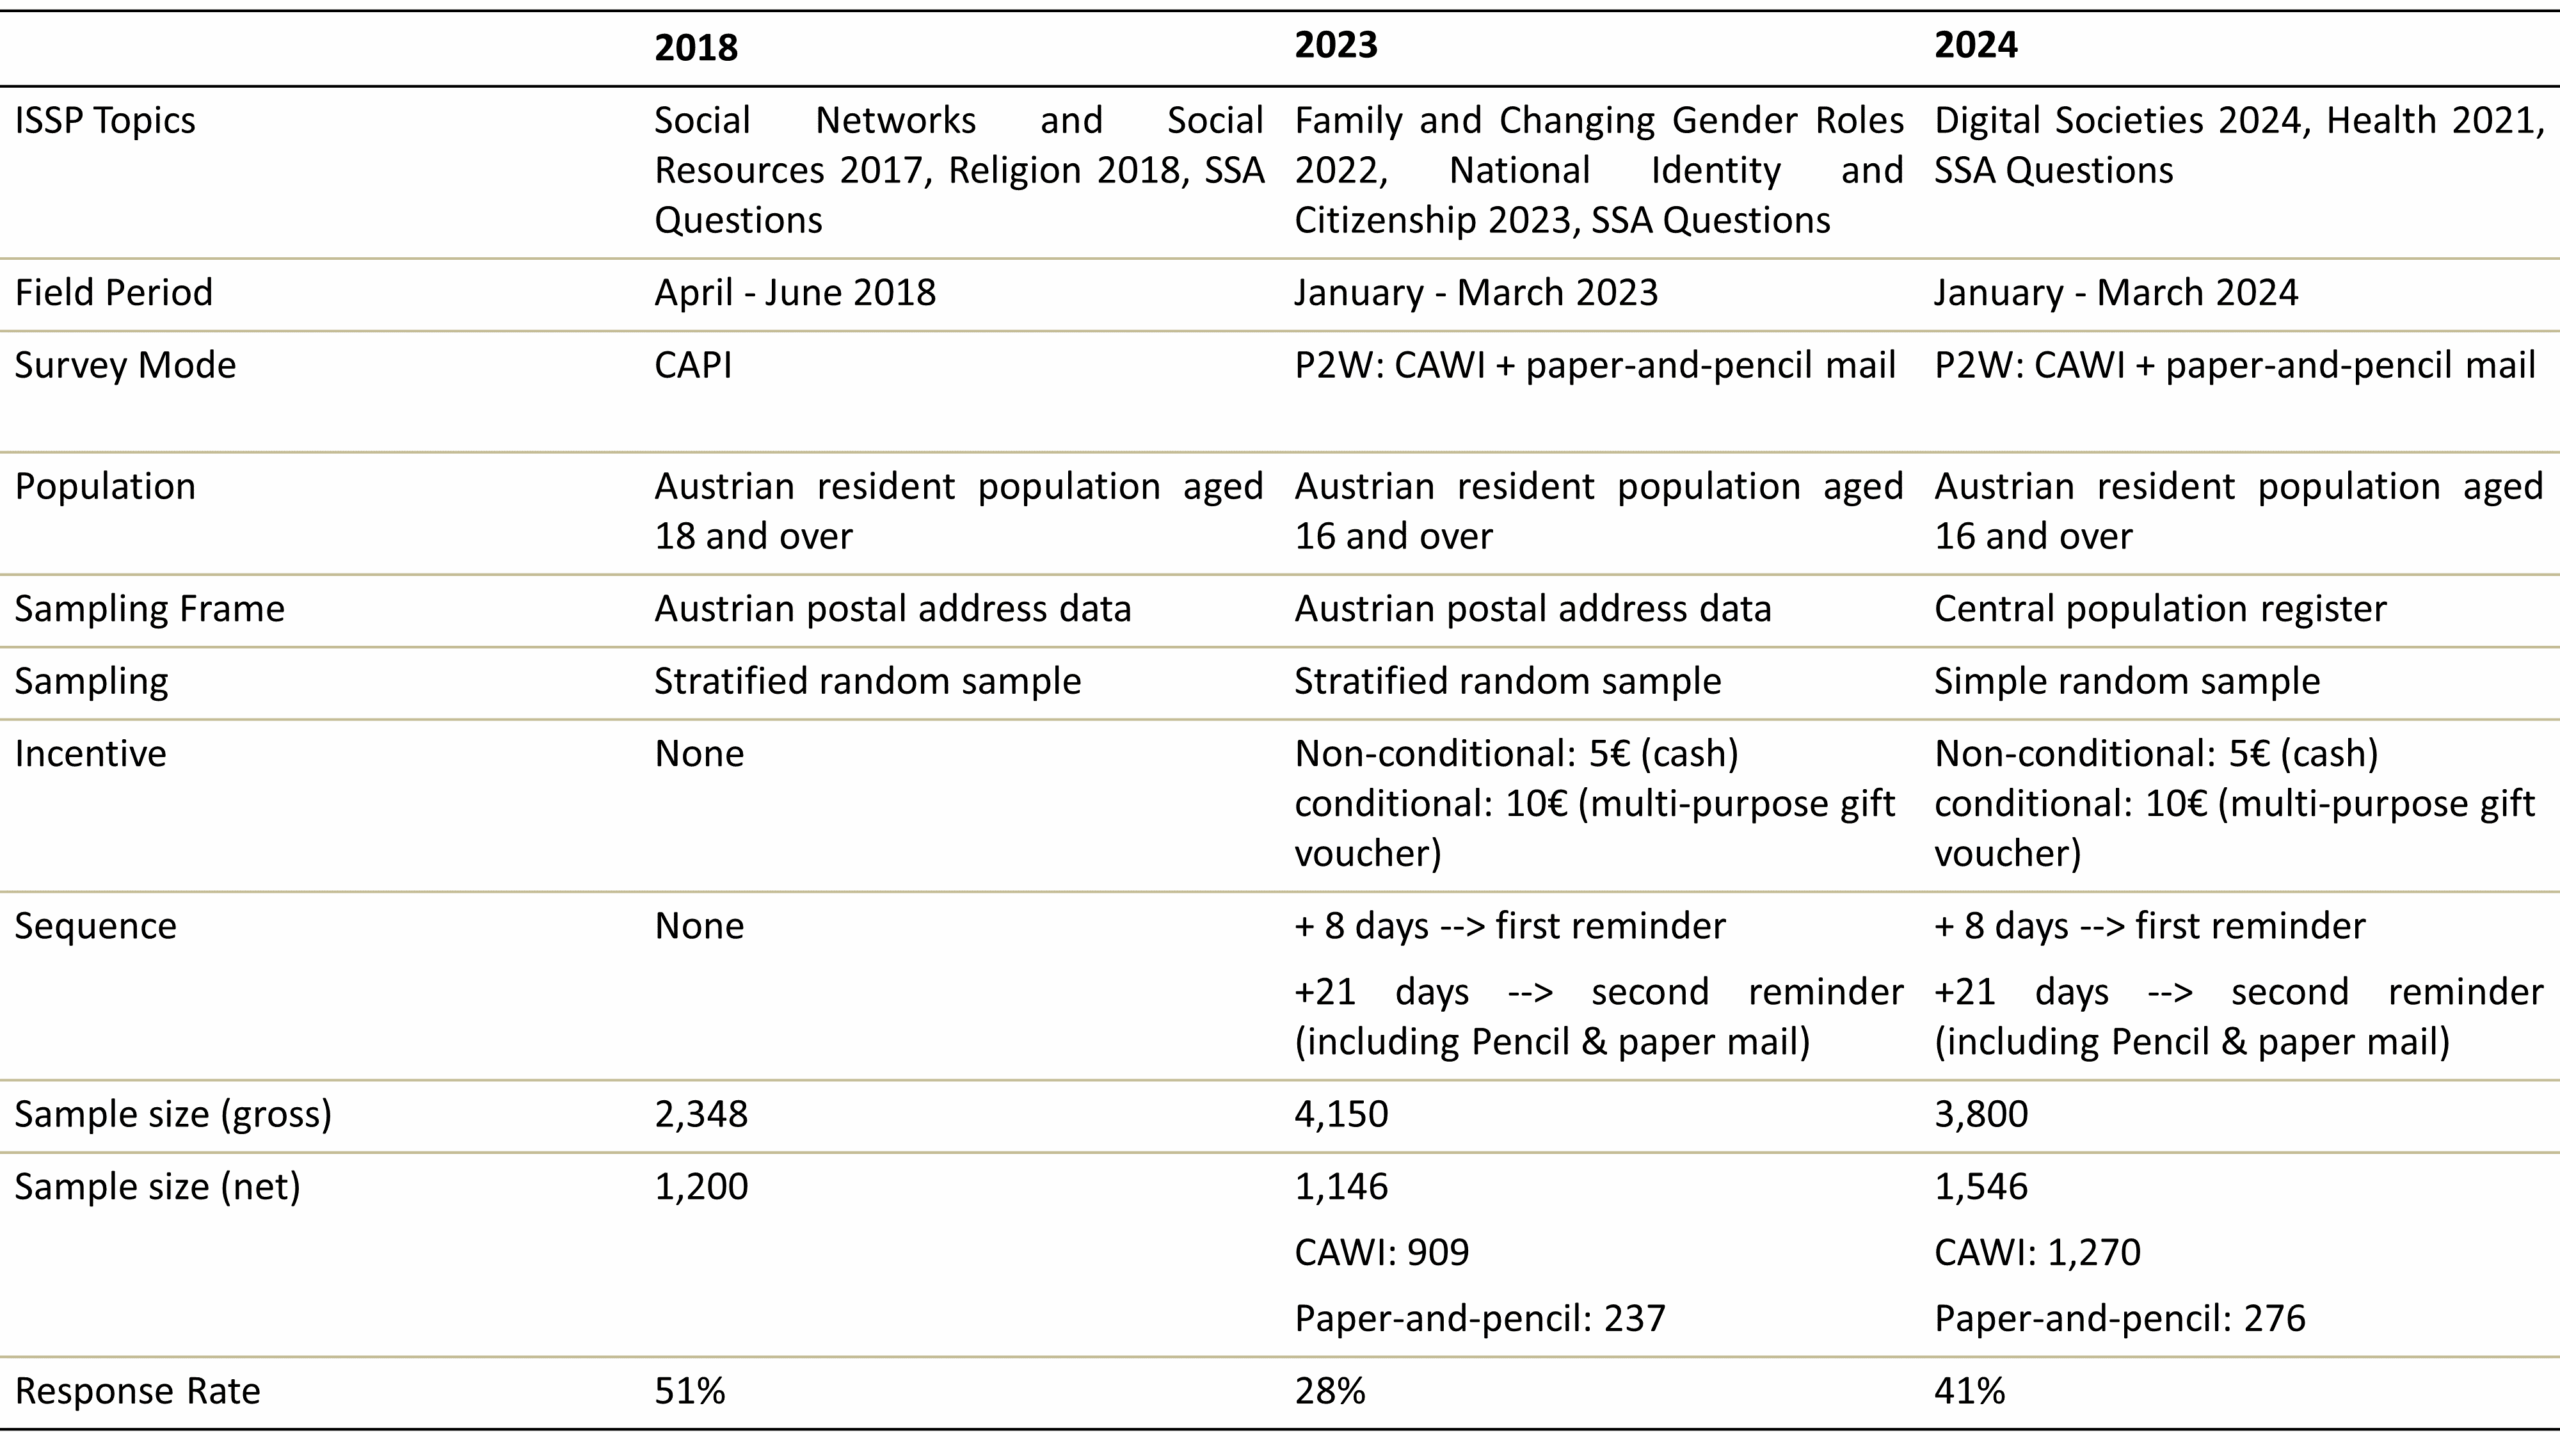
Sources: see field reports at AUSSDA for 2018 (https://doi.org/10.11587/ERDG3O), for 2023 (https://doi.org/10.11587/RJU0KE) and for 2024 (https://doi.org/10.11587/0VKC5X). Note: P2W = push-to-web, CAPI = Computer Assisted Personal Interview, CATI = Computer Assisted Telephone Interview, CAWI = Computer Assisted Web Interview
In the next step, we compare the sample composition in terms of respondents’ gender, age and educational attainment across the three survey waves with the distribution of these characteristics according to official statistics (see Table 2). With regard to gender, the most optimal distribution is observed in the P2W-design from 2024, where individual address data was used as a sampling frame. Women were particularly overrepresented in the P2W-design in 2023 in the mail mode using the next-birthday method for selecting respondents within households. To a lesser extent, women also show a higher participation in the CAPI mode from 2018.
The age distributions in Table 2 reveal that, despite minor deviations, a reasonably solid alignment with the population was achieved across all survey waves. For both 2023 and 2024, the addition of the mail mode to the CAWI mode played a key role in this outcome, as it primarily enabled or encouraged participation among individuals in the older age groups.
Starting in 2023, the introduction of the P2W-design resulted in a pronounced educational bias, with individuals holding lower educational qualifications significantly underrepresented—a demographic pattern commonly observed in P2W and other self-completion mixed-mode designs (Luijkx et al., 2021; Stein et al., 2025; Wolf et al., 2021). Notably, without the inclusion of an additional paper-and-pencil mail mode, the underrepresentation of individuals with lower educational attainment would have been even more pronounced.
Table 2. Socio-demographic Composition Social Survey Austria 2018, 2023 and 2024 (in %)
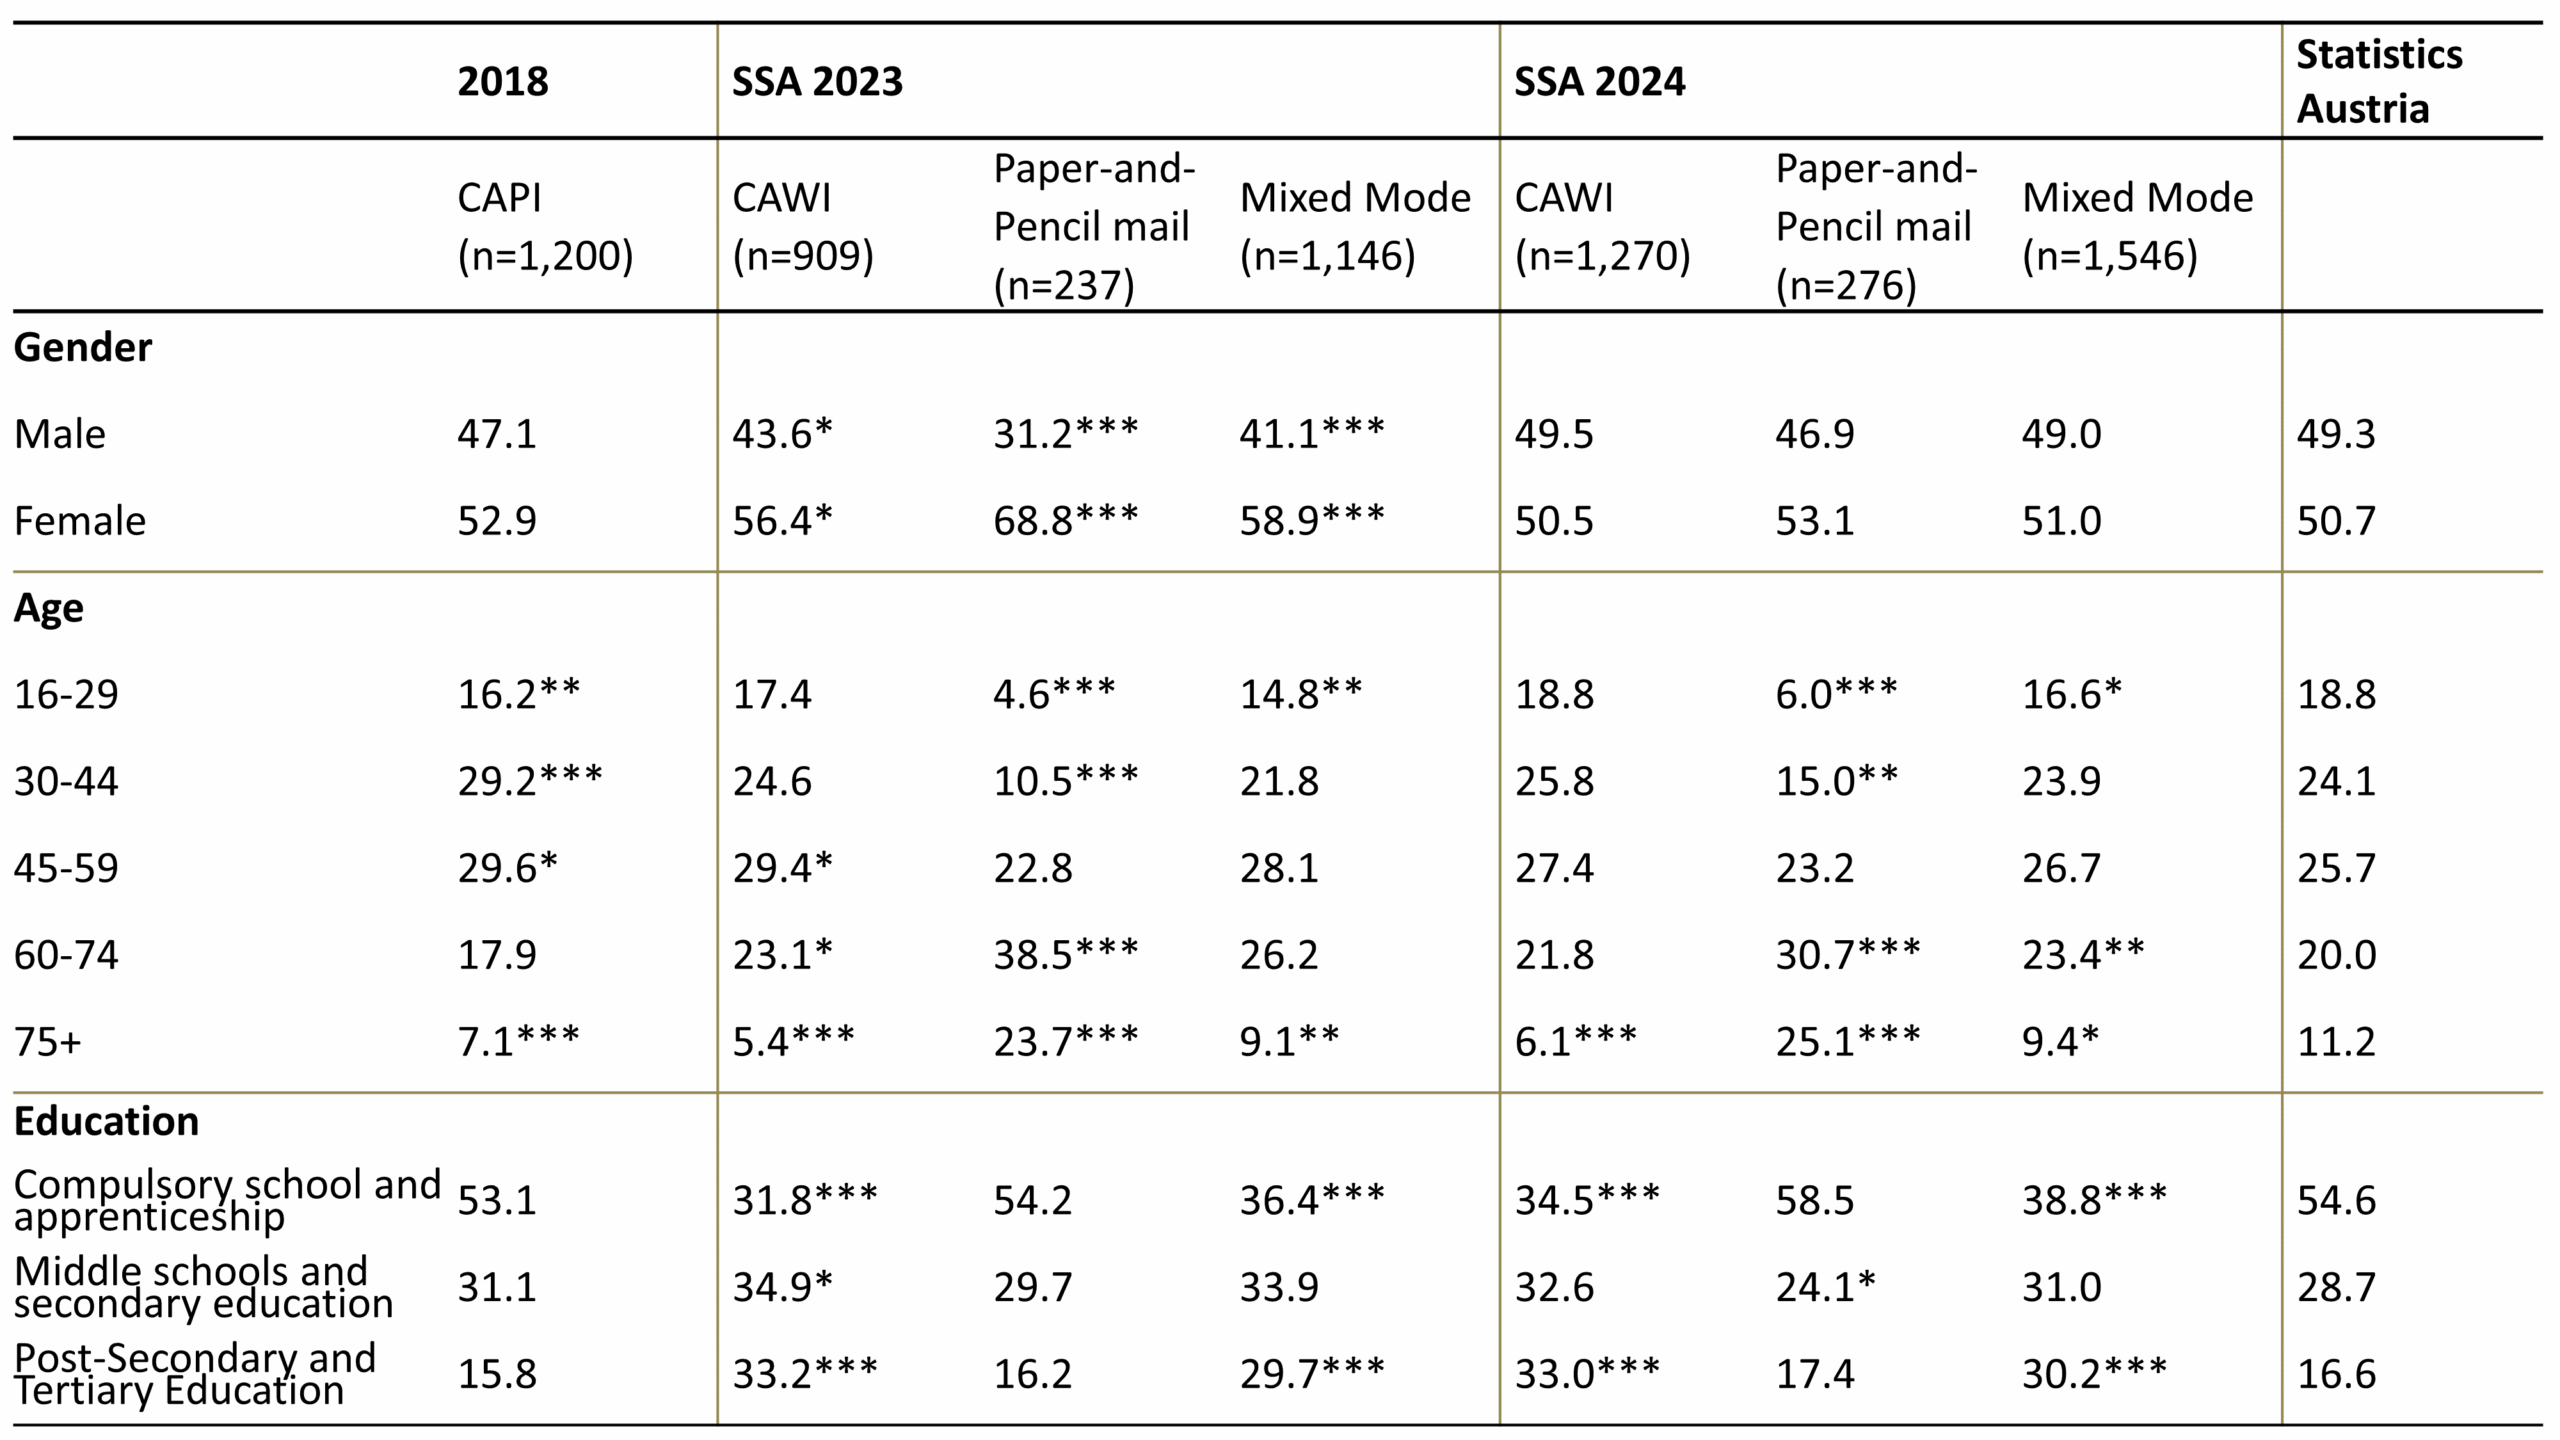
Sources: Hadler et al. (2019, 2024a, 2024b); Gender and Age: (Statistik Austria, 2022a); Education: (Statistik Austria, 2022b). Note: SSA = Social Survey Austria, Estimates for SSA 2018 and SSA 2023 are weighted using design weights to account for unequal selection probabilities. In 2024, due to the use of a simple random sample with equal selection probabilities, no weights were applied. Two-tailed z-tests were applied for each cell to determine whether the values differ from the population values in the official statistics. (Agresti, 2002). *p < 0.05, **p < 0.01, ***p < 0.001. SSA 2018 was tested against the population percentages from 2018, SSA 2023 and 2024 against percentages from 2022.
Based on the comparison of the distribution of socio-demographic characteristics of the survey respondents with those of the official statistics, an average relative bias was calculated (see section 2). Table 3 summarises the results of the Average Absolute Relative Bias (AARB) for gender, age and education within all three years. For 2023 and 2024 AARB were calculated separately for the CAWI only sample and for the final mixed-mode sample. Differences in AARB between CAWI and the mixed-mode arise from the inclusion of the mail mode, for which we do not report a separate AARB.
The CAPI-design of 2018 had the lowest AARB and, therefore, the best alignment with the population for the three socio-demographics used in this analysis. Contrary, we find the worst fit for the CAWI compositions in 2023 and 2024. Corresponding with the goal of P2W-surveys, the AARB could be reduced by offering the additional paper-and-pencil mail mode, which functioned as a corrective of CAWI by integrating underrepresented groups—such as older individuals with lower educational attainment—into the sample. This also applies to other critical variables, such as individuals’ internet usage frequency (not shown in Table 3). The 2023 Austrian Microcensus revealed that approximately 5% of Austrians indicate that they had not used the internet in the past three months (Statistik Austria, 2024). SSA 2023 and 2024 included a similar question, but with a longer reference period of 12 months. This proportion was well approximated by the P2W-designs (2023: 6.7%, 2024: 4.8%), whereas a CAWI-only design would have substantially underrepresented this group of internet non-users.
Table 3. Average Absolute Relative Bias for Age, Gender and Educational Attainment
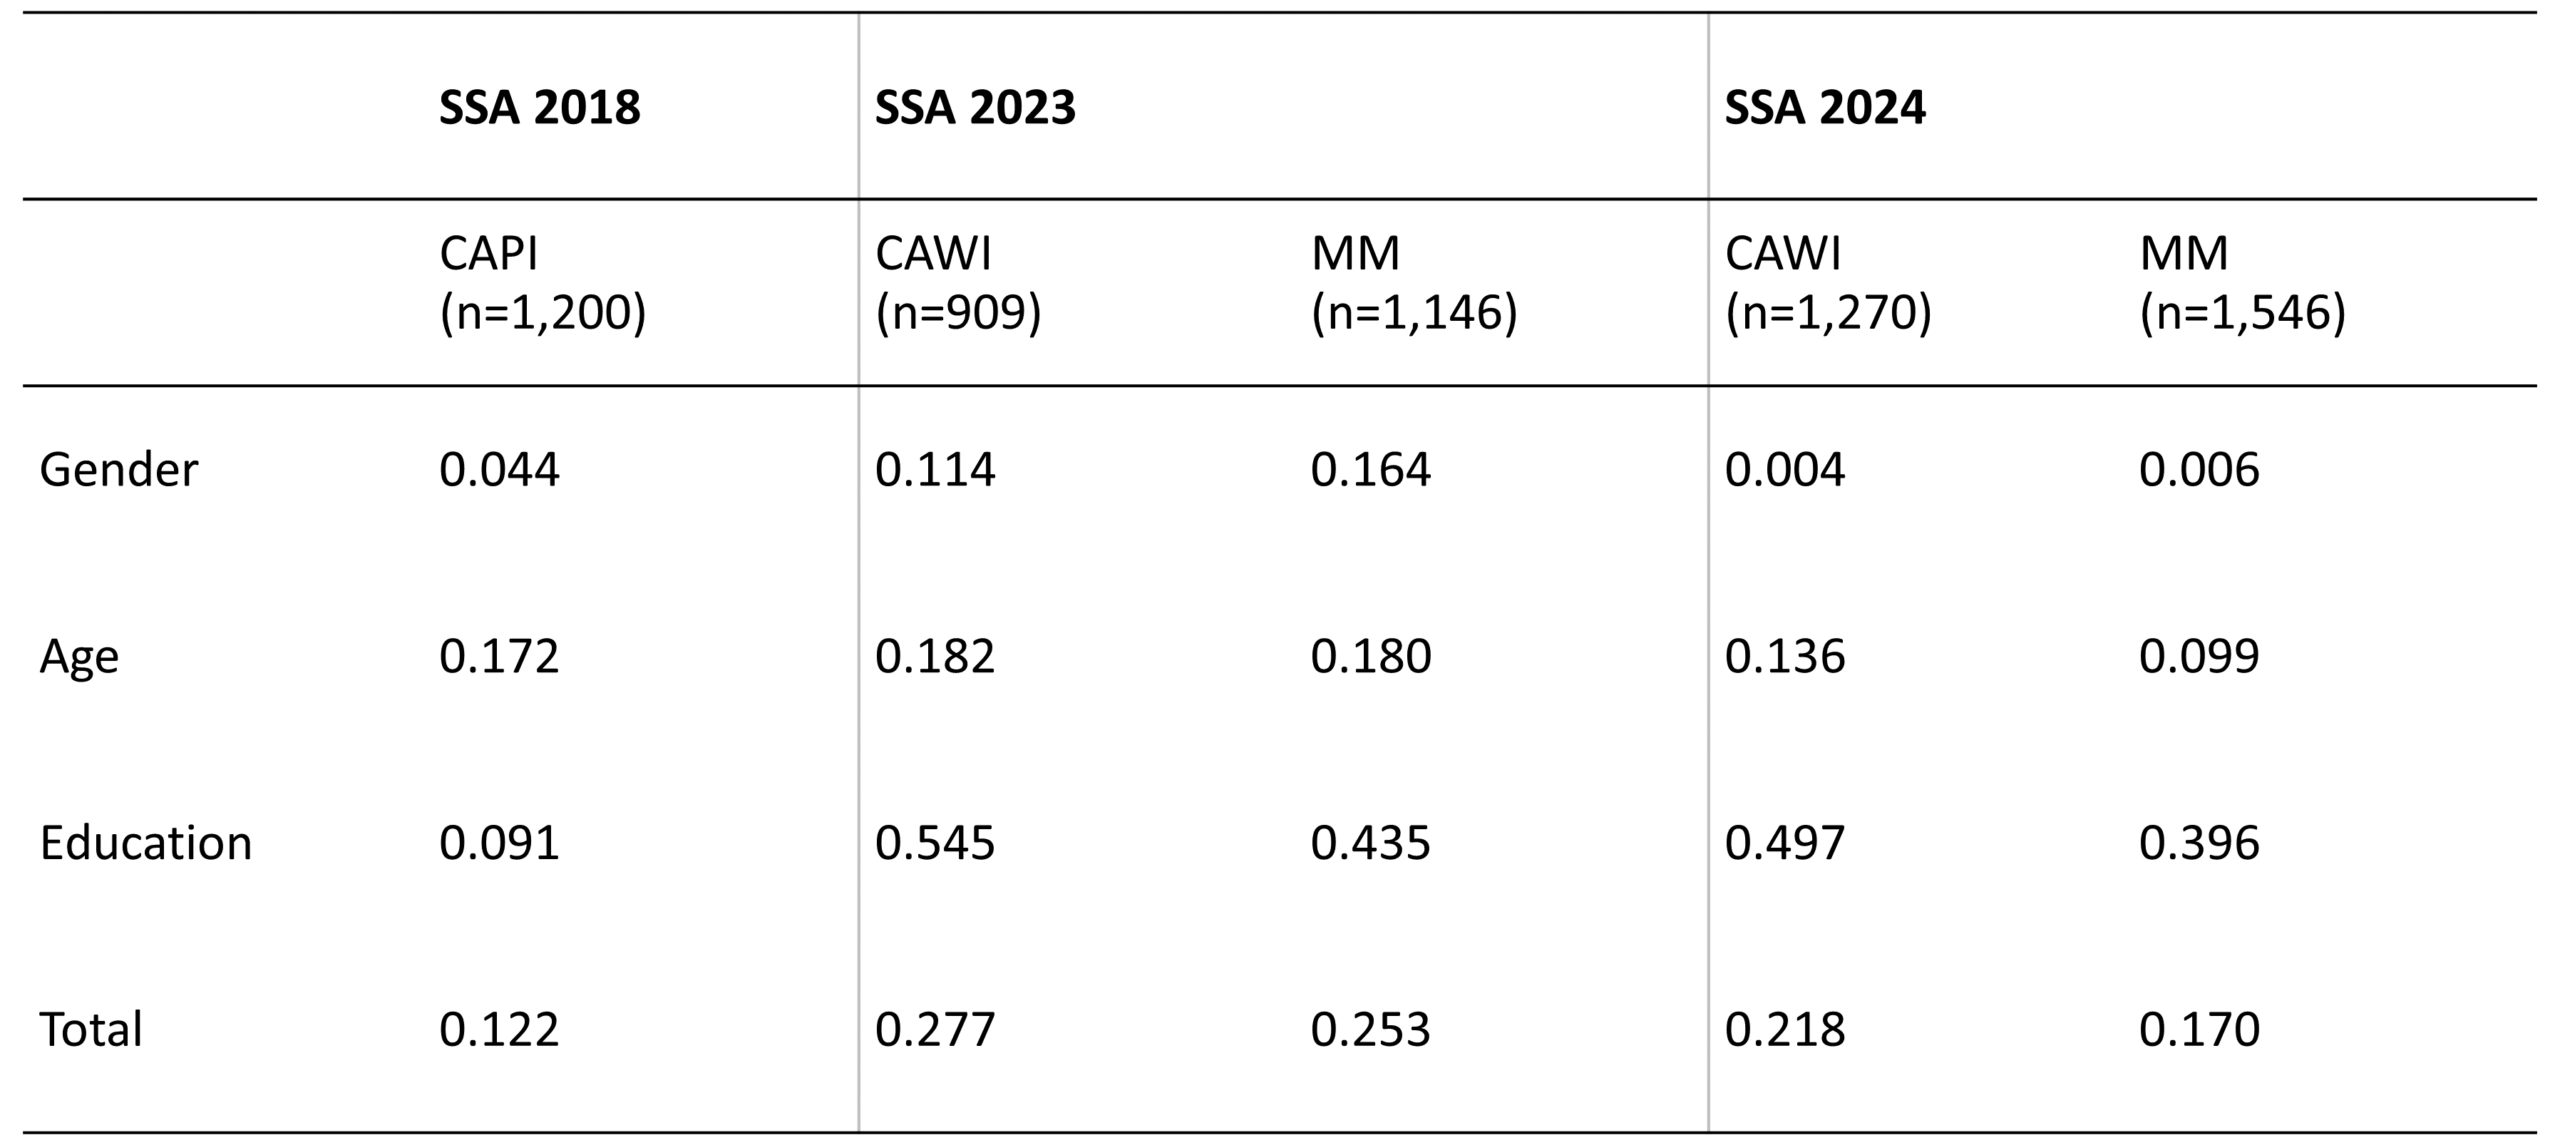
Hadler et al. (2019, 2024a, 2024b). Note: SSA = Social Survey Austria; MM = Mixed-Mode; CAWI = Computer-Assisted Web Interviewing. Estimates for SSA 2018 and SSA 2023 are design weighted to account for unequal selection probabilities. In 2024, due to the use of a simple random sample with equal selection probabilities, no weights were applied. The AARB is only approximate, because the bias for 2023 and 2024 was evaluated on the population percentages from 2022, while SSA 2018 was evaluated using corresponding population percentages from 2018.
All in all, the switch from CAPI to a P2W-design resulted in an increased bias. As shown in Table 3, this was however primarily driven by education (an underrepresentation of individuals with lower educational attainment). At the same time, however, the best fit for gender and age was achieved by the final P2W-design in 2024. Not properly adjusting for over- and underrepresentation of certain groups, hence, can introduce biases into estimates and compromise cross-sectional analysis and comparisons across time. To address the issue in more detail, we examine mode effects on response distributions in the next section.
4. Mode Effects: Cross-Sectional Comparisons
Mixed-mode designs aim to improve the representation of the target population compared to single-mode designs by leveraging the ability of different modes to reach specific demographic subgroups (Bosnjak, 2017; de Leeuw, 2018). While such selection effects are considered desirable outcomes of mixing modes, there is a simultaneous risk of unintended measurement effects. These occur when the mode significantly and substantively influences response tendencies or the measurement of latent constructs (Hox et al., 2015; Vannieuwenhuyze et al., 2014). In cross-sectional studies, it is particularly difficult to disentangle desirable selection effects from unwanted measurement effects due to confounding (Schouten et al., 2013; Vannieuwenhuyze, 2013). This is because different individuals select different modes and simultaneously exhibit distinct response tendencies. Consequently, observed differences between modes may be misinterpreted as measurement effects, when they actually result from selection processes (Vannieuwenhuyze, 2013). Therefore, when referring to measurement effects in the following, we refrain from a causal interpretation and acknowledge that the term “mode differences” may be more accurate, given the cross-sectional design of the SSA.
To evaluate the potential magnitude of measurement mode effects, we estimated the differences between CAWI and the mail mode for 137 substantive items in 2023 and for 138 items in 2024. For each outcome, we report (1.) the unadjusted difference between the two modes, and (2.) the difference adjusted for several socio-demographic variables (see method section).
Figure 1 visualises the results of analysing the mode effects. The upper panel presents bar plots indicating the number of statistically significant (p < 0.05) differences between modes. The lower panel displays the distribution of all point estimates, which quantify the differences between the two modes as standardized regression coefficients. In both years, several across mode comparisons of specific items resulted in statistically significant differences. However, after adjusting for selection effects, the number of statistically significant differences was substantially reduced. Moreover, the distribution of regression coefficients became narrower, as controlling for selection effects also reduced the magnitude of several mode differences.
Figure 1. Measurement Mode Effects SSA 2023, 2024
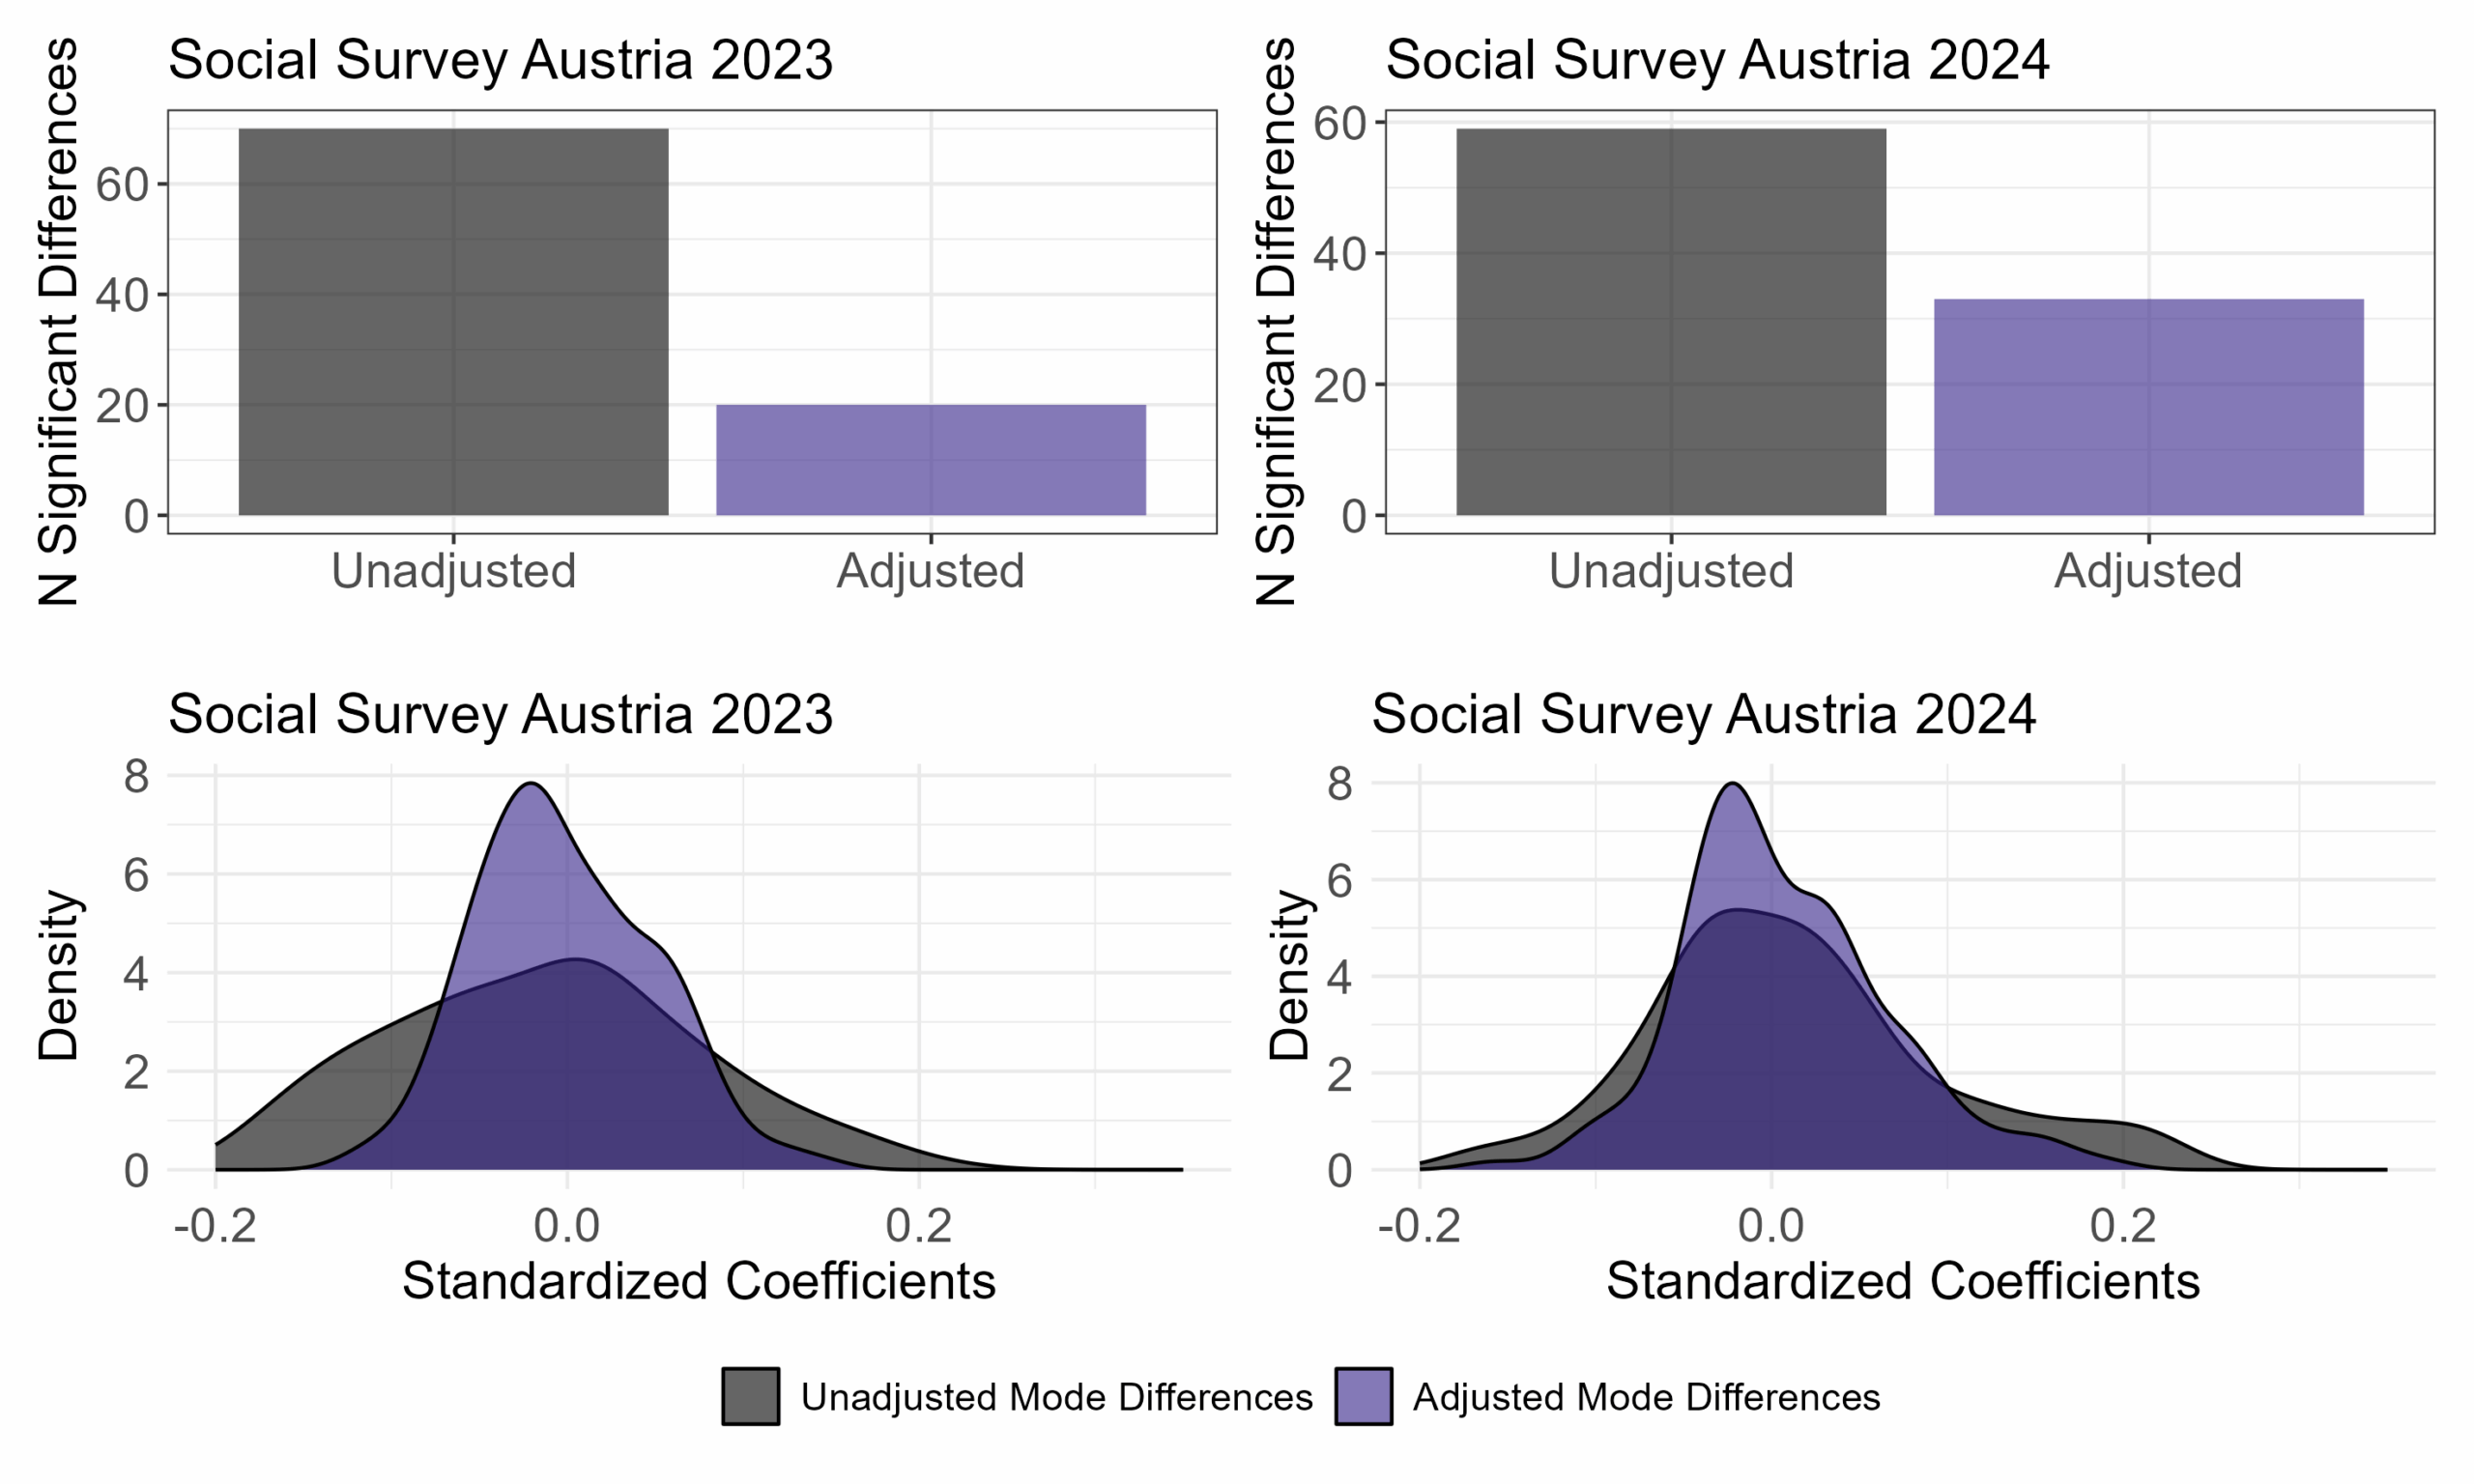
Source: Hadler et al. (2019, 2024a, 2024b). Note: The panel on the right displays the empirical density function of all point estimates extracted from linear regression models which quantify the differences between CAWI and the paper-and-pencil mail mode in a given year (2023: 137 variables; 2024: 138 variables) as standardized regression coefficients. Alpha level = 0.05. Estimates for SSA 2018 and SSA 2023 are design weighted to account for unequal selection probabilities. In 2024, due to the use of a simple random sample with equal selection probabilities, no weights were applied. Adjusted models include several socio-demographic covariates: gender, age, education, work-status, place of residence (urban – rural), federal state of respondents, religious affiliation, household-size and place of birth.
In order to better understand mode differences, it is necessary to consider the content of the individual questions as well. Due to the large number of significant differences and space limitations, we provide only a high-level summary of the results, without an exhaustive overview. We observe that significant differences between CAWI and mail respondents appear to be systematic: In SSA 2023, respondents in the mail sample held more conservative views on gender roles, expressed stronger nationalistic attitudes, were more critical of the government, and reported higher levels of concern about rising prices and affordable housing. In SSA 2024, mail respondents exhibited lower levels of digital literacy, had less access to and made less frequent use of the internet and were more likely to express right-leaning political orientations.
The remaining systematic differences after adjusting for selection effects could derive from various causes. First, the presence of additional demographic covariates that were not accounted for makes it likely that some results are influenced by omitted variable bias. Including a more comprehensive set of covariates may further shift the distribution of standardized differences closer to zero.
Second, the differences cannot be explained by other demographic covariates and therefore reflect selection effects themselves. For example, we find that paper-and-pencil respondents use the internet less frequently than their CAWI counterparts and have significantly lower levels of digital literacy, even after adjusting for several covariates. Thus, it is more likely that some of the significant differences between both modes are not due to unwanted measurement effects but instead reflect desirable selection effects, which align with the primary aims of using mixed-mode designs. Third, both explanations simultaneously account for the remaining systematic differences.
5. Mode Effects: Longitudinal Comparison
We continue by examining time trends for six SSA repeat items included in the 2018, 2023 and 2024 surveys. The six survey questions (see Figure 2) are typical SSA-questions and were selected on the basis of data availability and assumptions about variables that are more or less likely to change over time. These relate to socio-economic status and issues of personal and social well-being. Time-comparative analyses of these survey questions give a good indication, if differences in sample composition across survey waves play a role in observed differences of response distributions. Hence, the upper panel of Figure 2 shows the unadjusted trends, estimated by regressing each variable on the survey-year, with 2018 as the reference category and design-weighted to account for different selection probabilities in 2023 and 2024.
The lower panel presents estimates for the same variables, covariate adjusted (see Section 2 or Figure Notes) and weighted using design (2018 and 2023) and poststratification weights (all years). This helps to account for the over- and underrepresentation of different socio-demographic groups and helps mitigate potential bias due to differential nonresponse across survey modes and designs (Felderer et al., 2019; Kreuter & Olson, 2011). Appendix Figure A.1 displays the response distributions of the six dependent variables and Appendix Table A.1 shows additional statistical tests for differences in means across survey modes and designs.
Figure 2. Estimates of change in selected SSA repeat-items over time (compared to 2018 unadjusted and adjusted)
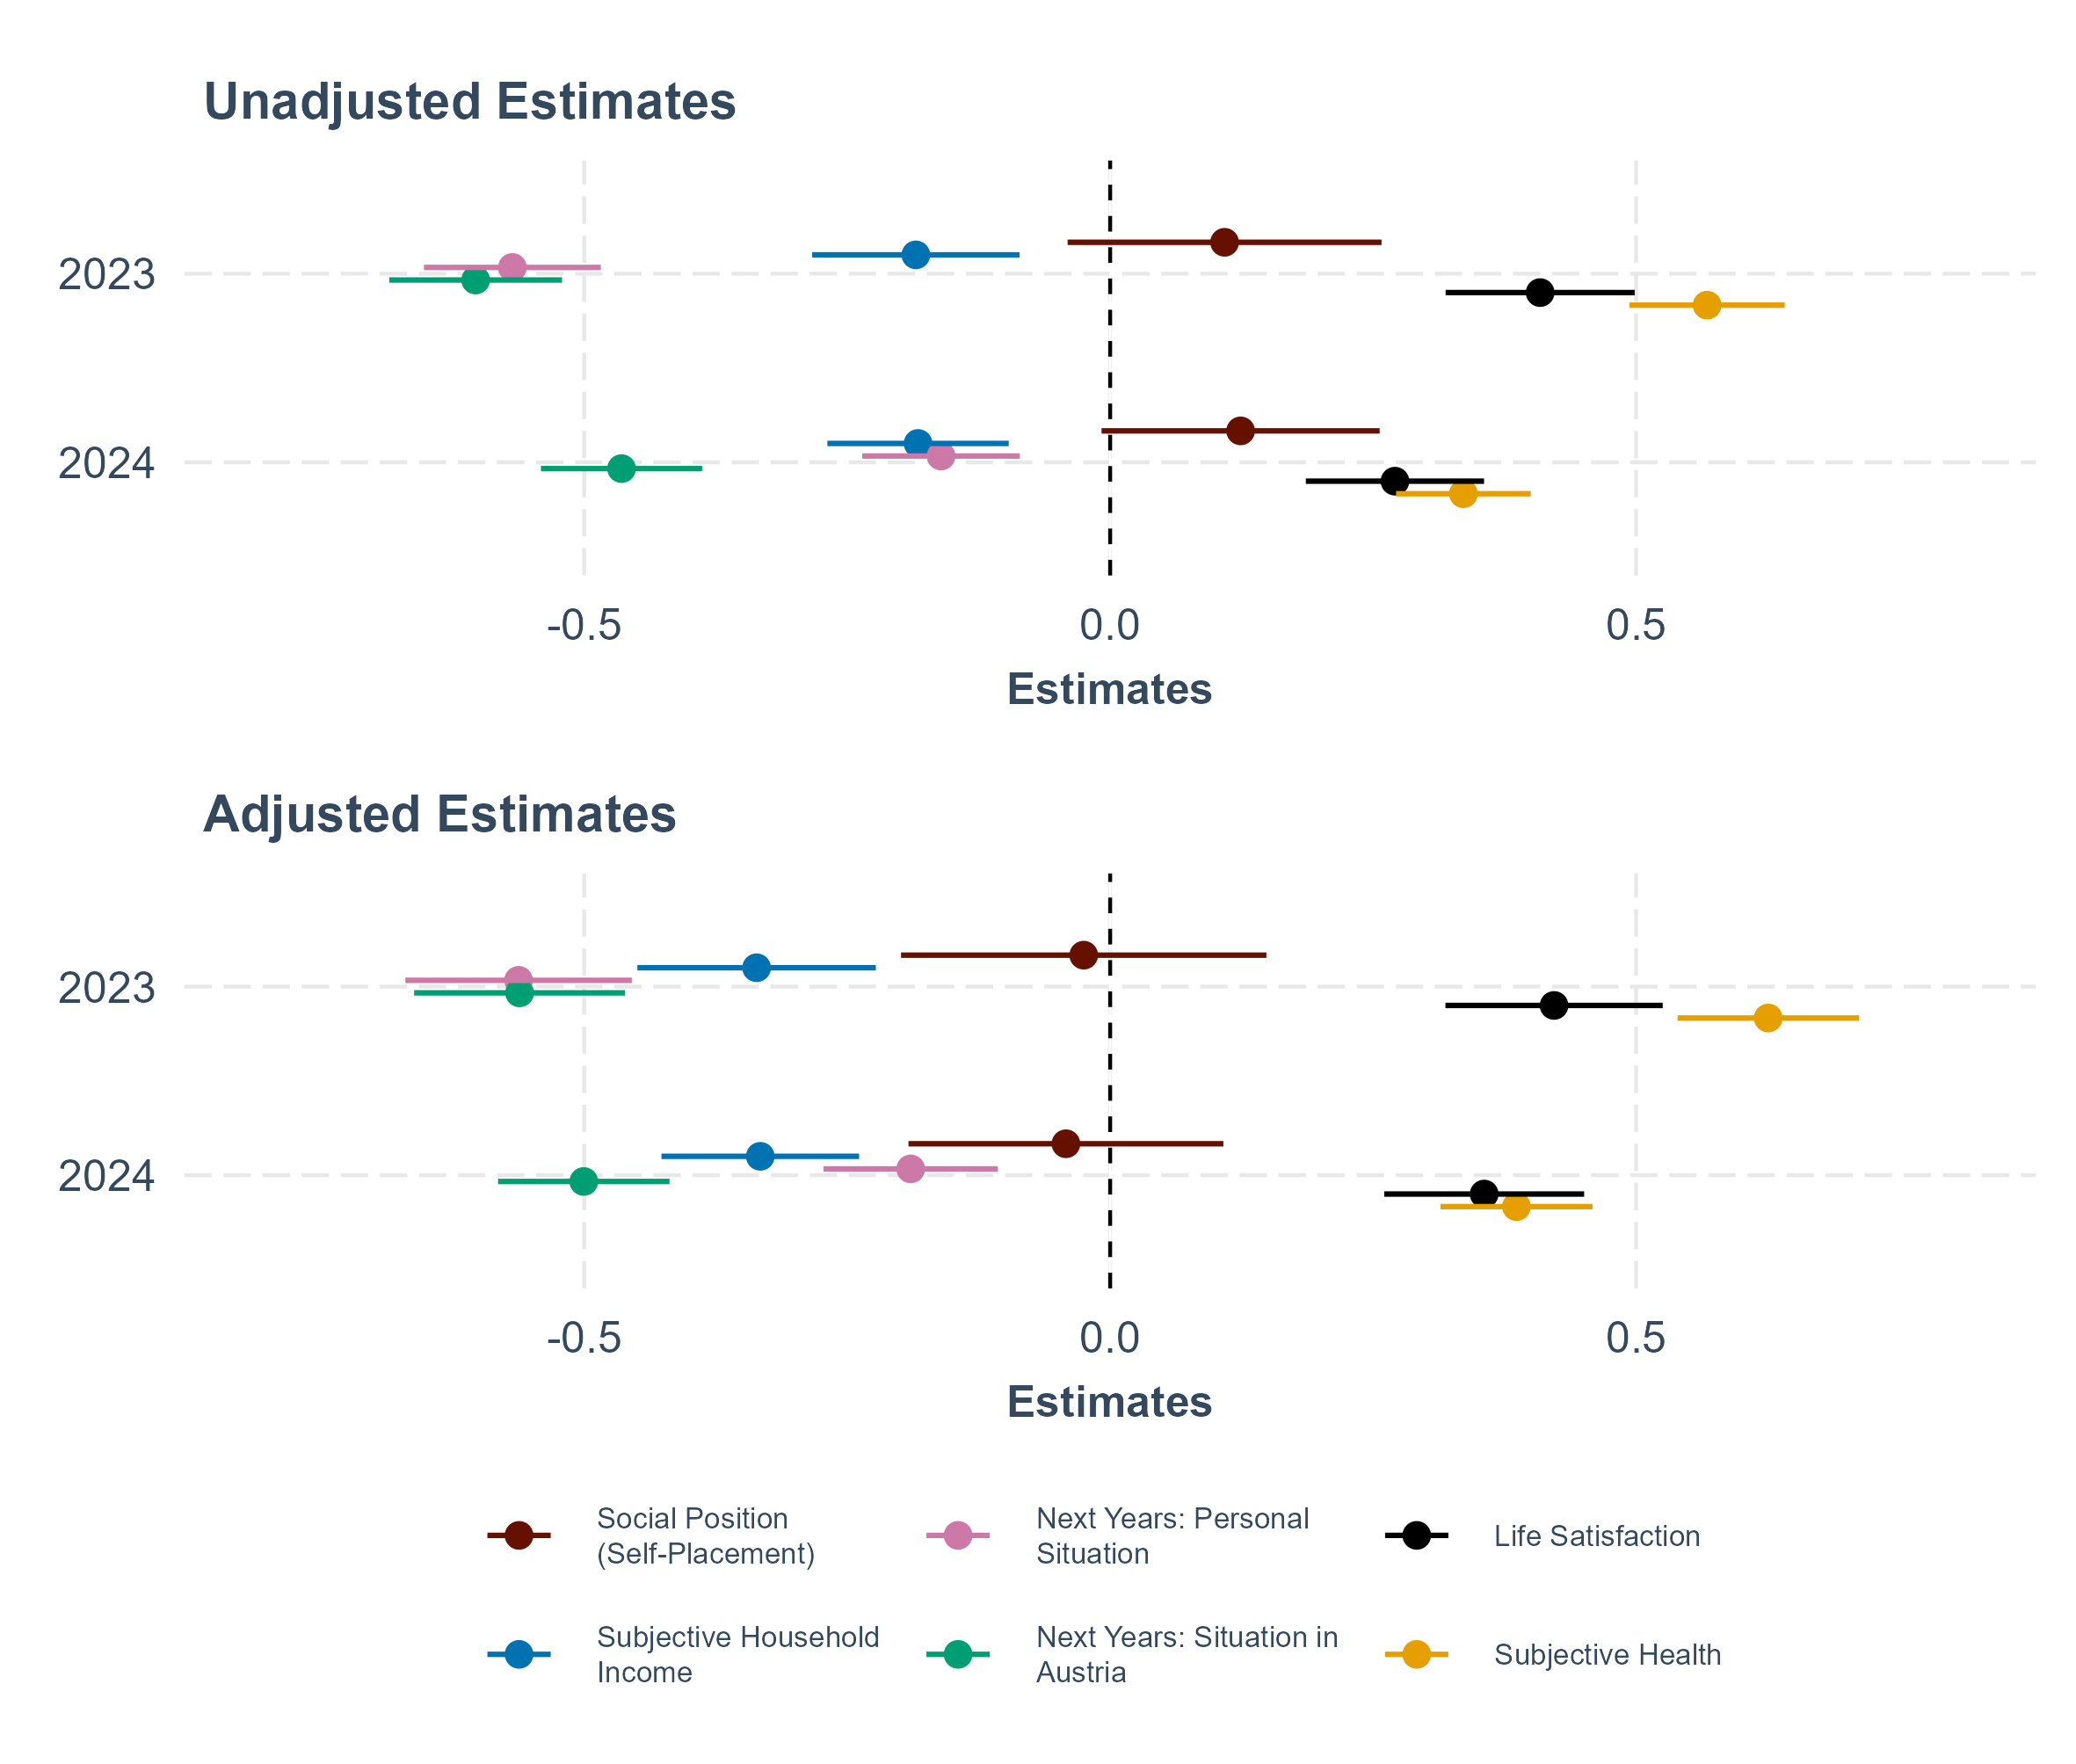
Source: Hadler et al. (2019, 2024a, 2024b). Note: Point estimates in both panels display the difference between survey-years in form of unstandardized regression coefficients for 2023 and 2024, both compared to the reference category 2018. The lines around the point estimates represent 95% confidence intervals. Estimates for SSA 2018 and SSA 2023 in the upper panel are design weighted to account for unequal selection probabilities. In 2024, due to the use of a simple random sample with equal selection probabilities, design weights equal 1. Models in the lower panel are weighted using both design and poststratification weights in 2018 and 2023. In 2024, following the shift to a simple random sample, only poststratification weights were applied. All models in the lower panel are additionally adjusted for the covariates gender, age, education, work-status, place of residence (urban – rural), federal state of respondents, religious affiliation, household-size and place of birth
We begin by examining trends in the two questions of socio-economic status, of social position (self-placement) and subjective household income Considering only the unadjusted model, the average social position slightly increased in 2024 compared to 2018, suggesting a modest trend of upward mobility (p < 0.10) (see unadjusted models in Figure 2). However, when comparing unadjusted and adjusted estimates, we observe that weighting and adjusting for covariates shifts the average difference toward zero and renders it statistically insignificant. Continuing with subjective household income (“making ends meet”), we find that both, the unadjusted and adjusted model suggest a worsening of the average financial situation between 2018 and 2023 or 2024. However, without adjustment this trend may be underestimated, as shown in the weighted and adjusted model of Figure 2.
Next, we see that the perceptions of both, the personal and general circumstances in Austria worsened significantly in 2023 and 2024. This drop occurs on both unadjusted and adjusted estimates. Hence, no substantial differences emerge when comparing unadjusted and adjusted estimates. Hence, differences in the sample compositions do not have a verifiable impact on the time pattern of these survey questions. Finally, we examine trends in two health-related indicators: general life satisfaction and subjective health status. Both indicators show a decline, indicating a decrease in average life satisfaction and perceived health across time. As with subjective household income, comparing unadjusted and adjusted estimates reveals that failing to account for nonresponse patterns likely leads to an underestimation of these trends.
The trends discussed above can be attributed to (at least) three potential causes and an unexplained error, each contributing simultaneously, as expressed in Equation 2.
(2) 
As discussed above, self-completion designs tend to attract different socio-demographic groups compared to CAPI (Dillman, 2017; Luijkx et al., 2021; Stein et al., 2025; Wolf et al., 2021). We have shown that individuals with lower educational attainment were underrepresented in both 2023 and 2024, relative to the CAPI-only design used in 2018. Given the overlap between education and subjective social status (Lindberg et al., 2021), it is likely that the unadjusted trend shown in the upper panel of Figure 2 reflects this underrepresentation. Weights and adjustments shift the average difference toward zero, suggesting that the unadjusted differences across years are primarily driven by differences in the sample compositions and hence by differential nonresponse (errors).
While differences in sample compositions are also likely to compromise estimates for subjective well-being indicators, it is possible that the statistically significant decreases in life satisfaction and subjective health are partly attributable to measurement effects. As in cross-sectional designs, mode-related measurement effects arise when the survey mode affects response patterns at a given point in time, therefore confounding change with measurement effects. Previous research has highlighted the mode sensitivity of well-being measures and the tendency for higher univariate estimates in CAPI modes, potentially driven by social desirability bias (Kreuter et al., 2008). In the Austrian context, telephone respondents gave more socially desirable responses, in the sense that they rated their financial, social and health situations better than CAWI respondents (Liedl & Steiber, 2023).
Finally, the observed differences may be a consequence of random sampling and hence due to sampling error  or reflect true changes in public opinion and perception. Taken together, this suggests that, compared to 2018, average household income stability has decreased, Austrians tend to hold more pessimistic views about their own lives and life in Austria in general, and average subjective well-being has declined (Etter et al., 2024). Given the numerous social and economic crises affecting Austria during the investigated period, this conclusion appears plausible and corresponds with evidence from different data sources (e.g., Grand, 2023).
6. Discussion
Survey programs are under constant pressure to adapt their methods to technological and societal changes. Due to factors such as declining response rates and rising costs of face-to-face interviews, as well as increasing internet penetration, many survey programs have decided against continuing personal interviews in favour of self-completion designs. This change offers several opportunities but also introduces new challenges (Dillman, 2017). This paper discusses the implementation and evaluation of a self-completion push-to-web (P2W) design for the Social Survey Austria (SSA) and concludes with four central take-aways for future research. We present results for the years 2018, 2023 and 2024 and give answers to the following research questions: What are the implications of transitioning the SSA from CAPI to a self-completion P2W-design for (1.) sample composition (i.e., selection effects), (2.) the impact of survey mode on response distributions (i.e., measurement effects), and (3.) the identification of time trends across years and survey modes?
Addressing our first research question, we indeed find that transitioning from CAPI to P2W affected the socio-demographic composition of the samples. Compared to the CAPI study in 2018, relative bias increased, primarily driven by the underrepresentation of individuals with lower educational attainment. Corresponding with the goal of P2W-surveys, the bias could be reduced by offering the additional paper-and-pencil mail mode, which functioned as a corrective by integrating underrepresented groups—such as individuals with lower educational attainment but also older people. Based on our results and the estimated share of 5-7 % internet non-users (see Statistik Austria, 2024), a single mode CAWI study cannot be recommended for general population surveys in Austria at present.
A first take-away is that the switch to P2W-design reduced especially the number of less educated respondents. What can be done about it? Lower educated people seem to belong to the “hard-to-persuade” populations in surveys and not necessarily to the “hard-to-reach” populations per se (Tourangeau, 2014), as they are included proportionally in our sampling frame. To reduce their underrepresentation in the final sample, future surveys should evaluate the impact of adapting specific design elements (Stein et al. 2025).
These include sampling strategies such as oversampling individuals with lower educational attainment, which could help balance the sample composition. Additionally, offering higher incentives to targeted subgroups may also improve overall data quality (Schmidt et al., 2025). Both of these strategies depend on having valid information about individuals’ educational backgrounds in the sampling frame. Closer collaboration between survey programs and official statistics agencies is therefore necessary to develop such frames, which would be another task for these agencies alongside the current focus on linking survey data with official data, e.g., from employment statistics.
Furthermore, additional face-to-face contacts —such as non-response follow-up studies—represent a potential supplementary procedure. Given the relatively good fit of the education distribution in the single-mode CAPI design used in SSA 2018, interviewer involvement may be an effective strategy for reducing the education bias (Stein et al. 2025).
Regarding our second research question—the impact of survey mode on response distributions (i.e., measurement effects)—we find several statistically significant differences between CAWI and paper-and-pencil mail modes in 2023 and 2024. However, after adjusting for several selection effects, the number of statistically significant differences was substantially reduced. Additionally, the distribution of regression coefficients narrowed, as controlling for selection effects reduced the magnitude of several mode differences. Despite these reductions, we found some persistent differences between the two modes, particularly in variables related to political opinions, gender roles and measurements such as internet usage patterns and digital literacy levels.
These persistent mode differences suggest that unobserved selection effects were not fully accounted for. At the same time, it is likely that these statistically significant differences rather reflect selection effects than measurement mode effects. For example, the significantly lower levels of digital usage in the paper-and-pencil mail sample are likely a consequence of reaching less tech-savvy respondents of the general population”—a desirable outcome of mixed mode designs.
Thus, the second key takeaway is that differences in the response distribution of various substantive items between CAWI and paper-and-pencil mail modes are primarily attributable to differences in sample composition and are therefore caused by, or reflective of, selection effects. Given the cross-sectional nature of this study, we are ultimately unable to fully disentangle true measurement effects from selection effects and cannot rule out that persisting significant differences are at least partially caused by measurement effects. Nevertheless, our findings are consistent with the assessment that measurement effects tend to be low in self-completion mixed-mode designs (de Leeuw, 2018; Stadtmüller et al., 2021).
As for our third research question on the effects of mode changes on the identification of time trends across years, we investigated time trends for six SSA repeat items that were available in all three surveys, using 2018 as the baseline. We find substantial differences between unadjusted and adjusted estimates. These differences can be attributed to differences in the sample compositions and the resulting variation of nonresponse errors between the P2W- and CAPI-designs.
The third take-away hence is that researchers aiming to estimate “true change” in public opinion using repeated cross-sectional data from surveys that transitioned from CAPI to self-completion designs, need to carefully account for over- and underrepresentation of different socio-demographic groups. These may cause differential nonresponse errors between survey modes and designs (de Leeuw, 2018; Felderer et al., 2019). While numerous methods are available for such adjustments, these post-survey methods rely on strong assumptions. For example, design-based inference using poststratification weighting procedures typically assumes the absence of other sources of selection bias, and that respondents and non-respondents within strata share the same distributional characteristics (Groves, 2006). Also model-based equivalents are demanding since they require specifying the correct model and selecting all relevant confounders to obtain unbiased estimates (Dumelle et al., 2022). However, the assumptions underlying these post-survey adjustments are often unlikely to hold in practice. Therefore, design-based solutions implemented early during the field process—such as targeted incentives and oversampling—can help balance sample composition and improve alignment with the target population.
At the same time, they offer no guarantee of eliminating selection bias resulting from unmeasured or unaccounted confounders and may even exacerbate bias by mobilizing more of the same types of respondents. To reduce selection bias, researchers should carefully investigate which variables were affected by the mode switch—specifically, those that no longer align well with the target population and simultaneously have a strong relationship with the outcome variable and integrate these covariates into weighting schemes or models. Since nonresponse errors are variable-specific issues rather than properties of the survey as a whole (Felderer, 2024), a one-size-fits-all solution is not realistic.
Transitioning from CAPI to self-completion designs can also bias estimates of change by introducing measurement effects. Changes in mode-sensitive questions—such as those on subjective wellbeing—may be influenced by lower social desirability in self-completion modes. Lugtig, (2024) comes to the same conclusion when investigating mode differences in generalised social trust for countries that switched from CAPI to a self-completion design in the 10th round of the European Social Survey.
The fourth take-away is that in order to approximate the magnitude of measurement effects on estimates of change in public opinion, we recommend comparing differences in response distributions between mode-sensitive questions and those less likely to be affected by survey modes, while accounting for selection effects. Contrasting these patterns give an indication which items may be affected by measurement effects in time-comparative studies.
In conclusion, the transition from CAPI to a P2W-design in the Austrian Social Survey has introduced both new opportunities and significant methodological challenges that may also apply to similar programmes. First, the shift in mode led to increased underrepresentation of certain demographic groups, especially individuals with lower educational attainment. To address this, design strategies such as mixed-mode approaches, oversampling and targeted incentives should be considered. Second, while differences in response distributions between CAWI and paper modes do exist, they can be reduced after accounting for selection effects—or may even reflect them. Nonetheless, some residual bias remains. Third, changes in sample composition due to mode transitions can distort time trend analyses, making it essential to carefully adjust for differential nonresponse to isolate actual shifts in public opinion. However, these adjustments depend on strong assumptions, which may not always hold, reinforcing the need for design-based solutions that ensure comparability and data quality over time.
Appendix
References
- Agresti, A. (2002). Categorical data analysis (2nd ed). Wiley-Interscience. https://doi.org/10.1002/0471249688
- Bosnjak, M. (2017). Mixed-Mode Surveys and Data Quality. Meta-Analytic Evidence and Avenues for Future Research. In Methodische Probleme von Mixed-Mode-Ansätzen in der Umfrageforschung. Springer. https://doi.org/10.1007/978-3-658-15834-7_1
- de Leeuw, E. (2005). To Mix or Not to Mix Data Collection Modes in Surveys. Journal of Official Statistic, 21(2), 233–255.
- de Leeuw, E. (2018). Mixed-Mode: Past, Present, and Future. Survey Research Methods, Vol 12, 75-89 Pages. https://doi.org/10.18148/SRM/2018.V12I2.7402
- Dillman, D. (2017). The promise and challenge of pushing respondents to the Web in mixed-mode surveys. Survey Methodology, 43(1), 3–30.
- Dumelle, M., Higham, M., Ver Hoef, J. M., Olsen, A. R., & Madsen, L. (2022). A comparison of design‐based and model‐based approaches for finite population spatial sampling and inference. Methods in Ecology and Evolution, 13(9), 2018–2029. https://doi.org/10.1111/2041-210X.13919
- Etter, C., Glatz, C., & Bodi-Fernandez, O. (2024). Mentale Gesundheit und Lebenszufriedenheit in Österreich während der Pandemie: Eine Längsschnittanalyse unter Berücksichtigung gruppenspezifischer Verläufe und ressourcenbezogener Einflüsse. In W. Aschauer, A. Eder, & D. Prandner (Eds), Die Auswirkungen der Corona-Pandemie auf die österreichische Gesellschaft: Ergebnisse der Längsschnittstudie „Werte in der Krise 2020–2022“ (1. Auflage, pp. 123–157). Nomos Verlagsgesellschaft mbH & Co. KG. https://doi.org/10.5771/9783748942696
- Felderer, B. (2024). Nonresponse Bias Analysis (GESIS Survey Guidelines) (Version 1.0). GESIS – Leibniz-Institute for the Social Sciences. https://doi.org/10.15465/GESIS-SG_EN_047
- Felderer, B., Kirchner, A., & Kreuter, F. (2019). The Effect of Survey Mode on Data Quality: Disentangling Nonresponse and Measurement Error Bias. Journal of Official Statistics, 35(1), 93–115. https://doi.org/10.2478/jos-2019-0005
- Grand, P. (2023). Assessing Mode Effects in SC Approaches – Comparing F2F and Push-to-Web. In P. Grand, M. Fink, & G. Tiemann (Eds), 20 Jahre Österreich im European Social Survey (1st edn, pp. 207–230). Böhlau Verlag. https://doi.org/10.7767/9783205217183.207
- Groves, R. M. (2006). Nonresponse Rates and Nonresponse Bias in Household Surveys. Public Opinion Quarterly, 70(5), 646–675. https://doi.org/10.1093/poq/nfl033
- Hadler, M., Eder, A., Aschauer, W., Bacher, J., Prandner, D., & Berghammer, C. (2024a). Social Survey Austria 2023 (SUF edition) [Data set]. AUSSDA. https://doi.org/10.11587/RJU0KE
- Hadler, M., Eder, A., Penker, M., Aschauer, W., Prandner, D., Bacher, J., & Berghammer, C. (2024b). Social Survey Austria 2024 (SUF edition) [Data set]. AUSSDA. https://doi.org/10.11587/0VKC5X
- Hadler, M., Höllinger, F., & Muckenhuber, J. (2019). Social Survey Austria 2018 (SUF edition) [Data set]. AUSSDA. https://doi.org/10.11587/ERDG3O
- Hoven, H., Eikemo, T. A., Backhaus-Hoven, I., Riebler, A., Fitzgerald, R., Martino, S., Huijts, T., Heggebø, K., Vidaurre-Teixidó, P., Bambra, C., & Balaj, M. (2025). The second Health Inequalities Module in the European Social Survey (ESS): Methodology and research opportunities. Social Science & Medicine, 380, 118228. https://doi.org/10.1016/j.socscimed.2025.118228
- Hox, J. J., De Leeuw, E. D., & Zijlmans, E. A. O. (2015). Measurement equivalence in mixed mode surveys. Frontiers in Psychology, 6. https://doi.org/10.3389/fpsyg.2015.00087
- Kreuter, F., & Olson, K. (2011). Multiple Auxiliary Variables in Nonresponse Adjustment. Sociological Methods & Research, 40(2), 311–332. https://doi.org/10.1177/0049124111400042
- Kreuter, F., Presser, S., & Tourangeau, R. (2008). Social Desirability Bias in CATI, IVR, and Web Surveys: The Effects of Mode and Question Sensitivity. Public Opinion Quarterly, 72(5), 847–865. https://doi.org/10.1093/poq/nfn063
- Liedl, B., & Steiber, N. (2023). Führen Online-Befragungen zu anderen Ergebnissen als persönliche Interviews? Eine Schätzung von Moduseffekten am Beispiel eines Mixed-Mode Surveys. Österreichische Zeitschrift für Soziologie, 49(1), 1–22. https://doi.org/10.1007/s11614-023-00532-4
- Lindberg, M. H., Chen, G., Olsen, J. A., & Abelsen, B. (2021). Explaining subjective social status in two countries: The relative importance of education, occupation, income and childhood circumstances. SSM – Population Health, 15, 100864. https://doi.org/10.1016/j.ssmph.2021.100864
- Lugtig, P. (2024). ESS round 10 mode experiments in Great Britain and Finland. Findings on mode effects. ESS methodological reports 2024. https://www.europeansocialsurvey.org/sites/default/files/2024-10/round-10-experimental-comparison-final.pdf
- Luijkx, R., Jónsdóttir, G. A., Gummer, T., Ernst Stähli, M., Frederiksen, M., Ketola, K., Reeskens, T., Brislinger, E., Christmann, P., Gunnarsson, S. Þ., Hjaltason, Á. B., Joye, D., Lomazzi, V., Maineri, A. M., Milbert, P., Ochsner, M., Pollien, A., Sapin, M., Solanes, I., … Wolf, C. (2021). The European Values Study 2017: On the Way to the Future Using Mixed-Modes. European Sociological Review, 37(2), 330–346. https://doi.org/10.1093/esr/jcaa049
- Lynn, P. (2020). Evaluating push-to-web methodology for mixed-mode surveys using address-based samples. Survey Research Methods, 19-30 Pages. https://doi.org/10.18148/SRM/2020.V14I1.7591
- Olson, K., Stange, M., & Smyth, J. (2014). Assessing Within-Household Selection Methods in Household Mail Surveys. Public Opinion Quarterly, 78(3), 656–678. https://doi.org/10.1093/poq/nfu022
- Penker, M., & Eder, A. (2024). Analysing mixed-mode effects of computer assisted telephone and personal interviews: A case study based on survey data from the international social survey programme module on environment. Bulletin of Sociological Methodology/Bulletin de Méthodologie Sociologique, 162(1), 108–128. https://doi.org/10.1177/07591063241236066
- Roberts, C., & Vandenplas, C. (2017). Estimating Components of Mean Squared Error to Evaluate the Benefits of Mixing Data Collection Modes. Journal of Official Statistics, 33(2), 303–334. https://doi.org/10.1515/jos-2017-0016
- Schmidt, M., Barth, A., & Blasius, J. (2025). Effects of mode and incentives on response rate, sample composition, and costs – experience from a self-administered mixed-mode survey of movers. https://doi.org/10.13094/SMIF-2025-00002
- Schouten, B., Van Den Brakel, J., Buelens, B., Van Der Laan, J., & Klausch, T. (2013). Disentangling mode-specific selection and measurement bias in social surveys. Social Science Research, 42(6), 1555–1570. https://doi.org/10.1016/j.ssresearch.2013.07.005
- Stadtmüller, S., Beuthner, C., & Silber, H. (2021). Mixed-Mode Surveys (GESIS Survey Guidelines) (Version 1.0). GESIS – Leibniz Institute for the Social Sciences. https://doi.org/10.15465/GESIS-SG_EN_038
- Statistik Austria. (2022a). Abgestimmte Erwerbsstatistik 2022. https://www.statistik.at/fileadmin/user_upload/AEST_2022.pdf
- Statistik Austria. (2022b). Bildungsstand der Bevölkerung. https://www.statistik.at/statistiken/bevoelkerung-und-soziales/bildung/bildungsstand-der-bevoelkerung
- Statistik Austria. (2024). IKT-Einsatz in Haushalten 2023. https://www.statistik.at/fileadmin/user_upload/IKTH_2023.pdf
- Stein, A., Gummer, T., Naumann, E., Rohr, B., Silber, H., Auriga, R., Bergmann, M., Bethmann, A., Blohm, M., Cornesse, C., Christmann, P., Coban, M., Décieux, J. P., Gauly, B., Hahn, C., Helmschrott, S., Hochman, O., Lemcke, J., Naber, D., … Weiß, B. (2025). Education bias in probability-based surveys in Germany: Evidence and possible solutions. International Journal of Social Research Methodology, 1–18. https://doi.org/10.1080/13645579.2025.2508889
- Tourangeau, R. (2014). Defining hard-to-survey populations. In Hard-to-Survey Populations (pp. 3–20). Cambridge University Press.
- Vannieuwenhuyze, J. (2013). On the Relative Advantage of Mixed-Mode versus Single-Mode Surveys. Survey Research Methods, Vol 8, 31-42 Pages. https://doi.org/10.18148/SRM/2014.V8I1.5500
- Vannieuwenhuyze, J., Loosveldt, G., & Molenberghs, G. (2014). Evaluating Mode Effects in Mixed-Mode Survey Data Using Covariate Adjustment Models. Journal of Official Statistics, 30(1), 1–21. https://doi.org/10.2478/jos-2014-0001
- Wolf, C., Christmann, P., Gummer, T., Schnaudt, C., & Verhoeven, S. (2021). Conducting General Social Surveys as Self-Administered Mixed-Mode Surveys. Public Opinion Quarterly, 85(2), 623–648. https://doi.org/10.1093/poq/nfab039
-
Keywords
calibration CATI coverage coverage bias cross-national surveys data linkage data quality European Social Survey experiment face-to-face face-to-face survey Facebook hard to reach populations incentives item nonresponse measurement measurement error mixed-mode surveys multitasking non-probability samples Nonresponse nonresponse bias nonresponse rates paradata PIAAC Probability sample probability samples QR codes rare populations response rate Satisficing social desirability Social media survey survey-taking climate survey data survey management survey methods Telephone survey telephone surveys total survey error unit nonresponse validity web survey Web surveys weighting
