

Effects of QR codes in a political science probability-based web survey
Oliver Lipps  FORS (Swiss Centre of Expertise in the Social Sciences) and University of Berne, Switzerland
Anke Tresch FORS and University of Lausanne, Switzerland
Louis Durussel FORS, Switzerland
Lipps O., Tresch A. & Durussel L. (2025). Effects of QR codes in a political science probability-based web survey. Survey Methods: Insights from the Field. Retrieved from https://surveyinsights.org/?p=21234
© the authors 2025. This work is licensed under a Creative Commons Attribution 4.0 International License (CC BY 4.0) 
Abstract
In this article, we use a probability-based, 30-minute web survey on political behavior to test effects of QR codes in mail invitations. As expected, we find a strong increase in mobile phone use compared to computer use. However, there is no difference in response rates, sample composition, response speed or response quality. This suggests that part of the sample is switching from computer to mobile phone, with no device effect. Importantly, the use of a QR code, which may give the impression of a short survey, led mobile phone users to perceive the survey as too long. This mismatch between expectations and the actual survey experience may have reduced panel consent rates in the QR code condition. While QR codes may be useful for pushing people to mobile devices, this result highlights the need for caution when using them for longer surveys, especially when completion or panel recruitment is important.
Keywords
panel consent, Probability sample, QR code, survey length, Web surveys
Acknowledgement
The data are freely available on SWISSUbase. We thank all project partners, and in particular the PI, Daniel Kübler, for their valuable support in carrying out the experiment.
Copyright
© the authors 2025. This work is licensed under a Creative Commons Attribution 4.0 International License (CC BY 4.0)
1. Introduction
Probability-based web surveys have become a cornerstone of modern social science research, offering cost-efficient data collection and timely insights into attitudes and behaviors (Dillman, Smyth, & Christian 2014). However, these surveys suffer from participation rates which are more than 10 percentage points lower than their offline counterparts (GenPopWeb2 2024), raising concerns about sample representativeness (op. cit.). These concerns are especially pronounced in politically oriented surveys, where participation tends to be uneven: politically interested individuals are systematically overrepresented (Groves et al. 2004), while groups such as nonvoters (Sciarini & Goldberg 2017) or supporters of populist right-wing parties (Hooghe & Reeskens 2007), are typically underrepresented.
To mitigate these challenges, researchers are increasingly exploring innovative and cost-efficient survey design strategies aimed at enhancing accessibility and encouraging broader participation. One such strategy is the use of Quick Response (QR) codes in survey invitations. By providing a direct path to an online questionnaire for mobile devices, QR codes may lower entry barriers and reduce perceived respondent burden. Research on the effects of QR codes in survey invitations has been growing in recent years, but it has mainly focused on device use, response rates and (socio-demographic) sample composition (e.g., Endres et al. 2024, Lewis et al. 2025, Marlar and Schreiner 2024, Rossmann 2024, Schmiedeberg et al. 2025). While studies typically report considerable increase in mobile phone completions, the implications of QR codes for response rates and socio-demographic composition remain inconclusive, and their impact on response quality is not yet well understood. Moreover, no prior studies have examined the effects of QR code in the context of political surveys or in panel recruitment surveys, where panel consent is essential.
Against this background, our study makes four contributions. First, we examine the use of QR codes in a political survey context, allowing us to assess their influence on variables typically affected by nonresponse bias: political interest, voter turnout, and support for populist right-wing parties. In this way, we extend the literature beyond socio-demographic sample composition to substantially important political variables. Second, our study is embedded in a survey that recruits participants into a long-term panel. This allows us to evaluate the effect of QR codes on panel consent – an outcome that is critical for longitudinal research. We also focus on another less-studied outcome: item nonresponse as one aspect of response quality and data validity. Third, we use a probability-based sample drawn from the Swiss population register, which includes basic socio-demographic variables. This design allows for individual-level analysis of nonresponse patterns and strengthens the external validity of our findings. Finally, we leverage a unique contextual setting: Switzerland, where near-universal internet access[1] and the 2020 introduction of mandatory QR billing, which have replaced Swiss payment slips in October 2022,[2] have fostered widespread familiarity with QR codes. This context allows us to examine QR code effects without the confounding influence of technological unfamiliarity, which has limited generalizability in earlier studies (e.g., Marlar & Schreiner 2024).
In the following sections, we outline our theoretical expectations, describe the data and methodology, present our empirical findings, and conclude with a short discussion of their implications.
2. State of the literature and theoretical expectations
QR codes in survey invitations are increasingly used to simplify access to web surveys, particularly on mobile devices. By allowing potential respondents to scan a code and access the survey link directly – typically with their smartphone – QR codes reduce the need to manually enter URLs, thereby lowering entry barriers (Schmiedeberg et al. 2025). In addition, QR codes may signal a short and convenient survey experience, further reducing the perceived burden and increasing the potential inclusivity of surveys (Lugtig and Luiten 2021).
A growing, but still small body of research has examined the effects of QR codes on device use, response rates, and sample composition. Studies consistently report a substantial increase in mobile phone completions (Endres et al. 2024a, 2024b, Olson & Ganshert 2024, Rossmann 2024, Schmiedeberg et al. 2025). However, findings on overall response rates and sample composition are mixed. Some studies show negligible or even slightly negative effects (Lewis et al. 2025), while others find weak positive effects (Marlar & Schreiner 2024). According to leverage-salience theory (Groves, Singer & Corning, 2000), individuals’ decision to participate in a survey depends on how salient and how valuable they perceive the invitation – factors that QR codes may influence differently across individuals and demographic groups. Some studies indeed raise concerns about potential selection biases favoring younger (Hupp et al. 2025, Lugtig & Luiten 2021) or more tech-savvy individuals (Marlar & Schreiner 2024), while others find no major effects on socio-demographic sample composition (Endres et al. 2024a, 2024b, Olson & Ganshert 2024, Rossmann 2024, Schmiedeberg et al. 2025). Additionally, Schmiedeberg and her colleagues (2025) find that middle-aged individuals started their response earlier than younger people due to the QR code. Others find no evidence of an earlier start of the survey (Olson & Ganshert 2024), although QR codes suggest a smoother login process.
Despite some mixed evidence, these studies provide valuable insights. Our study builds on this work by testing these effects in a new context – a probability-based political survey with panel recruitment in Switzerland – and by extending the scope to three underexplored outcomes. First, while previous studies have mainly examined whether QR codes affect representation of socio-demographic groups in the sample, we will analyze their implications on substantive representation in political surveys. More precisely, we will assess whether QR codes influence participation among groups typically underrepresented, especially in political surveys: individuals with lower political interest, nonvoters, and supporters of populist right-wing parties (Hooghe & Reeskens 2007, Groves et al. 2004, Sciarini & Goldberg 2017). To our knowledge, the only study examining the effects of QR codes on substantively important variables is the one by Lewis et al. (2025), which found no effects on key health indicators in a health survey context.
Second, the effects of QR codes on respondents’ willingness to join a panel remain unexplored. Focusing on a survey that recruits participants into a long-term panel, we will examine the impact of QR codes on panel consent. If QR codes signal a brief survey experience (Lugtig and Luiten 2021), but the survey is perceived as long or burdensome, respondents might be disappointed and less willing to agree to future participation.
Third, if QR codes lead to increased mobile phone use, as previous studies have repeatedly shown, they may indirectly affect data quality. Smaller screen sizes, touchscreens, and the potential for higher levels of disturbances while on the move may lead to higher break-off rates (Lewis et al. 2025, Rossmann 2024) and a lower data quality (Lugtig & Luiten 2021) even in mobile phone-optimized surveys. We extend this line of research by analyzing the effects of QR codes on item nonresponse as an indicator of data quality.
Based on the existing evidence, we expect higher mobile phone usage and higher starting rates, but also higher dropout rates. We do not expect significant effects on starting dates or sample composition – neither for socio-demographic nor substantive political variables. However, we expect QR codes to be associated with greater item nonresponse and lower panel consent, due to perceived burden in the form of a negative evaluation of the survey length in a longer (30 minute) questionnaire. Specifically, we test the following hypotheses comparing samples with and without a QR code in the invitation letter:
H1: Device use (mobile phone vs. computer users)
H1a: A QR code increases the likelihood of responding on a mobile phone compared to a computer.
H1b: This effect is stronger among younger respondents compared to older respondents.
H2: Response rates (starting and finishing the survey) and dropout
H2a: A QR code increases the likelihood of respondents starting the survey due to an easier login process.
H2b: A QR code has a higher dropout rate due to the greater mobile phone use.
H3: Sample composition
H3a: A QR code does not reduce socio-demographic bias in the sample.
H3b: A QR code does not reduce bias on substantive (political) variables in the sample.
H4: Starting date
H4: A QR code will not lead to an earlier start of the survey.
H5: Item nonresponse
H5: A QR code will exhibit higher item nonresponse rates due to greater mobile phone use.
H6 Evaluation of survey length
H6: A QR code will lead to the evaluation of the survey as too long, as it suggests a short questionnaire.
H7 Panel consent
H7: A QR code will lead to a lower panel consent rate, as per H6.
3. Data and Methods
We use data from the project “Direct Democracy in Switzerland in the 21st Century (DDS-21)”[3], which is funded by the Swiss National Science Foundation and runs from February 2023 to January 2027. The project investigates the opinion formation of Swiss adult citizens in direct-democratic votes on the federal level. We use data from the 5th cross-sectional survey (CSS5), which uses a sample of about 10’700 Swiss adults randomly selected from the Swiss Population Register. The survey randomizes all sample members into two equally sized groups, one with and one without a QR code with the invitation letter. Sample members in the QR code design are free to scan the QR code or enter the URL (www.dds21.ch) and their personal login into a browser. Nonresponding sample members receive up to two reminder letters including or not including a QR code. Fieldwork was from 15 November to 29 December 2024. The web-only survey was announced to take about 30 minutes to complete, while the actual median completion time was 32.8 minutes without QR code and 33.6 minutes with a QR code. There is only little evidence of speeding (completion time 11 minutes or less) with 10 speeders among finishers without QR code and 13 speeders among finishers with QR code. Finishers answered between 122 and 293 questions (median=248).[4] At the end of the questionnaire, all participants are invited to join a feed-in online panel, which will administer shorter surveys of around 20 minutes following each upcoming federal vote – typically occurring every three months. As the French and Italian-speaking parts were oversampled, we use design weights to be able to infer on all adult Swiss citizens. Since weighting may come with the loss of statistical power (Miratrix et al. 2018), we add results from the unweighted analyses in the notes. However, additional poststratification weights (based on socio-demographic variables) do not seem to improve precision in real data applications (Miratrix et al. 2018) and the socio-demographic variables are distributed very similarly across the experimental designs (see Table 1). Therefore, we do not consider poststratification weights.
To test our hypotheses, we use descriptive statistics including graphs, t-tests, r-indicators, and multivariate linear regression tools. We use the maximum number of observations possible, not only survey finishers. As a result, the sample size may vary slightly across analyses depending on the variables included.
To analyze socio-demographic bias, we will use the r-indicator, which calculates the similarity between two groups in terms of the covariates, and is defined as (Schouten et al. 2009):
r(ρ) = 1-2S(ρ)
with ρ denoting the predicted response probabilities and S(ρ) their standard deviation. The r-indicator has a range between 0 and 1, where 1 is perfectly representative (i.e., all individuals have the same predicted consent probability) and 0 deviating maximally from representativeness. Compared with pseudo R2 measures (Hemmert et al. 2018), the r-indicator is comparable across different datasets, normalized, and easy to interpret (Schouten et al. 2012). As we have the socio-demographic information of the gross sample from the sampling frame, we can compare the representativeness of the respondents in each gross sample (with and without QR code).
We first list descriptives of all variables, by QR code provision, and check the randomization into the two QR designs based on the frame variables.
Table 1: Distribution of frame variables (upper part) and research variables (lower part), by QR code.
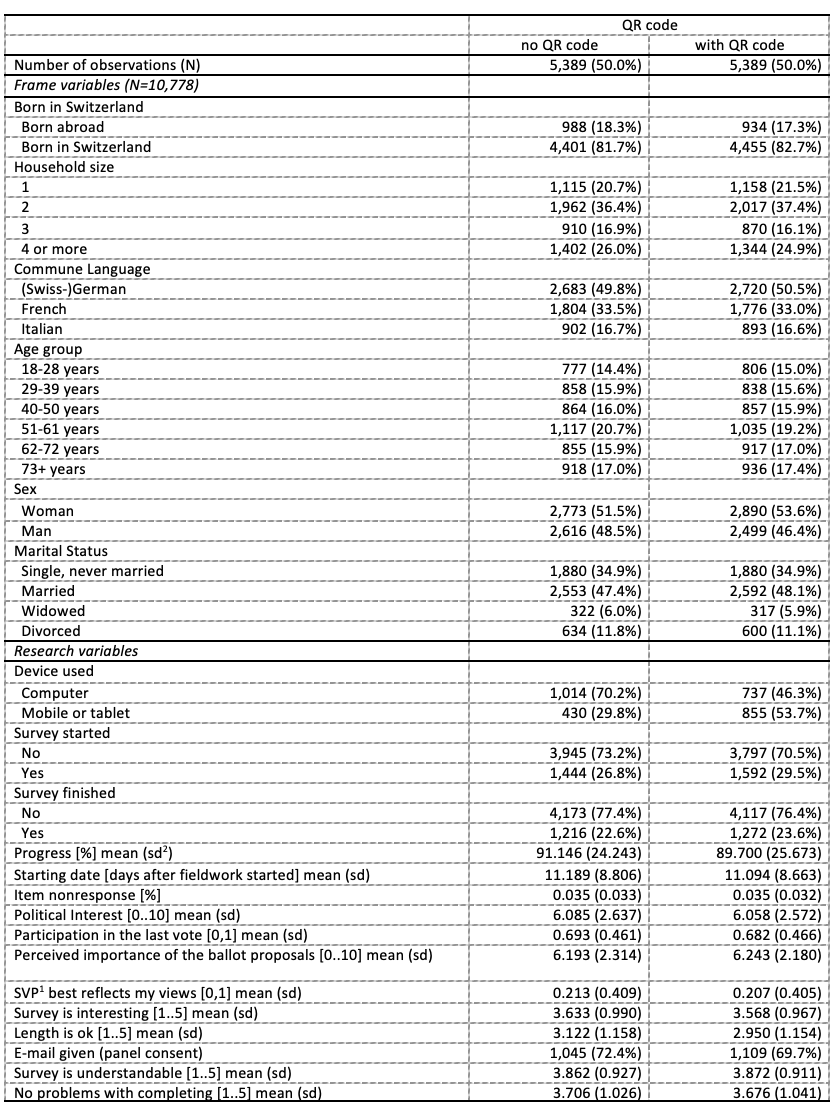
Notes: Data: SDD-21, CSS5. 1 SVP=Swiss People’s Party. 2 sd=standard deviation.
From the frame variables, we see that randomization into the two QR designs worked well.
4. Results
H1: Device Use (Mobile phone[5] vs. Computer Users)
Mobile phone rates by QR code provision are depicted in Table H1a:
Table H1a: Device use rates by QR code
![]()
Notes: Data: DDS-21, CSS5, design weighted. Statistics are mean values and number of observations. The t-test is two-sided. Unweighted means amount to 0.298 and 0.537.
Consistent with the previous studies and in line with H1a, we find that QR codes significantly increased mobile phone use: while 53% of QR code respondents used a mobile phone, only 29% of the non-QR code respondents did so. Cohens’d suggests a small to medium effect. The unweighted analyses provide an almost identical difference. To test H1b, Figure H1b plots the predicted share of participation by mobile phone based on the interaction of age groups and QR code from a linear regression model. It shows that this increase in mobile phone use was less pronounced only among older people: while QR codes led to a statistically significant (p<0.05) 13 percentage point increase in mobile phone use among those aged 73 and older, the increase exceeded 20 percentage points in all other age groups (regression results not shown). Although this difference was most pronounced in the youngest age group, it did not decrease monotonically.
Figure H1b: Share of participation by mobile phone by age group.
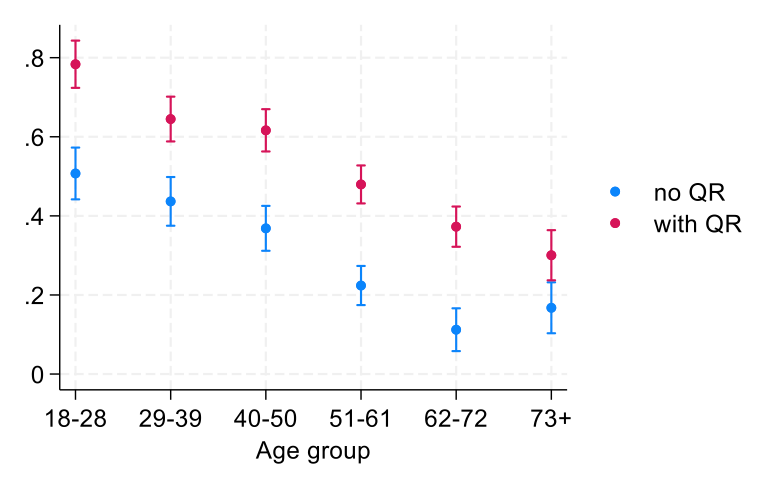
Notes: Data: DDS-21, CSS5, design weighted, Number of observations =1444 without, 1592 with QR code. The figure contains predicted shares from the applied models.
Hypothesis 1a (increased likelihood of responding on a mobile phone with a QR code) is confirmed, hypothesis 1b (stronger effect among only younger respondents) partly.
H2: Response Rates (Starting and Finishing the Survey) and dropout
Among respondents without a QR code in the invitation letter, 26.2% started the survey, compared to 29.1% among those who received a QR code – a statistically significant difference at the 1% level. In terms of survey completion, the rates were 22.2% and 23.3% respectively. However, this difference is not statistically significant (p>0.2). Cohens’d suggests no effect for both starting and finishing.
Table H2: Starting and finishing rates by QR code
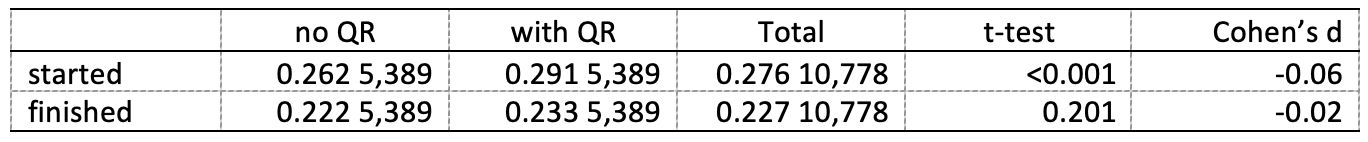
Notes: Data: DDS-21, CSS5, design weighted. Statistics are mean values and number of observations. The t-tests are two-sided. The unweighted analyses provide very similar results.
The reason for the discrepancy between starting and finishing rates is the higher average progress among computer users: while the average progress among those who started with a computer is 94%, it is 86% among those who started with a mobile phone. This difference is statistically significant (1% level). Progress does not differ by QR code, once the device is controlled for. Finally, there is no interaction effect between QR code and the device. The unweighted analyses provide very similar results.
Hypothesis 2a (increased likelihood to start the survey) and 2b (higher dropout rate) with a QR code are confirmed.
H3: Sample composition
To test for differences in sample composition, we calculate the r-indicator for the sample with and without the QR code (output not shown). Note that we can only use variables as covariates if they are known of all sample members, including nonrespondents. Therefore, we can only compare the QR code and the non QR code samples in terms of the socio-demographic variables from the sampling frame (see Table 1).
For those who started the survey, the r-indicator is 0.87 for those without a QR code, and 0.88 for those with a QR code. The corresponding values for finishers are 0.88 and 0.89. Due to these small differences, the representativeness is likely to be independent of the presence or absence of a QR code.
Regarding political variables, we analyze the means of turnout, the perceived importance of the ballot proposals, political interest (all of which are typically overrepresented, particularly in voting surveys), as well as right-wing populist vote (which is typically underrepresented) by the QR variable. T-tests show that the means of all variables is independent of whether a QR code is provided. In line with this finding, Cohens’d suggests no effect for all four variables.
Table H3b: Means of political variables by QR code
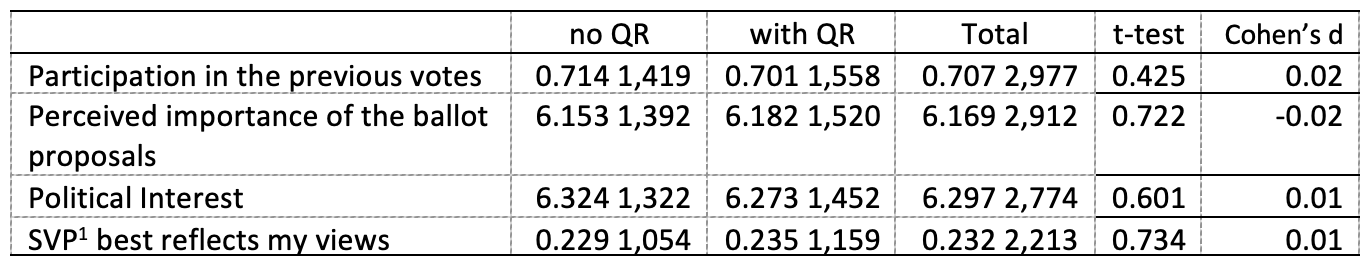
Notes: Data: DDS-21, CSS5, design weighted. Statistics are mean values and number of observations. 1 The t-tests are two-sided. SVP=Swiss People’s Party. The unweighted analyses provide very similar results.
Hypotheses 3a (representativeness of socio-demographic variables) and 3b (unbiasedness of political variables) are confirmed.
H4: Starting date
The mean starting date of the survey does not differ depending on whether a QR code is provided, as shown by Table H4. This independence is confirmed by the very small value of Cohen’s d.
Table H4: Means of starting dates by QR code
![]()
Notes: Data: DDS-21, CSS5, design weighted. Statistics are mean values and number of observations. The t-test is two-sided. The unweighted analyses provide very similar results.
Hypothesis 4 (earlier start of the survey) is confirmed.
H5: Item nonresponse
As table H5 shows, there is no difference in item nonresponse between finishers by QR code, which is in line with the zero effect from Cohen’s d.
Table H5: Means of item nonresponse (finishers only) by QR code
![]()
Notes: Data: DDS-21, CSS5, design weighted. Statistics are mean values and number of observations. The t-test is two-sided. The unweighted analyses provide very similar results.
Hypothesis 5 is not confirmed, suggesting that QR codes do not negatively affect data quality, at least not in terms of item nonresponse.
H6: Survey evaluation (perceived length)
According to earlier studies, QR codes signal a short survey (Lugtig and Luiten 2021). This led us to expect that respondents in the QR code group would be less satisfied with our rather long questionnaire. This is indeed the case: those who received an invitation with QR code are significantly less satisfied with the length of the survey with a considerable effect size of 0.173. However, Cohen’s d suggests only a small effect size.
Table H6: Means of evaluation of length of survey by QR code
![]()
Notes: Data: DDS-21, CSS5, design weighted. Statistics are mean values and number of observations. The t-test is two-sided. The unweighted analyses provide very similar results.
Hypothesis 6 is confirmed.
H7: Panel consent
We hypothesized that respondents who received a QR code may be less likely to provide consent for panel participation. The rationale is that if QR codes may create the expectation of a brief survey, which, if unmet, can lead to disappointment and frustration. This mismatch between expectation and actual survey experience may, in turn, reduce respondents’ willingness to participate in future panel waves. As shown in table H7, the findings are consistent with this expectation: respondents who received a QR code show an almost three percentage points lower likelihood of giving panel consent. However, this relationship is only marginally significant, with a p-value just below 0.08. Cohen’s d suggests a small effect.
Table H7: Means of panel consent by QR code
![]()
Notes: Data: DDS-21, CSS5, design weighted. Statistics are mean values and number of observations. The t-test is two-sided. The unweighted analyses provide very similar results.
Hypothesis 7 (lower panel consent rate) is confirmed on the 8% significance level (10% significance level based on the unweighted analysis).
To delve deeper, we investigate whether the increased use of mobile phones—encouraged by the provision of a QR code—moderates responses to key outcome variables. Figure 2 depicts the average marginal effects of the interaction between QR code provision and the device used to complete the survey for several variables of interest, using linear regression models: participation in the last vote, importance of the ballot proposals, survey starting date, political interest, SVP best reflects my views, perceived adequacy of survey length, and panel consent.[6]
Figure 2: Key variables by the interaction of QR code and device: predicted effects.
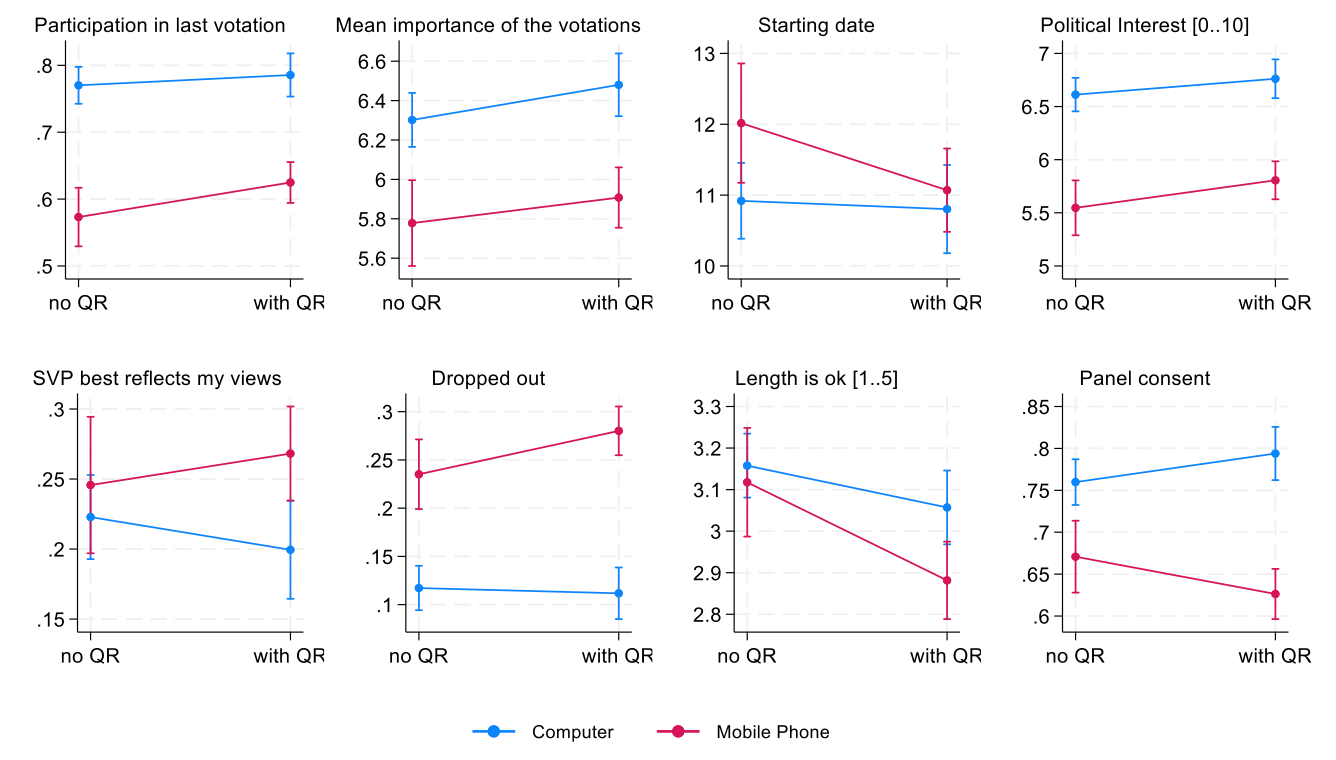
Data: DDS-21, CSS5, design weighted.
Overall, Figure 2 suggests that respondents who use a mobile phone are harder to survey. Among those who switch from a computer to a mobile phone due to the QR code, three distinct patterns emerge. The first two seem to result primarily from selection effects:
- Convergence pattern: When switchers hold opinions that lie between those of computer and mobile phone users (without QR code), the average response among mobile users shifts toward that of computer users, while the average for computer users shifts away from mobile users. This pattern is observed for participation in and importance of the ballot proposals, political interest, and starting date (first row in Figure 2).
- Divergence pattern 1: When switchers’ opinions extend beyond those of mobile users, both response curves diverge further. This is evident for variables such as closeness with SVP, dropout, perceived, and panel consent.
- Divergence pattern 2: in the case of perceived adequacy of survey length, an additional QR code effect seems to exist: including switchers decreases satisfaction of mobile users with the survey length, while the satisfaction of computer users decreases even without switchers.
This latter pattern occurs if the presence of a QR code leads to lower satisfaction with the survey length, regardless of the device used.
5. Conclusion
In this article, we examined the impact of including a QR code in a postal invitation to a web survey on device use, response rates, sample composition, survey start date, response quality, survey evaluation and panel consent. In line with previous studies, we observed a significant increase in mobile phone use compared to computer use. This effect was present across all age groups, though less pronounced among older people. While QR codes led to higher survey start rates, completion rates were similar, indicating higher dropout rates associated with QR codes. Neither sample composition nor response speed differed significantly.
Although switching to a mobile phone due to a QR code does not appear to change respondents’ response behavior, the use of a QR code may create the expectation of a short survey. When this expectation is not met, the mismatch can have consequences. All respondents, especially those on mobile devices, found the survey too long in the QR condition, with a median completion time of 30 minutes, compared to the non-QR condition. This may have negatively affected both the dropout rate and the willingness to provide panel consent. In fact, we find a strong correlation (R2=0.04) between the positive evaluation of the survey length and the likelihood of giving panel consent.
As a recommendation, providing a QR code is an effective strategy for encouraging survey participation on mobile phones, as it does not compromise sample composition or response quality. However, caution is warranted if the survey ends with a request for panel consent to participate in follow-up studies. QR codes may implicitly signal a considerably shorter survey, which can lead to disappointment if the actual survey is longer – as is the case with our 30-minute questionnaire. Our findings suggest that some respondents became too frustrated to finish the survey or give panel consent. This is particularly the case for those who switch to a mobile phone due to the QR code. Using a short recruitment survey that only asks for basic respondent characteristics may be more appropriate when setting up a panel. For example, the German Family Demography Panel Study (FReDA) used a recruitment survey averaging just about 10 minutes (Hank et al. 2025).
Our study has some limitations. First, our sample excludes non-adults and non-citizens, who may be more likely to use mobile phones, which could weaken the effect of QR codes. Second, we did not analyze other indicators of response quality, such as straightlining or speeding (Cornesse & Blom 2023). While we found no QR code effects on item-nonresponse, there were differences by device. However, we cannot disentangle device effects from sample selection effects – an issue beyond the scope of this paper. Despite these shortcomings, our research clearly highlights the importance of managing respondent expectations when using QR codes in survey invitations. Given that our data comes from a probability-based web survey, our findings can be generalized to similar contexts in developed countries. Further research could vary the length of the questionnaire in an experimental setting to test the maximum questionnaire length to avoid overburdening respondents, especially when panel consent is required.
Endnotes
[1] As of early 2025, Switzerland had an internet penetration rate of 99%, with mobile connections equivalent to 122% of the total population (see https://datareportal.com/reports/digital-2025-switzerland).
[2] https://www.six-group.com/en/products-services/banking-services/payment-standardization/standards/qr-bill.html?utm_source=chatgpt.com.
[3] https://data.snf.ch/grants/grant/207585, project number 100018_207585.
[4] The length of the questionnaire depends strongly on whether the respondent took part in the vote.
[5] Mobile phone use is defined by the operating system: Android, iPad, iPhone versus all others (mainly Windows or Macintosh). This means that tablets are included in the category of mobile phones.
[6] As a robustness check, we included the frame variables gender, age group, born in Switzerland, Language, marital status, and household size (thereby keeping the sample size) as controls. We obtained almost identical plots. For simplicity, we decided to not include these control variables.
References
- Cornesse, C., & Blom, A. (2023). Response quality in nonprobability and probability-based online panels. Sociological Methods & Research, 52(2), 879-908. https://doi.org/10.1177/0049124120914
- Dillman, D., Smyth, J., & Christian, L. (2014). Internet, phone, mail, and mixed-mode surveys: The tailored design method (4th ed.). Wiley.
- Endres, K., Heiden, K., Losch, M., Harland, K. & Abbott, A. (2024a). Experimenting with QR Codes and Envelope Size in Push-to-Web Surveys, Journal of Survey Statistics and Methodology, Volume 12, Issue 4, September 2024, Pages 893–905, https://doi.org/10.1093/jssam/smad008
- Endres, K., Heiden, E., & Park, K. (2024b). The Effect of Quick Response (QR) Codes on Response Rates and Respondent Composition: Results from a Statewide Experiment. Survey Methods: Insights from the Field. DOI:10.13094/SMIF-2024-00007
- GenPopWeb2 (2024). Strategies to improve response rates in probability-based online surveys: A systematic literature review. National Centre for Research Methods. https://www.ncrm.ac.uk/research/genpopweb2/reports.php (accessed June 17, 2025).
- Groves, R. Presser, S., & Dipko, S. (2004). The Role of Topic Interest in Survey Participation Decisions, Public Opinion Quarterly, 68(1), 2–31. https://doi.org/10.1093/poq/nfh002.
- Groves, R., Singer, E., & Corning, A. (2000). Leverage-saliency theory of survey participation: description and an illustration. Public Opinion Quarterly, 64(3), 299-308. JSTOR, http://www.jstor.org/stable/3078721.
- Hank, K., Gummer, T., Bujard, M., Neyer, F. J., Pollak, R., Spieß, C. K., … & Thönnissen, C. (2025). A new data infrastructure for family research and demographic analysis: The German Family Demography Panel Study (FReDA). European Sociological Review, 41(2), 316-328. https://doi.org/10.1093/esr/jcae019
- Hemmert, G., Schons, L., Wieseke, J., & Schimmelpfennig, H. (2018). Log-likelihood-based Pseudo-R2 in Logistic Regression: Deriving Sample-sensitive Benchmarks. Sociological Methods & Research, 47(3), 507-531. https://doi.org/10.1177/0049124116638107.
- Hooghe, M. & Reeskens T. (2007). Are cross-national surveys the best way to study the extreme-right vote in Europe? Patterns of Prejudice, 41(2), 177-196. http://dx.doi.org/10.1080/00313220701265544
- Hupp, A., Schroeder, H., West, B., Leissou, E., & Weir, D. (2025). Who chooses a QR code over a URL to access a web screener in a national probability survey of older adults, and the impact on data quality. Survey Methods: Insights from the Field. DOI:10.13094/SMIF-2025-00003
- Lewis, T., Lee N., Palmer, D., Freedner, N., Matzke, H., & Prachand N. (2025). Is it Helpful to Include QR Codes on Mail Contact Materials for Self-Administered Web Surveys? Survey Methods: Insights from the Field. DOI: 10.13094/SMIF-2025-00001
- Lugtig, P. & Luiten, A. (2021). Do shorter stated survey length and inclusion of a QR code in an invitation letter lead to better response rates? Survey Methods: Insights from the Field. DOI: 10.13094/SMIF-2021-00001
- Marlar, J., & Schreiner, J. (2024). The Use of QR Codes to Encourage Participation in Mail Push-To-Web Surveys: An Evaluation of Experiments from 2015 and 2022. Journal of Survey Statistics and Methodology, 12(5), 1157-1173. https://doi.org/10.1093/jssam/smae024
- Miratrix, L., Sekhon, J., Theodoridis A., & Campos L. (2018). Worth Weighting? How to Think About and Use Weights in Survey Experiments. Political Analysis, 26(3), 275-291, https://doi.org/10.1017/pan.2018.1.
- Olson, K., & Ganshert, A. (2024). Remember, You Can Complete This Survey Online! Web Survey Links and QR Codes in a Mixed-Mode Web and Mail General Population Survey. Social Science Computer Review, 0(0). https://doi.org/10.1177/08944393241277553.
- Rossmann, J. (2024). Advantages and Disadvantages of Using QR Codes in Web-Based Panel Surveys on Politics and Elections. Presentation at the DACH-Wahlstudientreffen 2024, University of Vienna, 14./15.03.2024
- Schmiedeberg, C., Schröder, J., & Bozoyan, C. (forthcoming 2025). Does a QR code in the invitation letter increase participation in a push-to-web survey? Field Methods
- Schouten, B., Bethlehem, J., Beullens, K., Kleven, Ø., Loosveldt, G., Luiten, A.,… & Skinner, C. (2012). Evaluating, comparing, monitoring, and improving representativeness of survey response through R‐indicators and partial R‐indicators. International Statistical Review, 80(3), 382-399. https://doi.org/10.1111/j.1751-5823.2012.00189.x
- Schouten, B., Cobben, F., & Bethlehem, J. (2009). Indicators for the representativeness of survey response. Survey Methodology, 35(1), 101-113. Statistics Canada, Catalogue No. 12-001-X.
- Sciarini, P., & Goldberg, A. (2017). Lost on the way: Nonresponse and its influence on turnout bias in postelection surveys. International Journal of Public Opinion Research, 29(2), 291-315. https://doi.org/10.1093/ijpor/edv049
-
Keywords
calibration CATI coverage coverage bias cross-national surveys data linkage data quality European Social Survey experiment face-to-face face-to-face survey Facebook hard to reach populations incentives item nonresponse measurement measurement error mixed-mode surveys multitasking non-probability samples Nonresponse nonresponse bias nonresponse rates paradata PIAAC Probability sample probability samples QR codes rare populations response rate Satisficing social desirability Social media survey survey-taking climate survey data survey management survey methods Telephone survey telephone surveys total survey error unit nonresponse validity web survey Web surveys weighting
