

Good questions, bad questions? A Post-Survey Evaluation Strategy Based on Item Nonresponse.
Gummer, T., & Roßmann, J. (2013). Good questions, bad questions? A Post-Survey Evaluation Strategy Based on Item Nonresponse. Survey Methods: Insights from the Field. Retrieved from https://surveyinsights.org/?p=2330
© the authors 2013. This work is licensed under a Creative Commons Attribution 4.0 International License (CC BY 4.0) 
Abstract
In this paper we discuss a three-step strategy to evaluate data quality in terms of item nonresponse and to identify potentially flawed questions. We provide an example with several data sets of a large-scale social scientific study to illustrate the application of the strategy and to highlight its benefits. In survey research it is common practice to test questions ex ante, for example by means of cognitive pretesting. Nevertheless, it is necessary to check the respondents’ response behavior throughout the questionnaire to evaluate the quality of the collected data. Articles addressing item nonresponse mostly focus on individuals or specific questions – adjusting the focus on the questionnaire as a whole seems to be a fruitful addition for survey methodology. Shifting the perspective enables us to identify problematic questions ex post and adjust the questionnaire or research design before re-applying it to further studies or to assess the data quality of a study. This need may arise from shortcomings or failures during the cognitive pretesting or as a result of unforeseen events during the data collection. Furthermore, result of this ex post analysis may be an integral part of data quality reports.
Keywords
data quality, don´t know answers, expert review, item nonresponse, question evaluation
Acknowledgement
We would like to thank Michael Bergmann, Michael Blohm, Jessica Fortin-Rittberger, Verena Halbherr, Lars Kaczmirek, Timo Lenzer, the editors, and the anonymous reviewers for their excellent comments and suggestions. The data used in this article has been collected with the support of grants from the German Research Foundation (Deutsche Forschungsgemeinschaft, DFG). All GLES data can be accessed via the GESIS Data Archive (http://www.gesis.org/en/services/research/data-catalogue/).
Copyright
© the authors 2013. This work is licensed under a Creative Commons Attribution 4.0 International License (CC BY 4.0)
Introduction
In this paper we present a three-step strategy to evaluate data quality in terms of item nonresponse and to identify potentially flawed questions. Increasing the quality of data from surveys is a major goal of contemporary research in survey methodology. An important aspect of data quality is the level of item nonresponse (INR; see, for instance, the total survey error framework: Biemer & Lyberg, 2003; Groves, et al., 2009; Weisberg, 2005), which among other things encompasses don’t know answers (DK) and refusals (Shoemaker, Eichholz, & Skewes, 2002). A large amount of research has targeted the issue of theoretical explanations of item nonresponse (Beatty & Herrmann, 2002) and the role of respondents, interviewers, and question properties on the emergence of item nonresponse (among others Gabriel & Thaidigsmann, 2009; Koch & Blohm, 2009; Pickery & Loosveldt, 1998, 2001, 2004; Stocké & Stark, 2005; Tourangeau, Rips, & Rasinski, 2000) as well as on how to prevent and to cope with item nonresponse (De Leeuw, Hox, & Huisman, 2003; Weisberg, 2005). However, little is known about how to determine whether the level of item nonresponse of any question in our data sets is critical or negligible besides the general notion that item nonresponse should be as low as possible (Saris & Gallhofer, 2007a, p. 186). Hence, if we want to assess the quality of our data and examine whether questions are flawed, we are confronted with two challenges: First, we have to assess the extent of item nonresponse and to decide whether item nonresponse is critical. Second, we need to examine the likely causes of item nonresponse and to determine whether it is caused by unavoidable characteristics of the question (e.g., sensitivity of the topic) or by unforeseen flaws in the question’s wording. The proposed strategy addresses these challenges at its consecutive steps.
A further rationale for developing such a strategy is that the literature on survey methodology discusses a variety of methods to test and evaluate questions before the questionnaire goes into the field, for instance expert evaluations, focus group discussions, cognitive interviews, field pretests and behavior coding, randomized or split-ballot experiments, and statistical modeling (Campanelli, 2008; Faulbaum, Prüfer, & Rexroth, 2009; Groves, et al., 2009; Presser, Couper, et al., 2004; Presser, Rothgeb, et al., 2004; Saris & Gallhofer, 2007a, 2007b). However, often those methods may not be available to the researcher due to survey budget restrictions (Presser, Couper, et al., 2004, p. 126), lack of available time or because one wants to replicate questions from previously untested questionnaires. In these situations as well as in all survey endeavors the proposed three-step strategy might be an easily conductible, fast and cost saving supplement to the methods mentioned above.
The strategy does not substitute the use of other methods but it complements them. For example, we might use the proposed strategy to get a first overview of a questionnaire and to identify potentially flawed questions. Then, the identified set of questions is further examined using, for instance, cognitive pretesting methods.
The outline of our article is as follows. First, we give a brief overview of the three-step strategy. After describing the strategy and the indicators we exemplarily demonstrate their application and highlight the benefits with data of the German Longitudinal Election Study (GLES). Finally, we point out the added value of applying our strategy.
The Three-Step Strategy
The strategy employs a toolkit combining both qualitative and quantitative methods. We suggest a standardized approach of identifying flawed items via quantitative indicators, which is then supplemented by a qualitative component. The approach offers four key benefits: First, the procedure is transparent. Creation and application of quantitative indicators is comprehensible and, thus, reproducible. Second, indicators are computed for each item in a data set. By treating each item the same way, we do not need to rely on subjective ratings of which items should be examined. Thus, biased knowledge, subjectivity, and selectivity are avoided. Third, the quantitative component of our strategy can easily be implemented into automated syntax files in standard statistical software packages (e.g., STATA, R, and SPSS). In consequence, large data sets can be examined without much effort in the first case. Fourth, appending our strategy with a qualitative component enables us to take the individual context and content of each survey into account. This advantage of our strategy has to be seen in the context of a lack of mixed-method studies on (non-)response behavior (for an exception, see Morren, Gelissen, & Vermunt, 2012).
Our proposed strategy consists of three steps illustrated in Figure 1. Each step is described in detail in the sections below. If this strategy is employed to summarize the quality of collected data for the scientific community (i.e., the users of the data set) the findings should be published in form of a report. On the other hand, our strategy can used to prepare a follow-up study relying on the previously used questionnaire. In this case, one may want to modify questions to enhance the overall data quality of the follow-up survey. Both examples highlight the need for a flexible and context-sensitive method in step three of our strategy.
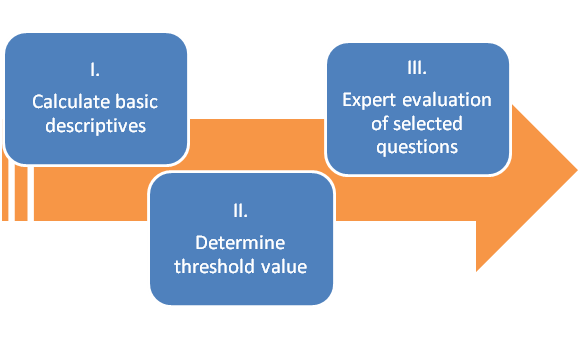
Figure 1: The Three-Step Strategy
Step One: Calculating basic descriptives
In the first step, we compute the relative frequency of item nonresponses (INR) as a basic descriptive for each variable in the data set.[i] As we agree with Shoemaker et al. (2002) that refusals and “don’t know” answers (DK) have different causes, we recommend to compute these descriptives separately for INR, i.e., refusals and non-answers, and DK responses. DK and INR are treated as two distinct concepts.[ii] This results in a data set on variable or questions level. For example, an INR of 0.1 for question Q1 means that 10% of the respondents, who received questions Q1, refused to answer.
While in most instances INR indicates sensitive or flawed questions, DK hints at questions which are challenging to answer and require certain cognitive effort or skills (Lenzner, 2012). For example, a question asking for the ratio of single mothers with two children in the German population will most likely cause a high ratio of DK. Nevertheless, INR and DK answers are both means to avoid giving a substantial answer. If the DK option is not a fully substantial answer category (e.g., in questions on the respondent´s behavior) but a missing category, there may be need to check the structure of the missing values. To supplement the list of items with quantitative, easy to handle indicators, we propose two indicators for the ratios of DK and INR, which we call ID ratio and IDI ratio. They differ in the way they consider the ratios of DK and INR. Both allow the examination of DK and INR in comparison to each other.
The most intuitive way is to compare absolute or relative frequencies of INR and DK. Exactly this is done by the ID ratio:
![\[ ID=\frac{INR}{DK}. \]](https://surveyinsights.org/wp-content/uploads/ql-cache/quicklatex.com-5f8ebc8ba802f88571f90cc899a74d07_l3.png "Rendered by QuickLaTeX.com")
The ratio takes values in the range of [0, ∞], given  , and is the factor by which INR is higher in comparison to DK. For example, an ID ratio of 2.5 means that INR is 2.5 times higher than DK. If ID is 0, no INR occurred. In most cases, only INR will be shown in a list of potentially flawed items. In this case the frequency of DK can be calculated by adjusting the formula to:
  . Presenting INR and ID enables the reader to easily infer the level of DK and to evaluate the structure of both missing value categories. The downside of the ID ratio is that it is not standardized and non-equilibrate. If the frequency of DK exceeds INR the ratio lies between [0, 1], when INR exceeds DK the ratio takes a value in the interval [1, ∞]. Hence, we recommend using the IDI ratio as a second supplemental indicator. It is defined as follows:
![\[ IDI=\frac{INR}{DK+INR}. \]](https://surveyinsights.org/wp-content/uploads/ql-cache/quicklatex.com-ab8a38b42a9ffc2d05b9bf1690b1fc7b_l3.png "Rendered by QuickLaTeX.com")
The IDI ratio takes values in the interval of [0, 1], given  . It is the ratio of INR to the total amount of missing values of the respective variable (here DK and INR). A value higher than 0.5 means that INR exceeds the other missing values (here DK). 0.5 indicates equilibrium between INR and DK, both occur at the same frequency. If the indicator takes values below 0.5 the frequency of DK exceeds INR. In contrast to the ID ratio this indicator is equilibrate and standardized. We suggest deciding whether to use ID or IDI with regard to the research question.
Both ratios are information criterions, which may supplement the analysis of the list of potentially flawed items. They present information on the structure of the missing values in an easily comprehensible form. The potentially flawed items can be evaluated more quickly. For example, a fairly high ratio of INR and an ID ratio close to zero most likely indicate a problematic item. In such a case INR should be significantly higher than for the rest of the items and the ID ratio indicates even more DK answers.
Step Two: Determining a threshold value
Identifying potentially flawed items requires a quantitative benchmark, which enables us to determine whether the items show distinctive features or not. An important advantage of a quantitative approach is that a threshold value can be calculated. If a question´s specific INR exceeds the threshold value the question may be flawed and, thus, it is selected for further investigation in the next step. The result of the second step is the compilation of a set of questions, which might be flawed. As the chosen threshold value fundamentally determines which items are deemed problematic, we will discuss this issue in more detail.
For any survey developed according to well-established design principles and fielded properly, we expect the distribution of INR to be positively skewed as shown in Figure 2. Most of the items in the questionnaire are expected to show low or no INR and therefore only some items are critical in sense of INR, resulting in a skewed distribution. In other words, per definition we suspect some items to be outliers. Measuring INR for every variable and shifting the focus on the questionnaire as a whole brings us to apply outlier detection methods to simplify and accelerate data quality analysis.
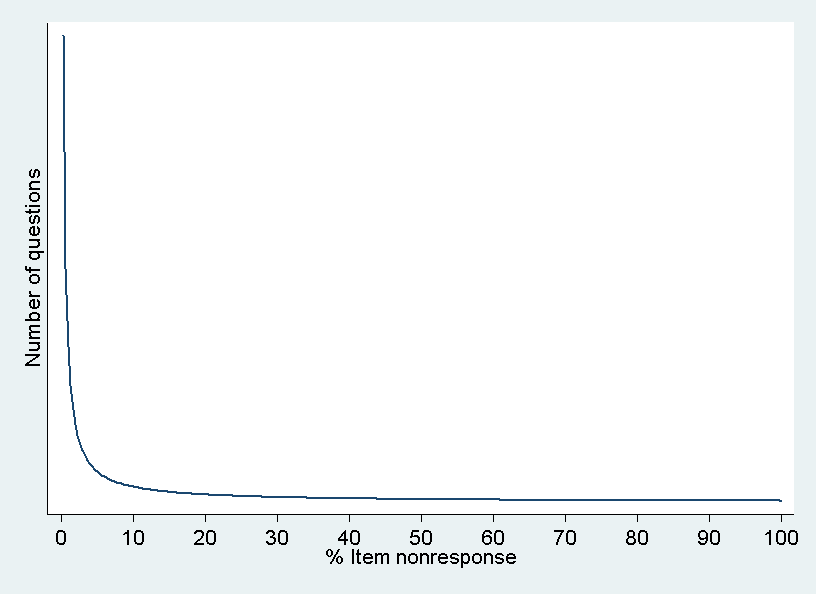
Figure 2: Exemplary distribution of INR in a data set
Due to the variation in data collection methods, questionnaire lengths, question sequences, and survey topics, we expect that the distribution and the average extent of INR will differ from survey to survey. For example, as De Leeuw (2005), De Leeuw et al. (2003), Heerwegh (2009), Heerwegh & Loosveldt (2008), Koch & Blohm (2009), and others have pointed out INR is generally higher in self-administered surveys like Internet surveys, where “no answer” is often explicitly offered as a response option or respondents can implicitly refuse to answer by skipping questions. In the absence of an interviewer no social barrier to “refuse” needs to be overcome. On the other hand, refusals to sensitive questions, for example questions addressing sexuality and income related topics, are more likely in interviewer-administered surveys (Tourangeau, et al., 2000, pp. 255-279). The specific topic(s) of a survey might also have an effect on the average level of INR. If the topic of a survey is highly sensitive and the questionnaire includes many sensitive items, we expect the average level of INR to be higher. A survey may also contain only few stimuli to refuse a question but still include some flawed questions, because they were fielded for the first time and could not be pretested due to, for example, budget restriction or the lack of time. The INR to the questions in such a survey should be very small, except for the flawed ones.
To summarize, INR is largely an individual characteristic of each survey. Analyses of data quality should take this into account by separately determining threshold values for each survey. We recommend using the boxplot criterion.[iii] This procedure is commonly used in the social sciences to identify outliers. The boxplot criterion is defined as:  , where k is a factor which determines the rigidity of the criterion,
  is the third quartile, and IQR is the interquartile range. Commonly k is chosen as 1.5, in some cases as 3 to identify extreme outliers. The boxplot criterion takes the distribution of INR in the respective data set into account and may be used for different surveys. This is why we prefer this criterion to fixed threshold values as for instance “every item with more than 10% INR”.
In step one of our strategy, INR was computed for each variable or question of the survey. We use these indicators to compute and for INR of the whole survey as well as to apply the boxplot criterion to determine a threshold value of INR.
When applying the formula without further extension, the method will result in a list consisting of a more or less large amount of items with small numbers of cases (e.g.,  ). For these items a single nonresponse case may affect the INR to exceed the threshold. Because of the small n, random error may be the source of this INR. Thus, we recommend to calculate the confidence intervals (CI) for INR and to treat every item as uncritical whose lower 2.5% CI value (
 ) is smaller than the calculated threshold value. All items which are only included by chance as a consequence of sampling will be excluded from the list of critical items.[iv]
Step Three: Expert evaluation of selected questions
The final step revolves around the set of items that are to be recipients of further investigation. The individual questions are reviewed by experts independently of each other (Groves, et al., 2009, pp. 260-261). Each expert evaluates the set of potentially flawed items using a fixed list of criterions. There is a broad discussion of what a “good” question is (e.g. Czaja & Blair, 2005; Faulbaum, et al., 2009; Fowler & Cosenza, 2008; Groves, et al., 2009; Schuman & Presser, 1996). This literature helps us to decide whether a question is “good” or “bad” and it points out which characteristics of the question are of importance. Thus, we recommend synthesizing a unique checklist of the literature or applying an existing list for each survey (cf. Groves, et al., 2009, pp. 260-261). A coding scheme for the checklist enhances comparability and reduces problems of transparence and reproducibility of this more qualitative approach. After reviewing the set of questions, the results of the experts are compared. In this process they try to figure out what causes the INR for each item. The characteristics and the (lack of) quality of a question should ultimately explain the observed INR. Hence, the expert evaluation approach aims at assessing the characteristics and the quality of a question. Appending our strategy with this qualitative component allows us to take the variation of context and content of each individual survey into account.
Generally, we recommend making use of expert evaluations. As shown, there is manifold literature on criteria of “good” questions. Using this information, researchers can evaluate questions of their surveys. This may be a first step before applying more expensive or work-intensive methods as, for instance, cognitive pretesting.
An Illustrative Example
We applied the proposed three-step strategy to five surveys of the GLES 2009 with a total of 2929 items. Our goals were to identify potentially flawed questions and to document these in a data quality report as well as to assess the quality of each questionnaire before re-using them in the surveys of the GLES 2013. Using automated syntax files we computed the basic indicators as well as the threshold values and compiled lists of potentially flawed questions for each of the surveys within a couple of minutes. Then, the lists were merged and used for the expert evaluation, which drew on a previously prepared checklist. The results were combined into a summarizing judgment on the most likely causes of INR and recommendations to improve the question wording or the question design were provided whenever this was possible. All in all, we identified 50 questions with an INR above the threshold values. Of these 50 questions, 24 were identified in one and 26 in two or more of the surveys. Applying the strategy to these questions took us approximately 25 minutes per item. Thus, in regard to the overall number of questions and surveys from different modes, we conclude that using our strategy was time and cost saving. Finally, the findings were reported to the primary investigators of the GLES and documented in a data quality report (see Gummer & Roßmann, 2013).
To further demonstrate the added value of our strategy, we provide an illustrative example. The open-ended question on the duration of unemployment (box 1) had an INR of 24.5% and 35.5% in two of the surveys. In both surveys, an ID ratio of 8.1, respectively 10.1, clearly indicates that INR was much higher than DK answers. The IDI ratio supplements this interpretation by showing that in both surveys INR was the main source of missing answers (IDI ratio = 0.9). Following our strategy, the question was subsequently examined by two experts using a coding scheme. The investigation resulted in the identification of an insufficient interviewer instruction as most likely cause of the high INR. If a respondent had not been unemployed in the last 10 years, the interviewer was expected to enter “0” months as answer. Obviously, some of the interviewers were not able to infer this information from the imprecise interviewer instruction. As a consequence, at least some of the interviewers choose the “no answer” option, because they might have considered this to be the appropriate answer. Based on this finding, it was recommended to add more detailed interview instructions and/or add a filter question, which asks the respondents whether they were unemployed in the last 10 years in advance.

Box 1: Question “Duration of unemployment” Source: Pre- and post-election cross-section surveys of the GLES (ZA5300, ZA5301). Translation of the German question wording by the authors.
Conclusion
In this paper we suggest a three-step strategy for ex post evaluation of data quality in terms of item nonresponse. Our strategy operates in a mostly quantitative way to benefit from key features of this research paradigm.
Advantages of the suggested strategy for practical use, for example, in large-scale survey programs with a lot of data sets and a variety of institutions performing a broad range of data collection, are threefold: First, the approach facilitates the identification of potentially flawed questions by taking all items of a survey into account. Therefore, one has not to rely on the presumably biased knowledge and subjective believes of the researchers involved in the evaluation process. As a result, selectivity in the identification process is minimized.
Second, the strategy requires the researcher to determine a reasonable threshold value, by which items are flagged, in advance. In further steps these items are checked by using a pre-defined checklist. By standardizing the course of action and applying comprehensible tools the process of evaluation becomes transparent and reproducible.
Third, by breaking down the strategy into discrete steps with clearly defined actions, we achieve applicability for large-scale usage. Steps one and two can be coded as a small program in standard statistical software packages (e.g., STATA, R or SPSS) which determines the threshold value, examines the data set, and prints out a list of potentially problematic items as a result. An exemplary STATA Do-file is provided for download.
To conclude, the three-step strategy is an applicable, transparent and formalized approach, which shows its full potential when it is applied to large data sets or complex survey settings. That said, it is not a substitute to standard data quality evaluation approaches but a complement. For instance, respondent-centered question testing methods like cognitive interviewing have their strengths in the detection of comprehension or response problems, which wouldn’t be discovered using standard testing methods. On the downside, cognitive interviews are time-consuming and expensive when used on a large scale. Thus, our strategy should be thought of as a supplement to other methods. In this regard it broadens the inventory of available tools. It might be used to back up results from previous tests. The identification of potentially flawed questions in existing data sets also allows for a comprehensible selection of questions to be undertaken further investigation (e.g., cognitive pretesting or split-ballot experiments). Thus, we encourage the application of our three-step strategy in survey research that aims at the successive improvement of questions and questionnaires as well as in data quality research.
[i] We excluded all cases that did not receive a question due to skip patterns, i.e. cases where questions were not applicable (NAP).
[ii] It should be noted that it is not always possible to distinguish between INR and DK responses. This is often the case in self-administered surveys (e.g., mail or Web surveys), which do not provide explicit “no answer” and “don’t know” response options. Nonetheless, the strategy can be successfully applied to identify potentially problematic question. However, we strongly recommend to distinguish between different types of (non-)responses whenever it is possible, especially if we have to assume that these (non-)responses have different causes.
[iii] In this article we focus on an elaborate approach in the social sciences, which is easy to compute and has the advantage of transparency. For statistically more complex methods one could refer to Barnett & Lewis (1994) and others. Nevertheless, the methods discussed by these authors are compatible to our suggested three-step strategy and may be implemented in step two of our proposed strategy.
[iv] We ran the analysis on five data sets of the German Longitudinal Election Study 2009. Using the boxplot criterion with k=1.5 we determined a quite low threshold value. About 50% of the identified items were questions with complex skip patterns and small numbers of cases.
References
1. Barnett, V., & Lewis, T. (1994). Outliers in Statistical Data (3rd Edition ed.). Chichester: Wiley.
2. Beatty, P., & Herrmann, D. (2002). To Answer or Not to Answer: Decision Processes Related to Survey Item Nonresponse. In R. M. Groves, D. A. Dillman, J. L. Eltinge & R. J. A. Little (Eds.), Survey Nonresponse (pp. 71-85). New York: Wiley.
3. Biemer, P. P., & Lyberg, L. E. (2003). Introduction to Survey Quality. Hoboken, NJ: John Wiley & Sons, Inc.
4. Campanelli, P. (2008). Testing Survey Questions. In E. De Leeuw, J. J. Hox & D. A. Dillman (Eds.), International Handbook of Survey Methodology (pp. 176-200). Boca Raton: CRC Press.
5. Czaja, R., & Blair, J. (2005). Designing Surveys: A Guide to Decisions and Procedures. Thousand Oaks: Pine Forge Press.
6. De Leeuw, E. D. (2005). To Mix or Not to Mix Data Collection Modes in Surveys. Journal of Official Statistics, 21(2), 233-255.
7. De Leeuw, E. D., Hox, J. J., & Huisman, M. (2003). Prevention and Treatment of Item Nonresponse. Journal of Official Statistics, 19(2), 153-176.
8. Faulbaum, F., Prüfer, P., & Rexroth, M. (2009). Was ist eine gute Frage? Die systematische Evaluation der Fragenqualität. Wiesbaden: VS Verlag für Sozialwissenschaften.
9. Fowler, J., Floyd J., & Cosenza, C. (2008). Writing Effective Questions. In E. De Leeuw, J. J. Hox & D. A. Dillman (Eds.), International Handbook of Survey Methodology (pp. 136-160). Boca Raton: CRC Press.
10. Gabriel, O. W., & Thaidigsmann, S. I. (2009). Item Nonresponse: Ausprägung und Ursachen. In H. Schoen, H. Rattinger & O. W. Gabriel (Eds.), Vom Interview zur Analyse: Methodische Aspekte der Einstellungs- und Wahlforschung (pp. 283-320). Baden-Baden: Nomos.
11. Groves, R. M., Fowler, F. J., Couper, M. P., Lepkowski, J. M., Singer, E., & Tourangeau, R. (2009). Survey Methodology. Hoboken, NJ: Wiley.
12. Gummer, T., & Roßmann, J. (2013): Item-Nonresponse. In M. S. Blumenberg, J. Roßmann & T. Gummer (Eds.), Bericht zur Datenqualität der GLES 2009 (pp. 40-132). GESIS – Technical Reports, 2013/14. Mannheim: GESIS.
13. Heerwegh, D. (2009). Mode Differences Between Face-to-face and Web Surveys: An Experimental Investigation of Data Quality and Social Desirability Effects. International Journal of Public Opinion Research, 21(1), 111-121.
14. Heerwegh, D., & Loosveldt, G. (2008). Face-to-face Versus Web Surveying in a High-Internet-Coverage Population. Differences in Response Quality. Public Opinion Quarterly, 72(5), 836-846.
15. Koch, A., & Blohm, M. (2009). Item Nonresponse in the European Social Survey. ask Research & Methods, 18(1), 45-65.
16. Lenzner, T. (2012). Effects of Survey Question Comprehensibility on Response Quality. Field Methods, 24(4), 409-428.
17. Morren, M., Gelissen, J. P. T. M., & Vermunt, J. K. (2012). Response Strategies and Response Styles in Cross-Cultural Surveys. Cross-Cultural Research, 46(3), 255-279.
18. Pickery, J., & Loosveldt, G. (1998). The Impact of Respondent and Interviewer Characteristics on the Number of “No Opinion” Answers. Quality & Quantity, 32, 31-45.
19. Pickery, J., & Loosveldt, G. (2001). An Exploration of Question Characteristics that Mediate Interviewer Effects on Item Nonresponse. Journal of Official Statistics, 17(3), 337-350.
20. Pickery, J., & Loosveldt, G. (2004). A Simultaneous Analysis of Interviewer Effects on Various Data Quality Indicators with Identification of Exceptional Interviewers. Journal of Official Statistics, 20(1), 77-89.
21. Presser, S., Couper, M. P., Lessler, J. T., Martin, E., Martin, J., Rothgeb, J. M., et al. (2004). Methods for Testing and Evaluating Survey Questions. Public Opinion Quarterly, 68(1), 109-130.
22. Presser, S., Rothgeb, J. M., Couper, M. P., Lessler, J. T., Martin, E., Martin, J., et al. (2004). Methods for Testing and Evaluating Survey Questionnaires. New York: Wiley.
23. Saris, W. E., & Gallhofer, I. (2007a). Design, Evaluation, and Analysis of Questionnaires for Survey Research. New York: Wiley.
24. Saris, W. E., & Gallhofer, I. (2007b). Estimation of the Effects of Measurement Characteristics on the Quality of Survey Questions. Survey Research Methods, 1(1), 29-43.
25. Schuman, H., & Presser, S. (1996). Questions & Answers in Attitude Surveys. Thousand Oaks, London, New Dehli: SAGE.
26. Shoemaker, P. J., Eichholz, M., & Skewes, E. A. (2002). Item Nonresponse: Distinguishing Between Don’t Knows and Refuse. International Journal of Public Opinion Research, 14(2), 193-201.
27. Stocké, V., & Stark, T. (2005). Stichprobenverzerrung durch Item-Nonresponse in der international vergleichenden Politikwissenschaft. Universität Mannheim.
28. Tourangeau, R., Rips, L. J., & Rasinski, K. (2000). The Psychology of Survey Response. Cambridge, New York, Melbourne, Madrid, Cape Town, Singapore, Sao Paulo: Cambridge University Press.
29. Weisberg, H. F. (2005). The Total Survey Error Approach. A Guide to the New Science of Survey Research. Chicago, London: The University of Chicago Press.
-
Keywords
calibration CATI coverage coverage bias cross-national surveys data linkage data quality European Social Survey experiment face-to-face face-to-face survey Facebook hard to reach populations incentives item nonresponse measurement measurement error mixed-mode surveys multitasking non-probability samples Nonresponse nonresponse bias nonresponse rates paradata PIAAC Probability sample probability samples QR codes rare populations response rate Satisficing social desirability Social media survey survey-taking climate survey data survey management survey methods Telephone survey telephone surveys total survey error unit nonresponse validity web survey Web surveys weighting
