Does the Choice of Header Images influence Responses? Findings from a Web Survey on Students’ Housing Situation
Barth A. (2014). Does the Choice of Header Images influence Responses? Findings from a Web Survey on Students’ Housing Situation, Survey Methods: Insights from the Field. Retrieved from https://surveyinsights.org/?p=4350
© the authors 2014. This work is licensed under a Creative Commons Attribution 4.0 International License (CC BY 4.0) 
Abstract
Online questionnaires can easily be complemented by logos, graphics and images. Yet visual cues can influence responses – adding images to survey questions has proven to alter reported frequencies and attitudinal judgments. Our experiment, which was embedded in a web survey on students’ housing conditions (N=4,676), addresses the effects of continuous exposure to a content-related image. Participants saw one of three different residential scenarios or no image, respectively, in the header of each page throughout the whole survey. It is expected that different pictures influence self-rated satisfaction with the current housing situation and the evaluation of city attributes. Contrary to the hypotheses, the choice of image has no effect on answers to attitudinal questions. Possible implications of image positioning and repetition are discussed in the light of this surprising finding.
Keywords
images, visual context effects, Web surveys
Copyright
© the authors 2014. This work is licensed under a Creative Commons Attribution 4.0 International License (CC BY 4.0)
Introduction
Examples of context effects in survey measurement are manifold. Structural and verbal elements such as question order, format of response options or small changes in wording can substantially influence respondents’ answers (Schuman & Presser, 1981; Schwarz & Sudman, 1992; Tourangeau & Rasinski, 1988), but also visual information such as colour (Tourangeau, Couper & Conrad, 2007), item position (Toepoel & Dillman, 2011; Tourangeau, Couper & Conrad, 2013) and images (Couper, Tourangeau & Kenyon, 2004; Couper, Conrad & Tourangeau, 2007; Witte, Pargas, Mobley & Hawdon, 2004) has been shown to alter the way in which respondents perceive a question’s meaning. Effects of the visual context have become especially salient with the rise of web surveys as the range of design possibilities in the web is almost unlimited and images, multi-media applications and interactive elements can easily be included in a web survey.
Couper et al. (2004) differentiate between “task” and “style” elements in the design of a survey. Task elements consist of essential information needed in order to respond to the survey. They are typically verbal elements: question wording, response options and instructions. Visual elements such as feeling thermometers, arrows or response categories in the form of pictures also belong to the category of task elements as they are essential parts of a question. Task elements are distinguished from style elements which are not necessary for answering the survey. The style elements include the overall design of a web survey, e.g. background colours, typefaces, pictures or logos. Couper et al. (2004) remark that the differentiation between style and task elements may sometimes be lost on respondents. Thus, visual elements that were included as embellishments by the survey designers may be perceived as task-related by respondents and, as an unintended consequence, influence the response process. Therefore, the question of when and how visual elements are likely to alter responses is very relevant to the designers of web surveys.
The present study aims to deepen the understanding of visual context effects. We test the effects of a particular kind of visual elements, namely colour photographs. Up to the present, image-related effects on responses have only been demonstrated in settings where the single appearance of an image affected responses to a specific question. The effects of repetition of the same image on each questionnaire page have not received attention so far, though it is a common feature of web surveys to include pictures and logos in a corporate design that is used throughout the whole survey. Our experiment is therefore focused on effects of content-related images that are repeatedly displayed on each page.
Previous research has shown that images can seriously affect survey responses. Couper et al. (2004) and Toepoel and Couper (2011) report several examples for an assimilation effect caused by photographs in a web survey. Presenting respondents with pictures of a high-frequency event, such as grocery shopping, leads to a higher number of reported events whereas pictures of a low-frequency event (e.g. shopping for clothes) decrease the number of reports. Here, a term that is relatively open to interpretation by the respondent (in this case “number of shopping trips in the last month”) is put into a specific context by the image that accompanies the question. Depending on the choice of image, different associations are triggered, thus determining which types of events respondents include in their answer. There is also the possibility of pictures leading to contrast effects: Couper et al. (2007) conducted an experiment with the outcome that people rated themselves as healthier when they were exposed to the photograph of a sick woman in a hospital compared to the picture of a healthy woman jogging. In this case, photographs next to survey questions alter respondents’ standard of comparison: they evaluate their own situation more or less favourably depending on the context set by the picture.
Experimental design and hypotheses
We test the effects of repeated exposure to a certain image in a web survey on students’ housing conditions. Three combinations of photographs were selected in order to represent different forms of accommodation: a sparsely furnished room in a bleak tower block, an ‘average’ student’s room in a residential home and a bright, spacious apartment in an exclusive neighbourhood. It is expected that the respective image sets a standard of comparison against which the participants evaluate their own accommodation, thus affecting their stated satisfaction with their current housing situation. Further, we assume that the three housing scenarios trigger different associations with regard to the city of residence; depending on the image, ratings of the city in terms of beauty and costs are expected to differ.
When design elements such as images or logos are displayed more than once in a web survey, they are usually located at the same position on each questionnaire page. Judging from the default settings of several well-established web survey providers, the most common position for images that are repeated on every screen is the header area above the questions. We therefore chose to display the images in the header in our experiment as it provides the most realistic conditions for a web survey.
At the very beginning of the survey, respondents were randomly allocated to one of four different conditions: a header image of (1) upscale, (2) average or (3) deprived housing conditions, or (4) no image as the control condition. Each image featured a combination of three photographs showing the interior of a room, one or several houses and a street view in a residential area, all taken in the city of Bonn. By embedding the images directly into the graphical surface of the questionnaire via CSS script[i], it was made sure that everyone was able to see them irrespective of devices to block certain web page contents (e.g. ad blockers). The respective header appeared on top of each questionnaire page from the beginning and stayed the same throughout the whole survey.
The option “upscale” depicted a street and a mansion in an elegant residential area as well as a spacious interior with stucco ornamentation and designer furniture (see figure 1).
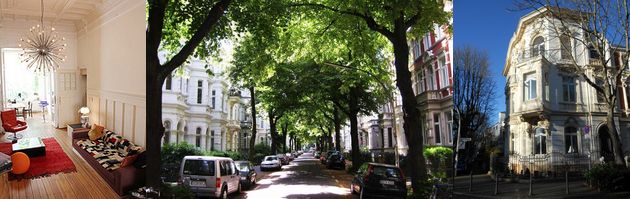
Figure 1: Image of upscale housing conditions
The second condition was composed of images that represent average housing conditions for a student audience, showing a student dorm from the exterior and interior as well as a street in one of the central residential areas of the city (see figure 2).

Figure 2: Image of average housing conditions
The header associated with deprived housing conditions consisted of tower blocks and a grey street view in Tannenbusch, a very unpopular part of the city, and a sparsely furnished interior (see figure 3).
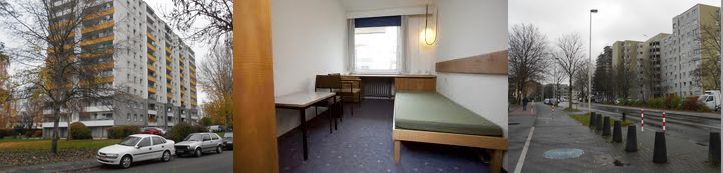
Figure 3: Image of deprived housing conditions
In the control condition, the header was held in light turquoise with only the title of the survey (“Student housing in Bonn”) and the logo of the students’ union (see figure 4).

Figure 4: Control condition without image
The header took about one fourth of each questionnaire page, the questions underneath were displayed on a light grey background (see figure 5 as an example).
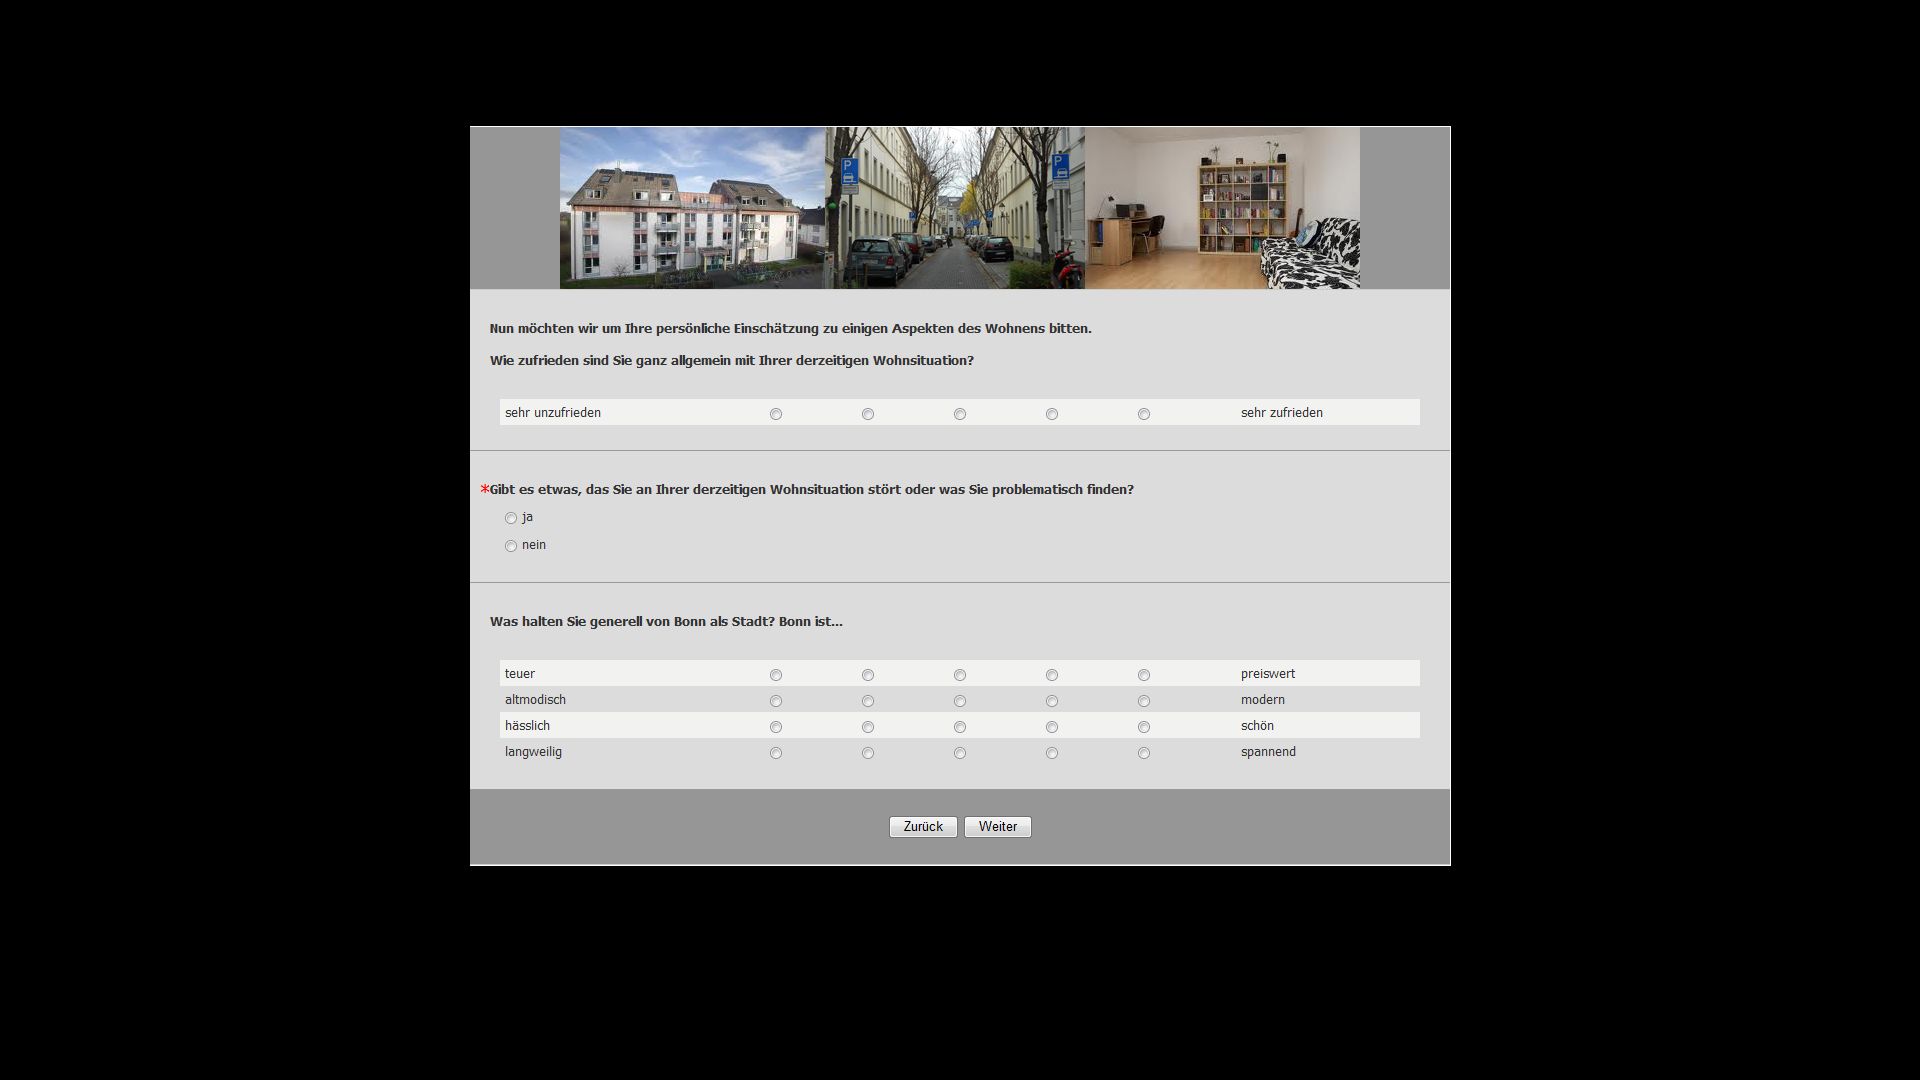
Figure 5: Example of questionnaire page
The first hypothesis is that the conditions “upscale” and “deprived” produce contrast effects on satisfaction with the current housing situation. The images are expected to set a certain standard against which respondents compare their own situation, similar to the health assessment influenced by images in Couper et al. (2007). It is assumed that respondents who compare themselves against the standard of a deprived housing situation feel more satisfied with their own situation, while those exposed to the upscale picture state less satisfaction compared to the “average” and “no image” conditions. The target question is “How satisfied are you, all in all, with your current housing situation?” with answers on an endpoint-labelled scale with five points from “very dissatisfied” to “very satisfied”.
The second hypothesis is concerned with an assimilation effect in the rating of the city. Bonn is to be rated on bipolar five-point scales which assess respondents’ evaluations of the beauty, price level, modernity and interestingness of their place of study. Considering attitude judgements as temporary constructions (Wilson & Hodges, 1992; Tourangeau, Rips & Rasinski, 2000), the respective images are expected to increase the accessibility of certain considerations; highly accessible considerations are likely to be deemed relevant by the respondents and thus play a dominant role in response formation (Tourangeau et al., 2000). In our case, an influence of the header images is hypothesized on the two options “expensive – cheap” and “ugly – beautiful”. In the first semantic differential, we assume that the image of an elegant residential area evokes associations with expensive parts of the city, while the grey tower blocks and the student home of the other image conditions call cheaper flats and areas to mind. Therefore, we expect that the rating of expensiveness is higher in the condition “upscale” compared to the images of “average” and “deprived” housing situations. Concerning the rating of the city’s beauty, it is hypothesized that the sunlit avenue lined with trees and the mansion-like house remind respondents of beautiful aspects of the city, while the combination of photographs in the condition “deprived” triggers associations of shabby districts. Thus, we expect that respondents in the latter condition will judge the city as uglier than respondents who are exposed to the “average” and “upscale” images.
Sample and data collection
The experiment was integrated in a web survey on student housing conditions that was conducted on behalf of the student union of the University of Bonn in Germany. The invitation to participate was sent out to all students enrolled in Bonn in December 2012 via the university’s e-mail system which sums up to approximately 30,800 invitations. About three thirds of the 6,074 students who logged on to the survey website completed the whole survey. One fifth of the visitors just looked at the first page and five percent started responding but dropped out somewhere in the process. After removing lurkers and early break-offs from the data, a total of 4,676 valid responses were obtained. Using the standard definitions of the American Association for Public Opinion Research (AAPOR, 2011), the response rate 2 was 15.9%. Comparing partial and complete responses to the total number of visits to the survey website, a cooperation rate 2 (AAPOR, 2011) of 81.2% was obtained[ii]. There were no significant differences in cooperation between the four experimental conditions (df=6, χ²=8.1, p=.23), which suggests that the presence or content of the header images did not influence respondents’ motivation to take part in or complete the survey.
In the invitation e-mail, people were informed that the aim of the survey was to evaluate the current housing situation and the problems students experienced in flat hunting and that the information would be used by the students’ union to raise public attention for the increasing housing shortage and to develop tailored solutions for the students. In the survey, participants were asked about their satisfaction with their current housing situation, problems they experienced with their flat, whether they had trouble in flat hunting, how they rated their city of residence on various dimensions and other questions concerning their housing situation. Time for responding to the questions was about five minutes (mean: 267 seconds, standard deviation: 172 seconds[iii]). No incentives were offered in exchange for participation. The allocation of participants to one of the four experimental groups was accomplished by a simple random generator based on system time. Table 1 shows that there were no significant differences in key demographics and housing situation across the groups.
Table 1: Distribution of key demographics across experimental groups in percent
|
Deprived |
Average |
Upscale |
No image |
Total |
||
|
Gender |
Male |
39.1 |
38.5 |
38.3 |
34.8 |
37.7 |
|
Female |
60.9 |
61.5 |
61.7 |
65.2 |
62.3 |
|
|
χ²= 5.52 df=3 p =.14 |
||||||
|
Current number of semesters |
Mean |
5.2 |
5.5 |
5.2 |
5.4 |
5.3 |
|
S.D. |
4.1 |
4.7 |
4.5 |
4.4 |
4.4 |
|
|
F [3,4460]=1,16 p=.33 |
||||||
|
Housing situation |
Shared flat |
29.5 |
29.6 |
28.2 |
31.7 |
29.7 |
|
Single flat |
22.7 |
24.6 |
22.7 |
21.5 |
22.9 |
|
|
Residential home |
16.9 |
16.2 |
17.8 |
15.7 |
16.7 |
|
|
With parents or relatives |
16.3 |
14.8 |
14.7 |
16.8 |
15.6 |
|
|
With partner and/or children |
14.5 |
14.7 |
16.6 |
14.3 |
15.1 |
|
|
χ²= 11.52 df=12 p=.49 |
||||||
|
Currently looking for a flat |
yes |
18.2 |
20.2 |
19.0 |
18.2 |
18.9 |
|
no |
81.8 |
79.8 |
81.0 |
81.8 |
81.1 |
|
|
χ² =2.11 df=3 p=.55 |
||||||
|
N |
1134 |
1217 |
1180 |
1145 |
4676 |
|
Results and discussion
The hypothesized contrast effect on stated satisfaction with the current housing situation was tested with an analysis of variance. Though the mean value of stated satisfaction in the “deprived” condition is slightly higher than the others, the differences fail to reach statistical significance (see table 2). We further tested whether the actual situation of the participants interacts with the effect of the picture – for example, for someone living in a shabby room in a residential home, the “average” condition could already set a higher standard of comparison while the inhabitant of an expensive flat might regard this picture as a rather undesirable housing situation. As a control for this variability, the current housing situation (“with parents or relatives”, “single flat”, “shared flat”, “together with partner and/or children” or “residential home”) was integrated as an independent variable into the model. The analysis shows that the factor “housing situation” is highly significant (F[4, 4577]=30.61, p < .001), yet the effect itself is very small (eta²=.03). Neither the image factor (F[3, 4577]= 1.92) nor the interaction of image factor and housing situation (F[12, 4577]=.865) are significant. Thus the hypothesis of a contrast effect on satisfaction caused by the different scenarios in the header has to be rejected.
Table 2: Means of satisfaction and city ratings by image condition (standard errors in parentheses)
| Deprived | Average | Upscale | No image | F-ratio | P-value | |
| Satisfaction with current housing situation | 3.63 (1.21) | 3.52 (1.29) | 3.54 (1.23) | 3.55 (1.26) | F[3, 4645]=1.84 | p=.14 |
| City rating: beautiful | 4.31 (.82) | 4.32 (.81) | 4.31 (.83) | 4.30 (.87) | F[3, 4626]= .16 | p=.93 |
| City rating: cheap | 2.16 (.91) | 2.17 (.89) | 2.16 (.89) | 2.17 (.89) | F[3, 4611]= .05 | p=.99 |
Neither is the hypothesis of an assimilation effect in the rating of the city confirmed. The means of the semantic differentials do not show any significant differences with regard to header image content, neither in terms of beauty nor in terms of costs of living. As “very beautiful” and “very cheap” are coded as the highest value (5), one can see that the respondents – irrespective of the header image – quite agree in their assessment of Bonn as a very beautiful, but quite expensive city.
The analysis shows no effect of different header images on the substantial solution. This result is contrary to evidence from previous studies on visual context effects. As we are considering a total sample of over 4600 respondents (more than 1000 in each experimental group), we are confident that the failure to reject the null hypothesis that there are no image effects is not due to a lack of statistical power. A sensitivity test, calculated with G*Power (Faul, Erdfelder, Lang & Buchner, 2007) shows that for an effect size as small as η²=0.004 (ANOVA), the power, i.e. the probability of not committing a type II error, is 95% in our sample. It is therefore worth considering which properties of the present study might account for the lack of significant effects. Maybe the most important point in which the present study differs from previous ones is the repetition of the visual stimulus. Thinking in terms of the differentiation between task and style elements (Couper et al., 2004), we are drawn to the tentative conclusion that repeated exposure to the same image makes respondents interpret it as a style element rather than seeing it as task-related. This means that images in the housing survey were seen as embellishments; respondents did not establish a connection between image content and specific questions, which would explain why responses were not influenced.
Another aspect is the position of the image. Benway and Lane (1998) argue that web users are functionally blind to rectangular graphics at the top of web pages, a phenomenon they call “banner blindness”. They suggest that web users have learned to identify and instinctively ignore everything that has the properties of typical advertisements. However, Couper et al. (2007) test the hypothesis of “banner blindness” in the area of visual context effects with inconclusive results. They find some evidence that the effect of an image is diminished when it appears in the header (in contrast to being placed on a prior screen or in the question area), but the results are not statistically reliable. The present study provides evidence that the header image was not overlooked completely by respondents. In the open space for comments at the end of the survey, several respondents in the “deprived” and “upscale” conditions complained that the pictures were ridiculously bleak or too glamorous, respectively, and by no means representative of students’ housing conditions. These comments show that contrary to the notion of banner blindness, respondents did notice the images in the header. However, the statements can also be seen as a further clue to the conclusion that the header images were perceived as embellishments by the survey participants.
Undoubtedly, more research is required in this area. On the one hand, more studies that vary image position and contrast singular with continuous exposure to an image are needed to come to more decisive conclusions about the effects of visual context. On the other hand, the perception of images in web surveys should be explored in depth using eye-tracking studies (see Galesic, Tourangeau, Couper & Conrad, 2008, for the use of eye-tracking data in survey methodological research), cognitive interviews and an exact recording of response latencies in specially designed experiments. For now, it can only be concluded that some images substantially affect responses in web surveys while others don’t: visual context effects may, in themselves, be context-dependent.
[i] The instrument was programmed in 1ka, a free web survey software developed by the Centre for Social Informatics at Faculty of Social Sciences, University of Ljubljana (http://english.1ka.si/)
[ii] AAPOR RR 2 takes into account completed as well as partially completed questionnaires. In our case, respondents who had completed less than two thirds of the core questions were deleted. AAPOR CR 2 is calculated by dividing the sum of partial and complete responses by the total number of visitors to the survey including early break-offs and lurkers.
[iii] These values are corrected for outliers that took less than 90 seconds or more than half an hour for completion.
References
1. American Association for Public Opinion Research (2011). Standard Definitions: Final Dispositions of Case Codes and Outcome Rates for Surveys. 7th edition. AAPOR.
2. Benway, Jan Panero & David M. Lane (1998). Banner Blindness: Web Searchers Often Miss “Obvious” Links. Internetworking Newsletter, ITG 1.3. Retrieved from http://www.internettg.org/dec98/banner_blindness.html.
3. Couper, Mick P., Frederick G. Conrad & Roger Tourangeau (2007). Visual Context Effects in Web Surveys. Public Opinion Quarterly, 7(4), 623-634.
4. Couper, Mick P., Roger Tourangeau and Kristin Kenyon (2004). Picture This! Exploring Visual Context Effects in Web Surveys. Public Opinion Quarterly, 68(2), 255-266.
5. Faul, Franz, Edgar Erdfelder, Albert-Georg Lang & Axel Buchner (2007). G*Power 3: A flexible statistical power analysis program for the social, behavioral, and biomedical sciences. Behavior Research Methods, 39, 175-191.
6. Galesic, Mirta, Roger Tourangeau, Mick P. Couper & Frederick G. Conrad (2008). Eye-Tracking Data: New Insights on Response Order Effects and Other Cognitive Shortcuts in Survey Responding. Public Opinion Quarterly, 72 (5): 892-913.
7. Schuman, Howard & Stanley Presser (1981). Questions and answers in attitude surveys: Experiments on question form, wording, and context. New York: Academic Press.
8. Schwarz, Norbert & Seymour Sudman (1992). Context Effects in Social and Psychological Research. New York: Springer.
9. Tourangeau, Roger & Kenneth A. Rasinski (1988). Cognitive Processes Underlying Context Effects in Attitude Measurement. Psychological Bulletin, 103 (3), 299-314.
10. Tourangeau, Roger, Lance J. Rips & Kenneth A. Rasinski (2000). The Psychology of Survey Response. Cambridge: Cambridge University Press.
11. Tourangeau, Roger, Mick P. Couper & Frederick G. Conrad (2007). Color, Labels and Interpretive Heuristics for Response Scales. Public Opinion Quarterly, 71 (1), 91-112.
12. Tourangeau, Roger, Mick P. Couper & Frederick G. Conrad (2013). “Up Means Good”– The effect of screen position on evaluative ratings in web surveys. Public Opinion Quarterly, 77, 69-88.
13. Toepoel, Vera & Don A. Dillman (2011). Words, Numbers, and Visual Heuristics in Web Surveys: Is There a Hierarchy of Importance? Social Science Computer Review, 29, 193- 207.
14. Toepoel, Vera & Mick P. Couper (2011). Can Verbal Instructions Counteract Visual Context in Web Surveys? Public Opinion Quarterly, 75(1), 1-18.
15. Wilson, Timothy D. & Sara D. Hodges (1992). Attitudes as temporary constructions. In: Martin, Leonard L. and Abraham Tesser (Eds.), The construction of social judgments. Hillsdale, NJ, England: Lawrence Erlbaum Associates, 37-65.
16. Witte, James C., Roy P. Pargas, Catherine Mobley & James Hawdon (2004). Instrument Effects in Web Surveys. A Research Note. Social Science Computer Review, 22(3), 363-369.
-
-
Call for the Special Issue:
Surveying people living in nursing homes –Challenges and Solutions
Keywords
calibration CATI coverage cross-national surveys data linkage data quality European Social Survey experiment face-to-face face-to-face survey Facebook hard to reach populations incentives interviewer characteristics item nonresponse mail survey measurement measurement error multitasking non-probability samples Nonresponse nonresponse bias nonresponse rates paradata PIAAC Probability sample probability samples QR codes rare populations response rate Satisficing social desirability Social media survey survey-taking climate survey data survey management survey methods Telephone survey telephone surveys total survey error unit nonresponse validity web survey Web surveys weighting