

Testing the Validity of the Crosswise Model: A Study on Attitudes Towards Muslims
Johann D. & Thomas K. (2017). Testing the Validity of the Crosswise Model: A Study on Attitudes Towards Muslims Survey Methods: Insights from the Field. Retrieved from https://surveyinsights.org/?p=8887
© the authors 2017. This work is licensed under a Creative Commons Attribution 4.0 International License (CC BY 4.0) 
Abstract
This paper investigates the concurrent validity of the Crosswise Model when “high incidence behaviour” is concerned by looking at respondents’ self-reported attitudes towards Muslims. We analyse the concurrent validity by comparing the performance of the Crosswise Model to a Direct Question format. The Crosswise Model was designed to ensure anonymity and confidentiality in order to reduce Social Desirability Bias induced by the tendency of survey respondents to present themselves in a favourable light. The article suggests that measures obtained using either question format are fairly similar. However, when estimating models and comparing the impact of common predictors of negative attitudes towards Muslims, some puzzling results are revealed raising concerns about the validity of the Crosswise Model.
Keywords
attitudes towards Muslims, crosswise model, validity
Acknowledgement
This work was supported by the Austrian National Election Study (AUTNES), a National Research Network (NFN) sponsored by the Austrian Science Fund (FWF) [S10902-G11]. We thank Ben Jann for his kind support and the anonymous reviewers for their constructive feedback.
Copyright
© the authors 2017. This work is licensed under a Creative Commons Attribution 4.0 International License (CC BY 4.0)
Introduction
Social Desirability Bias (SDB) induced by other-deception – i.e., respondents purposely misrepresenting the truth as a form of impression management motivated by the desire to avoid evaluation by a third party, such as survey interviewers (Goffman, 1959; Nederhof, 1985) – poses a threat to the quality of survey responses. Early research on socially desirable response patterns has indicated that, even when factual questions are concerned, researchers need to be cautious about the validity of respondents’ answers. It is suggested that the range of invalidity of responses to more sensitive items is “sufficient to cause worry, and indicates a great need for further research on the truthfulness of respondents’ statements” (Parry, & Crossley, 1950; see also Bradburn, & Sudman, 1979). In addition to this, Cannell, Oksenberg, and Converse (1977) and Cannell, Miller, and Oksenberg (1981) further distinguished the effects of positive and negative distortion in survey responses, linking positive bias to socially desirable and negative bias to socially undesriable behaviour. As such, there has been demand for the improvement of old and development of new techniques to enable survey respondents’ to more truthfully answer survey questions and, thus, to enhance the overall quality of survey data.
So-called Randomized Response Techniques (RRTs) have been developed to improve the way in which respondents’ anonymity and confidentiality in reporting sensitive attitudes or behaviour in surveys is preserved and to reduce bias due to socially desirable response behaviour (Warner, 1965; Horvitz et al., 1968; Greenberg et al., 1969; Boruch, 1971; Bradburn, & Sudman, 1979; Locander, Sudman, & Bradburn, 1976; Kuk, 1990; Daniel, 1993; see also Lensvelt-Mulders, Hox, van der Heijden, & Maas, 2005; Krumpal, Jann, Auspurg, & von Hermanni, 2015; Fox, 2015; Chaudhuri, 2016). Typically, RRTs rely on randomization devices, which obscure the meaning of an answer communicated to the interviewer and then allow estimating the prevalence of the sensitive characteristic using elementary probability theory (Krumpal et al., 2015). However, while successfully reducing SDB, RRTs may induce bias by design, for example, by providing complex or unusual instructions which immediately alert respondents (Ulrich, Schröter, Striegel, & Simon, 2012) and may lead to instant self-protective ‘no’-answers (Krumpal et al., 2015).
The Crosswise Model (CM) was especially designed to overcome these issues (Yu, Tian, & Tang, 2008). It relies on a simple design that only requires respondents to provide one simple yes/no-answer to a set of two different questions without burdening them with complex instructions or activities (Ulrich et al., 2012, Höglinger, Jann, & Diekmann, 2014, Korndörfer, Krumpal, & Schmukle, 2014). While one question directly asks about the sensitive attitude, the other one directly enquires about an unrelated non-sensitive topic. However, respondents are instructed to provide only one answer to both questions. Response A, if the answers to both questions are the same (either both ‘yes’ or both ‘no’); Response B, if the answers to the two questions differ (either ‘yes’ and ‘no’ or ‘no’ and ‘yes’).
Simple probability methods then allow estimating the prevalence of the sensitive item, if (1) both behaviours are captured as binary responses; (2) the non-sensitive behaviour is unrelated to the sensitive one; and (3) the non-sensitive behaviour has a known probability distribution p (Krumpal et al., 2015): for example, assuming a uniform distribution of birthdays, pis equal to 0.25 if the unobtrusive item asks whether a person was born in October, November, or December
The prevalence of the sensitive item ![]() can then be estimated (Krumpal et al., 2015; see also Yu et al., 2008; Warner, 1965) by
can then be estimated (Krumpal et al., 2015; see also Yu et al., 2008; Warner, 1965) by

where p is the known population prevalence of the non-sensitive item – e.g., p = 0.25 in the birthday example – and ![]() is proportion of respondents giving the same answer to both questions in the CM.
is proportion of respondents giving the same answer to both questions in the CM.
The sampling variance is then obtained as follows:

Individual respondent’s responses to the sensitive item are covered up by the design of the question, so that interviewers and researchers are unable to identify whether or not the respondent provided a yes-answer to the sensitive item. By design, the question should thus encourage respondents to more honest self-reports. In addition to this, the CM is also an attractive way of asking about sensitive behaviour across different survey modes (Yu et al., 2008; Krumpal, 2015), given that sufficient statistical power is provided by the survey design to ensure similar precision of the estimates as direct question formats (e.g., Jann, Jerke, and Krumpal, 2012, Ulrich et al., 2012, Korndörfer, Krumpal, & Schmukle, 2014).
Previous studies have indicated that the CM successfully reduces under-reporting of socially undesirable behaviour, such as plagiarism (Coutts, Jann, Krumpal, & Näher, 2011, Jann, Jerke, & Krumpal, 2012, Höglinger, Jann, & Diekmann, 2014), cheating in games (Hoffmann, Diedenhofen, Verschure, & Musch, 2015; Höglinger, & Jann, 2016), substance abuse (Nakhaee, Pakravan, & Nakhaee, 2013, Shamsipour, Yunesian, Fotouhi, Jann, Rahimi-Movaghar, Saghari, & Asghar Aklhlaghi, 2014), donation of organs (Höglinger, & Diekmann, 2017), sexual behaviour (Vakilian, Mousavi, & Keramat, 2014; Vakilian, Mousavi, Keramat, & Chaman, 2016), tax evasion (Korndörfer, Krumpal, & Schmukle, 2014; Kundt, 2014; Höglinger, & Jann, 2016), undeclared employment (Schnell, Thomas, & Noack, 2017), shoplifting (Höglinger, & Jann, 2016), non-voting (Höglinger, & Jann, 2016), and Xenophobia and Islamophobia (Hoffmann, & Musch, 2016).
However, little research has attempted to more critically evaluate the CM’s underlying mechanisms and their consequences. For instance, only two studies indicate that the CM is prone to producing false positive results that should not be ignored (Höglinger, & Diekmann, 2017; Höglinger, & Jann, 2016). It remains open how the technique performs when (1) high incidence behaviour, i.e. behaviour that occurs more frequently (e.g., Wolter, & Laier, 2014), (2) representative samples (with the exception of Schnell, Thomas, & Noack, 2017), or (3) real-world settings (Krumpal et al., 2015) are concerned. Hence, validation studies exploring how well and in which situations the CM works are required (Jann et al., 2012).
Our core research aim is to investigate the CM’s validity when high incidence behaviour is concerned looking at prejudice against Muslims in the Austrian context. More precisely, we test the concurrent validity of the CM focussing on self-reported attitudes towards Muslims. We proceed as follows: we begin by discussing our approach in further detail. Next, we present the results of our research. We close with a discussion of our findings and their implications for future research
Testing the Concurrent Validity of the CM
Our research relies on data collected by the Austrian National Election Study (AUTNES) (Kritzinger, Johann, Thomas, Glantschnigg, Aichholzer, Glinitzer, Gründl, Oberluggauer, & Wagner, 2016a; Kritzinger, Johann, Thomas, Glantschnigg, Aichholzer, Glinitzer, Gründl, Oberluggauer, & Wagner, 2016b). Respondents were sampled from an online access panel provided by Lightspeed GMI/TNS Option Brussels. The non-probability panel consistsed of approximately 15,000 panelists recruited on an opt-in basis using a combination of indirect approximation methods (Vehovar, Toepoel, & Steinmetz, 2016), such as recruitment by email, co-registration, e-newsletter campaigns, banner placements on webpages and distribution through internal and external networks. In order to participate in the study, respondents had to be at least 16 years old and eligible to vote in the Austrian National Election on Election Day 2013. Eligible panellist were invited to participate in the AUTNES sample according to quotas for gender, age, region, and household size. The panel closely represented the Austrian target populations as described by Statistik Austria (www.statistik.at) with over-representation observed for females (Δ=+1.2%), 20 to 29 year olds (Δ =+1.1%) and the cohort of 60 to 69 year olds (Δ=+5.4%), two person households (Δ=+10.3%) and the regions Vienna and Lower Austria (both Δ=+2.6%) as well as the Burgenland (Δ=+1.1%). Singles (Δ=-17.7%) as well as citizens aged 70 and above (Δ=-11.9%) are under-represented (see Kritzinger et al., 2016b).
We relied on a repeated design: respondents were asked the direct question (DQ) in Wave 1of the panel study, which was fielded between 16 and 28 August 2013. The same respondents were asked the CM question in Wave 4 of the study, which went live on 30 September 2013 until 7 October 2013. The data were collected in Computer Assisted Web Interviews (CAWI). The DQ asked respondents whether or not they would prefer a neighbourhood where no Muslims live and provided a simple binary response code (yes/no). The CM presented respondents with an instruction to provide only one answer (either both answers are the same or they are different) to the following two questions:
Question A: Was your mother’s birthday in January, February, or March?
Question B: If you think of your living arrangements, would you prefer a neighbourhood where no Muslims live?
The direct question was coded as 1, if respondents stated that they preferred a neighbourhood without Muslims and 0 otherwise. The CM was coded as 1, if respondents repondented to the two questions differently, and 0, if respondents gave the same answer to both questions.
Religious beliefs may be prone to SDB driven by prejudiced survey respondents, who do not want to reveal their prejudice (e.g., Cook and Selltiz 1964; Abronson, Wilson, and Brewer 1998). In theory, prejudice is caused by tensions between in-groups (i.e., a large group of citizens within a society sharing a particular characistic) and out-groups (i.e., people who do not share the in-group characteristic), resulting in more frequent negative evaluations of the out-group members (e.g., McConahay, & Hough 1976, Tajfel 1979, Sears 1988, Hogg 2006). Indeed, prior research indicates that estimates of respondents’ holding negative atttiudes towards religious out-groups, such as Muslims, may be affected by SDB, which is visible in under-reporting of the negative attitudes in DQ formats (e.g., Rowatt, Franklin, & Cotton 2005, Velasco González et al. 2008, Beyer & Krumpal 2010, Krumpal 2012). Indeed, two studies have tested different RRT formats including a CM question in capturing Xenophobia and Islamophobia suggesting that all RRTs perform better than the DQ format, but both have fail to more concisely explore the concurrent validity of the RRT answers in relation (Hoffmann, & Musch, 2016; Ostapczuk, Musch, & Moshagen, 2009). Religious prejudice thus seems to constitute an interesting and relevant field of research to further test the validity of the CM.
Typically, research on the properties of the CM begins by estimating the prevalence of the sensitive behaviour or attitudes descriptively, i.e. the descriptive results of the CM are compared to the results of the DQ format. Following the “more is better”-assumption (e.g., Umesh, & Peterson, 1991, Lensvelt-Mulders et al., 2005, Krumpal, 2012, Thomas, Johann, Kritzinger, Plescia, & Zeglovits, 2016),[1] higher descriptive estimates of the CM indicate more accurate results, meaning the CM is better able to capture the actual share of people behaving in the respective way or holding the respective attitudes. However, as the DQ format and the CM are employed in different waves and attitudes towards Muslims may have changed during the electoral campaign, the study design does not allow us to assess whether the CM indeed reveals higher and more accurate estimates of respondents reporting negative attitudes towards Muslims.[2] Yet, the study design provides important insights to the validity of the CM looking at the concurrent validity of the CM, which we investigate by following a stepwise modelling strategy comparing models predicting negative attitudes towards Muslims as estimated by the DQ format and the CM, respectively. We estimate logistic regressions for binary dependent variables for the DQ and Maximum Likelihood (ML) Regression models for the CM (see Jann, Jerke, and Krumpal, 2012, for the derivation and a discussion of the ML estimator for the CM). Our stepwise procedure is appropriate because we expect that some independent variables indirectly influence respondents’ attitudes towards Muslims (e.g. citizens’ implicit preference for Orientals over Occidentals). Other predictors should have a direct impact (e.g., respondents’ explicit attitudes towards Muslims).
We include social demographic predictors that allow us to control for a potential bias caused by discrepancies between sample and population: individuals’ gender, age and education as well as political interest. Age is measured continuously in years. We create binary indicators for gender (1: females, 0: males) and education (1: qualification for higher education, 0: no qualification for higher education). Political interest is measured on a 4-point scale, where higher values indicate increased interest.
Models 1a and 1b also predict respondents’ preferences for a neighbourhood without Muslims looking at their left-right stance. People classifying themselves as more rightist should hold negative attitudes about Muslims (e.g., Rowatt, Franklin, & Cotton, 2005). Respondents’ left-right stance is measured on an 11-point scale, where higher values indicate more rightist views.
In Models 2a and 2b, we introduce respondents’ self-reported attitudes towards Muslims measured on 5-point agreement scales about the following five statements: (1) “Due to the many Muslims living in Austria, I sometimes feel like a stranger in my own country”, (2) “The European lifestyle and the Muslims’ lifestyle are easily compatible”, (3) “Muslims should adapt in order to have fewer problems”, (4) “The Muslims are largely to blame for occasional tensions between Muslims and non-Muslims in Austria”, and (5) “If I had a child, I would feel uncomfortable if my they married a Muslim”. Higher values indicate agreement with the respective statements. We include all attitudinal items in our models at the same time; the Variance Inflation Factor (VIF), which is throughout smaller than 3, indicates that there is no multicollinearity problem including the five statements measuring respondents’ self-reported attitudes towards Muslims separately.
Moreover, we consider respondents’ implicit preference for Occidentals over Orientals (Models 3a and 3b). It is measured by an Affective Misattribution Procedure (AMP) (Appendix O2; see Kritzinger et al. 2016b for a detailed description) with values ranging from -1 (=implicit preference for Orientals over Occidentals) to 1 (=implicit preference Occidentals over Orientals) (see Aichholzer and Zeglovits, 2015, for an example how far the AMP can serve as a validation criterion).
Finally and for completeness, we present full models incorporating all variables at the same time (Models 4a and 4b). Once again, we treat all attitudinal statements as individual explanatory factors to disentangle each individual statements’ influence.
Following Baker et al. (2013), we would like to emphasise that we consider our results to be indications rather than hard estimates, as they are based on data collected on a non-probability panel.
Results
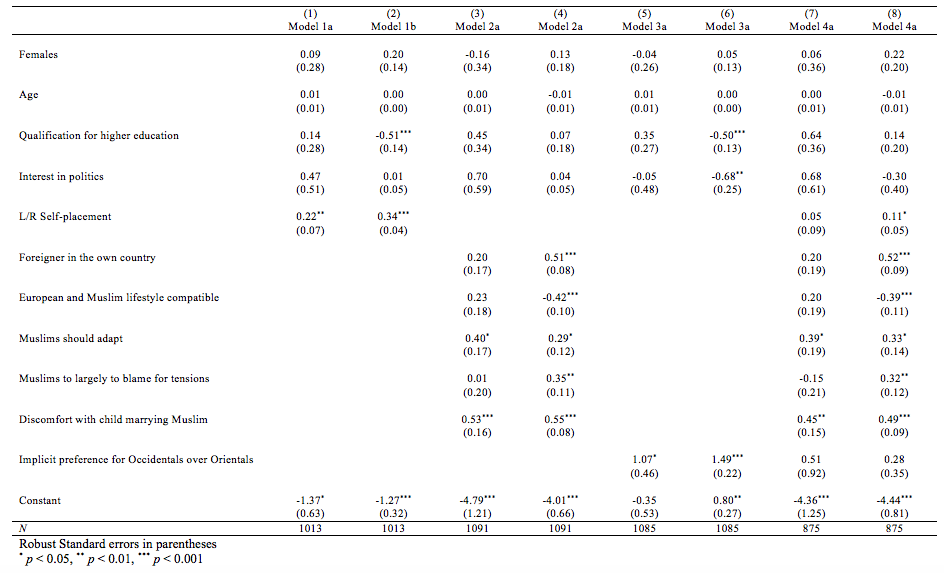
Table 1 summarizes our models predicting negative attitudes towards Muslims. Looking at Models 1a and 1b, it is noteworthy that we find a statistically significant negative influence of responsents with high educational attainment on negative attitudes towards Muslims in the DQ, which substantively implies that well educated respondents are less likely to hold negative attitudes towards Muslims. We do not find a similar effect looking at the CM. A Wald Test indicates that the coefficients of both models significantly differ (p < 0.05). Morever, our results indicate positive influences of respondents’ left-right self-placement on negative attitudes towards Muslims in both models: more rightist citizens appear to hold more negative attitudes towards Muslims in their neighbourhood.
In addition to the socio-demographic controls, Models 2a and 2b include self-reported attitudes towards Muslims. At the first glance, the results reveal relatively consistent results regarding reports about the influence of negative views about Muslims on respondents’ preferences to live in a neighbourhood without Muslims across the CM and DQ model: the coefficients of four critical attitudes point in the same positive direction in the DQ and CM condition indicating that negative attitudes towards Muslims and foreigners correspond with a lower likelihood of wanting to live in a neighbourhood with Muslims. However, the liberal statement suggesting that the European and Muslim lifestyles are compatible stands out: the results reveal a negative influence in the DQ format suggesting that more liberal views correspond with a lower likelihood to live in a neighbourhood with Muslims (which we would expect). However, the coefficient indicates a positive direction for the CM question (which we did not expect). A Wald Test indicates that the coefficients differ significantly (p < 0.001).
Looking at implicit preferences for Occidentals over Orientals in Models 3a and 3b, the results imply that those respondents also hold more negative attitudes towards Muslims, as suggested by the positive direction of the AMP coefficient.
For completeness, we also present full results in Models 4a and 4b, which reinforce some of the inconsistencies regarding explicitly stated attitudes towards Muslims and which additionally indicate a statsically different coefficient for the statement “Muslims are largely to blame for occasional tensions between Muslims and Non-Muslims in Austria” (p < 0.05).
Table 1: Predicting Attitudes towards Muslims using the CM (a) and the DQ (b)
Discussion and Conclusion
The Crosswise Model has repeatedly been found to reliably reduce Social Desriabiliy Bias when estimating low incidence behaviour. However, little is known about its validity when high incidence behaviour or a real-world setting is concerned. By investigating the concurrent validity of the Crosswise Model on reported negative attitudes towards Muslims in Austria, we contribute to a study that may help us to further evaluate the properties of the Crosswise Model.
We would have expected to find that our predictors of negative attitudes towards Muslims point in the same direction across the Direct Question format and the Crosswise Model. However, our results raise further questions about the validity of the Crosswise Model with regard to the concurrent validity in predicting negative attitudes towards Muslims. While we identify some factors that appear to predict the estimates obtained on the basis of the Direct Question format and Crosswise Model well (i.e., regression coefficients point in the same direction and reach conventional levels of statistical significance), other results are rather puzzling.
Traditional indicators of liberalism, such as respondents’ self-reported placement on the left-right continuum, as well as other attitudes towards Muslims seem to produce fairly consistent results indicating that both question formats are able to estimate respondents’ rejection of Muslims as neighbours quite well. However, we are particularly puzzled by some insignificant coefficients of self-reported attitudes towards Muslims in the Crosswise Model, which even point into the opposite direction than in the DQ model. As we rely on strong measures that should indicate an influence in the same direction, such as other negative attitudes towards Muslim and implicit associations, we believe that our results point in the direction that the Crosswise Model may come with problems that have not been fully uncovered yet. As Schnell, Thomas, and Noack (2017) indicate the success of the Crosswise Model in capturing sensitive behaviour or attitudes may be related to respondents cognitive abilities, especially their educational background: well educated respondents may be better able to understand the core principle of the Crosswise Model protecting their anonymity and confidentiality, while less well educated respondents are more concerned about the unusual question format. Our rather peculiar finding regarding respondents education in this study, may be interpreted as support for their findings pointing in a similar direction. Furthermore, we may observe that more sophisticated respondents are not genuinely less negative about Muslims as studies based on Direct Question formats suggests, but that they are simply more aware or more prone to give socially acceptable answers per se, which some research on this matter proposes (e.g., Jackman, 1973, Wagner, & Zick, 1995, Ostapczuk, Musch, & Moshagen, 2009).
To conclude, although the Crosswise Model has previously been commended to be a promising method to reduce Social Desirablity Bias, our research suggests that we yet do not fully understand under what circumstances the method is applicable. Without completely questioning the validity of the Crosswise Model, we encourage future research to more rigorously test questions using the question format in larger population studies, ideally based on probability samples; to investigate high and low incidence behaviour or attitudes; and to study the performance of the method in different countries. In order to fully understand under what conditions the Crosswise Model works and to further develop the technique, it indispensable to address these issues.
[1] Note that Cannell, Oksenberg, and Coverse (1981) were one of the first scholars to theorize and link socially undesirable behaviour to under-reporting and socially desriable behaviour to over-reporting of attitudes providing the basic idea of the so-called „more is better“ assumption in randomize response techniques (see Umesh, & Peterson, 1991, for a critical review).
[2] We would like to report the prevalence of negative attitudes towards Muslims anyway. Both measures estimate almost identical proportions of negative attitudes towards Muslims (DQ: 59.8%, SE=1.4, n=1205; CM: 60.2%, SE=2.9, n=1205).
References
- Abronson, E., Wilson, T. D., & Brewer, M. B. (1998). Experimentation in Social Psychology. In Gilbert, D. T., Fiske, S. T., & Garnder, L. (eds.) The Handbook of Social Psychology (pp. 99–142). Oxford: Oxford University Press.
- Aichholzer, J., & Zeglovits, E. (2015). Balancierte Kurzskala autoritärer Einstellungen (B-RWA-6). In Danner, D., & Glöckner Rist, A. (eds.) Zusammenstellung sozialwissenschaftlicher Items und Skalen (10.6102/zis239). Mannheim: GESIS.
- Baker, R., Brick, J. M., Bates, N. A., Battaglia, M., Couper, M. P., Dever, J. A., Gile, K. J., Tourangeau, R. (2013). Summary Report of the AAPOR Task Force on Non-Probability Sampling. Journal of Survey Statistics and Methodology, 1(2): 90–143.
- Beyer, H., & Krumpal, I. (2010). „Aber es gibt keine Antisemiten mehr“: Eine experimentelle Studie zur Kommunikationslatenz antisemitischer Einstellungen. KZfSS Kölner Zeitschrift für Soziologie und Sozialpsychologie, 62(4): 681–705.
- Bradburn, N. M., & Sudman, S. (1979). Imropving Interview Method and Questionnaire Design: Response Effects to Threatening Questions in Survey Research. San Franscico, CA: Jossey-Bass.
- Boruch, R. F. (1971). Assuring Confidentiality of Responses in Social Research: A Note on Strategies. The American Sociologist, 6(4): 308–311.
- Cannell, C. F., Oksenberg, L., & Converse, J. M. (1977). Striving for Response Accuracy: Experiments in New Interviewing Techniques. Journal of Marketing Research, 14(3): 306–315.
- Cannell, C. F., Miller, P. V., & Oksenberg, L. (1981). Research on Interviewing Techniques. Sociological Methodology, 12: 389–437.
- Cook, S. W., & Selltiz, C. (1964). A Multiple-Indicator Approach to Attitude Measurement. Psychological Bulletin, 62(1): 36–55.
- Chaudhuri, A. (2016). Randomized response and indirect questioning techniques in surveys. Boca Raton, FL: CRC Press.
- Coutts, E., Jann, B., Krumpal, I., & Näher, A. (2011). Plagiarism in Student Papers: Prevalence Estimates Using Special Techniques for Sensitive Questions. Jahrbücher für Nationalökonomie und Statistik/Journal of Economics and Statistics, 231(5–6): 749–760.
- Daniel, W. W. (1993). Collecting Sensitive Data by Randomized Response: An Annotated Bibiolgraphy. Atlanta, GA: Georgia State University Business Press.
- Fox, J. A. (2015). Randomized Response and Related Methods: Surveying Sensitive Data. Sage: London.
- Gingerich, D. W. (2014). When to Protect? Using the Crosswise Model to Integrate Protected and Direct Responses in Surveys of Sensistive Behavior. Inter-American Development Bank. Online: https://publications.iadb.org/handle/11319/6719 (last accessed 22 March 2017).
- Goffman, E. (1959). The Presentation of Self in Everyday Life. New York, NY: Doubleday.
- Greenberg, B. G., Abul-Ela, A. A., Simmons, W. R., & Horvitz, D. G. (1969). The Unrelated Question Randomized Response Model: Theoretical Frame-work. Journal of the American Statistical Association, 64(326): 520–539.
- Hainmueller, J., & Hopkins, D. J. (2014). Public Attitudes toward Immigration. Annual Review of Political Science, 17(3): 225–249.
- Hainmueller, J., & Hopkins, D. J. (2015). The Hidden American Immigration Consensus: A Conjoint Analysis of Attitudes toward Immigrants. American Journal of Political Science, 59(3): 529–548.
- Hoffmann, A., Diedenhofen, B., Verschuere, B., and Musch, J. (2015). A strong validation of the crosswise model using experimentally-induced cheating behavior. Experimental Psychology, 62(6):403–414.
- Hoffmann, A. and Musch, J. (2016). Assessing the validity of two indirect questioning techniques: A stochastic lie detector versus the crosswise model. Behavior Research Methods, 48:1032–1046.
- Hogg, M. A. (2006). Social Identity Theory. In Burke, P. J. (ed.) Contemporary Social Psychological Theories (pp.111–136). Stanford: Stanford University Press.
- Höglinger, M., Jann, B., & Diekmann, D. (2014). Sensitive Questions in Online Surveys: An Experimental Evaluation of the Randomized Response Technique and the Crosswise Model. Social Science Working Paper 9. Online: ftp://ftp.repec.org/opt/ReDIF/RePEc/bss/files/wp9/hoeglinger-jann-diekmann-2014.pdf (last accessed: 22 March 2017).
- Höglinger, M., & Jann, B. (2016). More Is Not Always Better: An Experimental Individual-Level Validation of the Randomized Response Technique and the Crosswise Model. Social Science Working Paper 18. Online: http://boris.unibe.ch/81526/1/Hoeglinger-Jann-2016-MTurk.pdf (last accessed: 22 March 2017).
- Höglinger, M., & Diekmann, A. (2017). Uncovering a Blind Spot in Sensitive Question Research: False Positives Undermine the Crosswise-Model RRT. Political Analysis, 25(1): 131–137.
- Horvitz, D. G., Simmons, W. R., & Shah, B. V. (1968). Unrelated Question Randomized Response Model. Journal of the American Statistical Association, 63(322): 754–754).
- Jackman, M. R. (1973). Education and Prejudice or Education and Response-Set? American Sociological Review, 38(3): 327–339.
- Jann, B., Jerke, J., & Krumpal, I. (2012). Asking Sensitive Questions Using the Crosswise Model: An Experimental Survey Measuring Plagiarism. Public Opinion Quarterly, 76(1): 32–49.
- Janus, A. L. (2010). The Influence of Social Desirability Pressures on Expressed Immigration Attitudes*. Social Science Quarterly, 91(4): 928–946.
- Khan, M., & Ecklund, K. (2012). Attitudes towards Muslim Americans Post-9/11. Journal of Muslim Mental Health, 7(1): 1–6.
- Knapp, H., & Kirk, S. A. (2003). Using Pencil and Paper, Internet and Touch-Tone Phones for Self-Administered Surveys: Does Methodology Matter? Computers in Human Behavior, 19(1):117–34.
- Knoll, B. R. (2013). Assessing the Effect of Social Desirability on Nativism Attitude Responses. Social Science Research, 42(6): 1587–1598.
- Korndörfer, M., Krumpal, I. & Schmukle, S. C. (2014). Measuring and Explaining Tax Evasion: Improving Self-Reports Using the Crosswise Model. Journal of Economic Psychology , 45: 18–32.
- Kreuter, F., Presser, S., & Tourangeau, R. (2008). Social Desirability Bias in CATI, IVR, and Web Surveys. The Effects of Mode and Question Sensitivity. Public Opinion Quarterly, 72(5): 847—865.
- Kritzinger, S., Johann, D., Thomas, K., Glantschnigg, C., Aichholzer, J., Glinitzer, K., Gründl, J., Oberluggauer, P., & Wagner, M. (2016a). AUTNES Online Panel Study. GESIS Data Archive, Cologne. ZA6594 Data file Version 1.0.0, doi:10.4232/1.12647
- Kritzinger, S., Johann, D., Thomas, K., Glantschnigg, C., Aichholzer, J., Glinitzer, K., Gründl, J., Oberluggauer, P., & Wagner, M. (2016b). AUTNES Online Panel Study: Documentation. Vienna: University of Vienna.
- Krumpal, I. (2012). Estimating the Prevalence of Xenophobia and Anti-Semitism in Germany: A Comparison of Randomized Response and Direct Questioning. Social Science Research, 41(6): 1387–1403.
- Krumpal, I., Jann, B., Auspurg, K., & von Hermanni, H. (2015). Asking Sensitive Questions: A Critical Account of the Randomized Response Technique and Related Methods. In Engel, U., Jann, B., Lynn, P., Scherpenzeel, A., & Sturgis, P (eds.) Improving Survey Methods: Lessons from Recent Research (pp.122–136). New York: Routledge.
- Kuk, A. Y. (1990). Asking Sensitive Questions Indirectly. Biometrika, 77(2): 436–438.
- Kuklinski, J. H., Cobb, M. D., & Gilens, M. (1997). Racial Attitudes and the “New South”. The Journal of Politics, 59(2): 323–349.
- Kundt, T. C. (2014). Applying ‘Benford’s Law’ to the Crosswise Model: Findings from an Online Survey on Tax Evasion. Working Paper Series 148. Online: http://papers.ssrn.com/sol3/papers.cfm?abstract_id=2487069 (last accessed: 22 March 2017).
- Lensvelt-Mulders, G. J. L. M., Hox, J. J., van der Heijden, P. G. M., & Maas, C. J. M. (2005). Meta-Analysis of Randomized Response Research: Thirty-Five Years of Validation. Sociological Methods & Research, 33(3): 319–348.
- Locander, W., Sudman, S., & Bradburn, N. (1976). An Investigation of Interview Method, Threat and Response Distortion. Journal of the American Statistical Association, 71(354): 269–275.
- McConahay, J. B., & Hough, J. C. (1976). Symbolic Racism. Journal of Social Issues, 32(2): 23–45.
- Nakhaee, M. R., Pakravan, F., & Nakhaee, N. (2013). Prevalence of Use of Anabolic Steroids by Bodybuilders Using Three Methods in a City of Iran. Addiction & Health, 5(3–4): 77–82.
- Nederhof, A. J. (1985). Methods of Coping with Social Desirability Bias: A Review. European Journal of Social Psychology, 15(3): 263–280.
- Ostapczuk, M., Musch, J. & Moshagen, M. (2009). A Randomized-Response Investigation of the Education Effect in Attitudes towards Foreigners. European Journal of Social Psychology, 39(6): 920–931.
- Parry, H. J., & Crossley, H. M. (1950). Validity of Responses to Survey Questions. Public Opinion Quarterly, 14(1): 61–80.
- Phillips, D. L., & Clancy, K. J. (1972). Some Effects of “Social Desirability” in Survey Studies. American Journal of Sociology, 77(5): 921–940.
- Rowatt, W. C., Franklin, L. M., & Cotton, M. (2005). Patterns and Personality Correlates of Implicit and Explicit Attitudes Toward Christians and Muslims. Journal for the Scientific Study of Religion, 44(1): 29–43.
- Schnell, R., Thomas, K., & Noack, M. (2017). Education Effects in Estimates of Undeclared Employment in Private Households Based on the Crosswise Model. Unpublished Manuscript.
- Sears, D. O. (1988). Symbolic Racism. In Katz, P. A., & Taylor, D. A. (eds.) Eliminating Racism. Profiles in Controversy (pp. 53–84). Philadelphia: Springer.
- Shamsipour, M., Yunesian, M., Fotouhi, A., Jann, B., Rahimi-Movaghar, A., Asghari, F., & Asghar Akhlaghi, A. (2014). Estimating the Prevalence of Illicit Drug Use Among Students Using the Crosswise Model. Substance Use & Misuse, 49(10): 1303–1310.
- Tajfel, H. (1979). Individuals and Groups in Social Psychology. British Journal of Social and Clinical Psychology, 18(2):183–190.
- Thomas, K., Johann, D., Kritzinger, S., Plescia, C., & Zeglovits, E. (2017). Estimating Sensitive Behavior: The ICT and High Incidence Electoral Behavior. International Journal of Public Opinion Research, 29(1): 157–171.
- Ulrich, R., Schröter, H., Striegel, H., & Simon, P. (2012). Asking Sensitive Questions: A Statistical Power Analysis of Rrandomized Response Models. Psychological Method,s 17(4):623–641.
- Umesh, U. N., & Peterson, R. A. (1991). A Critical Evaluation of the Randomized Response Method: Applications, Validation, and Research Agenda. Sociological Methods & Research, 20(1): 104–138.
- Vakilian, K., Mousavi, S., & Keramat, A. (2014). Estimation of Sexual Behavior in the 18-to-24-Years-old Iranian Youth based on a Crosswise Model Study. BMC Research Notes, 7(1): 1–4.
- Vakilian, K., Abbas Mousavi, S., Keramat, A., and Chaman, R. (2016). Knowledge, attitude, self-efficacy and estimation of frequency of condom use among iranian students based on a crosswise model. International Journal of Adolescent Medicine andHealth, 10.1515/ijamh-2016-0010:1–4.
- Vehovar, V., Toepoel, V., & Steinmetz, S. (2016). Non-probability Sampling. In Wolf, C., Joyce, D., Smith, T. W., & Fu, Y. (eds.) Sage Handbook of Survey Methodology (pp. 329–345). London: Sage.
- Velasco González, K., Verkuyten, M., Weesie, J., & Poppe, E. (2008). Prejudice towards Muslims in the Netherlands: Testing Integrated Threat Theory. British Journal of Social Psychology, 47(4): 667–685.
- Wagner, U., & Zick, A. (1995). The Relation of Formal Education to Ethnic Prejudice: Its Reliability, Validity and Explanation. European Journal of Social Psychology, 25(1): 41–56.
- Warner, S. L. (1965). Randomized Response: A Survey Technique for Eliminating Evasive Answer Bias. Journal of the American Statistical Association, 60(309): 63–69.
- Wolter, F., & Laier, B. (2014). The Effectiveness of the Item Count Technique in Eliciting Valid Answers to Sensitive Questions: An Evaluation in the Context of Self-Reported Delinquency.” Survey Research Methods, 8(3): 153–168.
- Yu, J., Tian, G., & Tang, M. (2008). Two New Models for Survey Sampling with Sensitive Characteristic: Design and Analysis. Metrika, 67(3): 251–263.
-
Keywords
calibration CATI coverage coverage bias cross-national surveys data linkage data quality European Social Survey experiment face-to-face face-to-face survey Facebook hard to reach populations incentives item nonresponse measurement measurement error mixed-mode surveys multitasking non-probability samples Nonresponse nonresponse bias nonresponse rates paradata PIAAC Probability sample probability samples QR codes rare populations response rate Satisficing social desirability Social media survey survey-taking climate survey data survey management survey methods Telephone survey telephone surveys total survey error unit nonresponse validity web survey Web surveys weighting
