

Evaluation of Gaining Cooperation Methods for IVR Surveys in Low- and Middle-income Countries
Amaya A., Lau C., Owusu-Amoah Y. & Light J. (2018). Evaluation of Gaining Cooperation Methods for IVR Surveys in Low- and Middle-income Countries. Survey Methods: Insights from the Field. Retrieved from https://surveyinsights.org/?p=10051
© the authors 2018. This work is licensed under a Creative Commons Attribution 4.0 International License (CC BY 4.0) 
Abstract
Interactive voice response (IVR) is gaining popularity as a data collection method for survey research. In low- and middle-income countries, IVR is used as a primary data collection mode. The system places an out-bound dial; when the individual answers, he/she hears a recorded greeting and invitation to begin the survey. This approach has the benefit of reducing labor costs, but without an interviewer, there is no one to help gain cooperation, answer questions, or identify the appropriate language in which to continue, resulting in low production outcome rates (e.g., cooperation rate, response rate). In this paper, we use experiments embedded in four studies in three countries (Ghana, Malawi, and Nigeria) to test how three design choices affect production and representativeness in IVR surveys in low- and middle-income countries. Specifically, (1) should we send an SMS (i.e., text message) prior to the first IVR contact? (2) Where should we place the language selector within the introduction? (3) Should we notify the individual that they are listening to a recording during the introduction? While some of these design choices resulted in different production outcome rates at different points in the survey, there was no clear effect on overall yields nor on the representativeness of the sample.
Keywords
data collection methods, gaining cooperation, Interactive voice response (IVR), short message service (SMS)
Copyright
© the authors 2018. This work is licensed under a Creative Commons Attribution 4.0 International License (CC BY 4.0)
Introduction and Background
Interactive voice response (IVR) is a telephone-based technology that uses prerecorded questions instead of human interaction. Users hear the question then speak or press a key to record their response. While IVR has been around since the 1970s, it did not gain momentum until the early 2000s. The use of IVR is now wide-spread and used for both in-bound and out-bound dialing, customer service, election polls, and survey research (Wikipedia 2018; Nuance 2015; Roos 2008).
In high-income countries, survey researchers generally use IVR to minimize interviewer effects on sensitive questions. It often supplements computer-assisted telephone interviewing (CATI). An interviewer dials a case, gains cooperation, and administers a portion of the interview before transferring the respondent to IVR to collect data on sensitive topics such as drug use or sexual behavior. (For more details on methods and examples, see Couper, Singer, & Tourangeau 2004). Because the interviewer initiates the call, IVR-specific procedures for gaining cooperation have not been the focus of research in these countries. Instead, researchers have been intent to study measurement error, finding that respondents feel more comfortable reporting sensitive or socially undesirable information to a recording than an interviewer (Tourangeau, Rips, & Rasinski 2000; Tourangeau & Yan 2007). Similarly, Kreuter, Presser, and Tourangeau (2008) conducted a survey with university alumni about their college experience (e.g., grades, being on the honor role). Alumni were randomly assigned to IVR, web, or CATI. The researchers found that responses gathered via IVR were less accurate than those collected via web, but more accurate than CATI. (For additional examples, see: AAPOR 2008 and Elliott et al. 2009). Even when assessing IVR surveys through the lens of nonresponse, researchers have focused on comparisons of response rates across modes (e.g., Bason 2000) or how to minimize breakoffs within the survey using different recorded voices (e.g., Couper et al 2004).
While the above findings are valuable in their own right, they did not address the largest barrier to successful IVR implementation in low- and middle-income countries (LMICs) [1] : gaining cooperation. In LMICs, IVR is emerging as a stand-alone mode, as opposed to a supplemental mode. The system places an out-bound dial; an interviewer is not involved. When an individual answers, he or she hears a recorded greeting and invitation to begin the survey. This approach has the benefit of reducing labor costs, but without an interviewer, there is no one to help build rapport, answer questions, or gain cooperation, and outcome rates (e.g., cooperation rate, response rate) fall. In a feasibility study, Leo and colleagues (Leo, Morello, Mellon, Peixoto, & Davenport 2015) conducted an IVR survey in four LMICs (Afghanistan, Ethiopia, Mozambique, and Zimbabwe). Only 15-31% of telephone numbers dialed resulted in a connect. Among individuals who answered the phone, 8-31% selected a language in which to continue, and only 23-50% of those individuals completed the survey. In another study, Lau and colleagues (Lau, Cronberg, Marks, & Amaya working paper) achieved a 2.89% response rate (AAPOR RR3).
Previous research in the United States suggests that prenotification letters increase response rates (Groves & Couper 1998). Unfortunately, this literature is premised on the ability to mail an advance letter to a household prior to data collection. IVR surveys in LMICs do not have this luxury. Mailing addresses are unavailable because it is rarely possible to match telephone numbers to mailing addresses. Even if addresses are available, mailing an advance letter may be cost prohibitive, mail delivery may be unreliable, and residential delivery in rural areas is often not available (Kenny 2005).
Sending an SMS prenotification message may be an effective alternative to improve IVR response rates. While one study in the United States found that an SMS prenotification did not significantly increase the response rates to a telephone survey (Steeh & Piekarski 2008), another found that SMS prenotification messages significantly increased participation to a web panel compared to email prenotifications (Bosnjak, Neubarth, Couper, Bandilla, & Kaczmirek 2008). For an SMS to be effective, it must accomplish the same things as a traditional prenotification letter. Prenotification letters increase response by legitimizing the caller. For example, they may be printed on official letterhead. They also provide a variety of reasons for sampled members to participate, catering to various groups. Finally, they frequently offer a website or toll-free line that individuals may visit or call to ask questions and learn more about the survey. SMS are limited to 140-160 characters (depending on language and country) and cannot fit as much information in them as a letter. If the SMS cannot enhance the sense of legitimacy, they may not be effective at improving the response rate.
Language further complicates IVR procedures in countries where residents do not have a common language, and surveys must be offered in multiple languages. In mail and web surveys, the instructions can be written in multiple languages on the same screen. In telephone surveys, an interviewer can hear the individual’s greeting (e.g., ‘Hello’ or ‘Bonjour’) and respond in the appropriate language. In IVR, these solutions are not feasible as systems (at least, moderately priced IVR systems) cannot detect the required language without user input. Instead, the survey introduction is recorded in the most common language (e.g., English in Ghana or French in Senegal) and includes a language selector (e.g., Press 1 for English. Appuyez sur 2 pour le français.). The remainder of the survey is then conducted in the selected language.
To date, optimal placement of the language selector in the introductory script has not been determined. The introduction must both build rapport and request that the individual choose a language. If the language selector is placed too early, individuals will likely hang up because it seems like a sales pitch or may be perceived as violating greeting norms (Pan 2008). Multilingual individuals’ language choice may also depend on the topic. Placing the language selector before informing the individual of the nature of the call may leave the individual without enough information to choose the optimal language. However, non-English speakers will not understand the purpose of the call if it is provided before the language selector.
Finally, individuals in LMICs may also experience challenges when using IVR because they are less familiar with the technology. The 2014-2015 Afrobarometer reports nearly half (47.8%) of all respondents had no more than a primary education and over two-thirds (67.3%) never use the internet. More specifically, researchers have found that many individuals in LMICs have never encountered IVR technology and did not understand the concept of a recorded message or how to interact with the system (Daftary, Hirsch-Moverman, Kassie, Melaku, Gadisa, Saito, & Howard 2016; Broyera, Froumentin, Grewal, & Alonso 2012; Grover, Stewart, & Lubensky 2009).
Qualitative research has suggested that some individuals unfamiliar with IVR believe they are speaking to a live person and may talk over the recording, missing the instructions on how to continue (i.e., Press 1 to continue) (Lerer, Ward, & Amarasighe 2010). Without a means to move forward, the individual then hangs up and becomes a nonrespondent. Adding a beep and recording notification to the introduction may capture the individual’s attention and reduce the potential of missing instructions and important information. Listening to the instructions would improve the user’s ability to interact with the system, reducing frustration and improving cooperation.
However, the inclusion of a beep and recording notification may also have unintended consequences. It may prompt people to hang up if they are uncomfortable talking with a computer. The beep and notification may create a level of formality, may be construed as impersonal, and violate the norms of conversation – namely Grice’s (1975) cooperative principle that both participants should be responsive and make useful contributions to the conversation. If the individual asks a question, the recording cannot respond, violating the principle. Previous research suggests higher user satisfaction when IVR is less formal and more conversational (Nuance 2015).
The purpose of this paper is to contribute to the literature on best practices for gaining cooperation for out-bound IVR surveys in LMICs. Given the above-mentioned challenges, we evaluated three design options on their effectiveness to improve outcome rates and produce a representative sample:
- Should we send an SMS (i.e., text message) prior to the first IVR contact?
- Where should we place the language selector within the introduction?
- Should we notify the individuals that they are listening to a recording during the introduction?
Methods
We used data from four IVR surveys conducted between 2015 and 2017 by VOTO Mobile, a data collection firm that specializes in IVR surveys in Africa. In three surveys, we conducted experiments to test the effect of sending an SMS prenotification message. In the last survey, we varied the introduction and tested the effect of notifying the individual that he or she was listening to a recording as well as the effect of the language selector placement.
Studies 1-3: SMS Prenotification Experiments
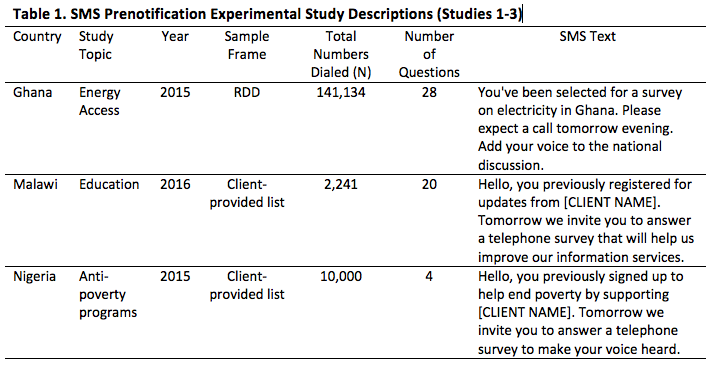
In 2015 and 2016, VOTO conducted three experimental studies in LMICs (Ghana – upper middle income, Malawi – lower middle income, Nigeria – upper middle income) on the use of SMS as a prenotification tool for IVR surveys. In each of the three studies, approximately half of the sample was randomly assigned to receive an SMS message one day prior to receiving the IVR call, while the other half did not receive any advance notification. For example, in Nigeria, 5,000 telephone numbers were assigned to receive an SMS in advance of a telephone call, and 5,000 numbers received nothing in advance of being dialed. The message varied by survey as did other features such as country, sample frame and size, and survey length (Table 1). All messages were sent in English. All three surveys received a maximum of two dials prior to being coded as a noncontact and finalized.
To assess the effectiveness of a prenotification SMS, we compared the experimental and control groups for each country on three rates: contact rate, completion rate, and an overall yield rate. These rates were defined as follows:
Contact rate = All connected phone numbers / Total sample
Completion rate = All completed interviews / All connected phone numbers
Yield rate = All completed interviews / Total sample
Because RTI International did not sponsor these studies, we did have access to any additional frame information or metadata with which to calculate alternative rates. Despite this limitation, these rates, as calculated, can offer significant insight into the effectiveness of a prenotification SMS. The contact rate assesses whether or not the SMS increases the number of individuals who pick up the telephone, the first barrier to response. If individuals do not answer, additional gaining cooperation tools cannot be employed. The completion rate assesses whether the SMS has any effect on retaining individuals throughout the interview, and the yield rate is a crude measure of sample efficiency and, often, cost.
We also did not have access to any questionnaire data, so we could not assess representativeness.
All analyses were unweighted using two-sample, two-tailed t-tests.
Study 4: Introduction Experiments
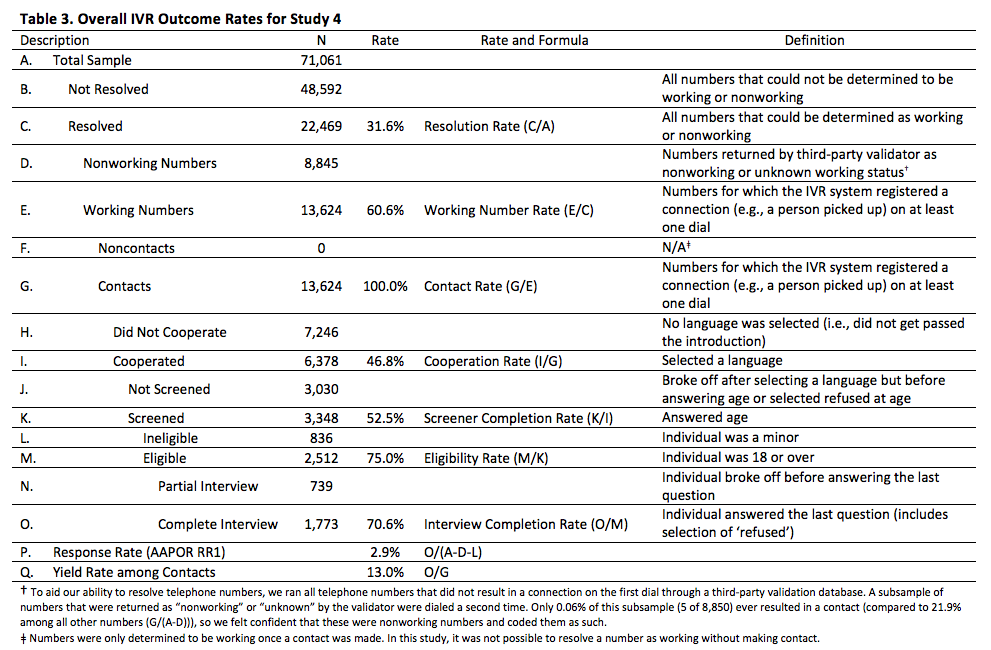
In 2017, RTI International sponsored an IVR survey about technology among mobile phone users in Ghana age 18 and over. VOTO Mobile used a random digit dial (RDD) sample of 71,061 Ghanaian mobile phone numbers to collect a total of 1,773 completed interviews. Mobile phone numbers in Ghana take the form 233-YY-XXX-XXXX where 233 is the country code, YY is the mobile network operator code (e.g., all Vodafone telephone numbers begin with 20 or 50), and the remaining numbers are unique to the individual. Within all network operator codes, VOTO Mobile randomly generated the last seven digits and dialed the number up to four times during various times of the day and with one or two days between dials. All dialing and data collection was automated: a case was dialed and the recorded introduction would start if a connection was made. The survey was offered in a total of five languages: English, Twi, Ewe, Dagbani, and Hausa. While many other languages are spoken across Ghana, nearly all Ghanaians understand one of these five languages either because they speak one of them or because they speak a similar language that is mutually intelligible. All respondents were offered a promised incentive of 2.00 GHS (equivalent to $0.50 US) upon completion of the survey. The incentive was applied as a mobile phone credit (often referred to as a “top up”).
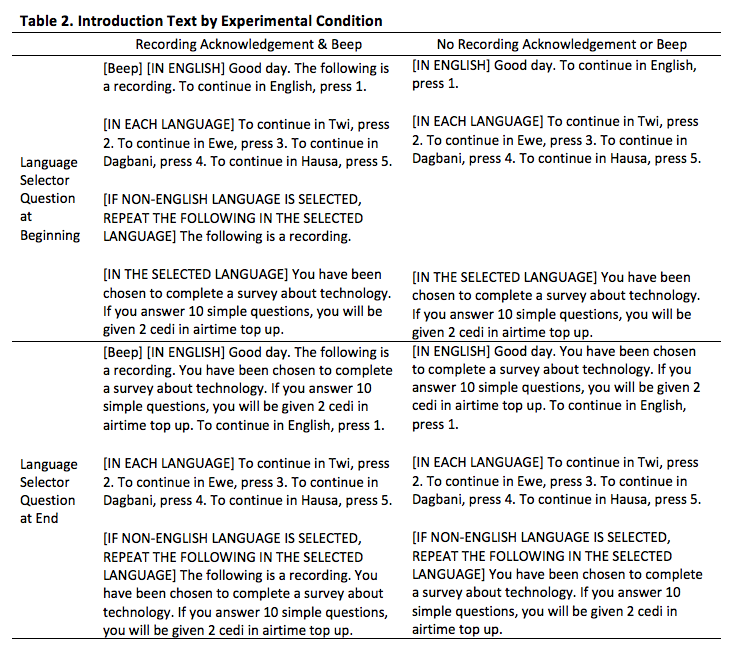
The survey began with an introduction in English (including a language selector), followed by informed consent, a screening question on age to ensure we did not interview minors, and 10 questions on technology and individual demographics. All information and questions posed after the language selector were in the language selected by the respondent. Once the respondent selected a language, he or she could not change the language of administration. We embedded a 2×2 experiment in the survey introduction with the goal of increasing outcome rates without negatively affecting the representativeness of the sample. The first experiment component aimed to determine if we should notify potential respondents that they are listening to a recording while the second component tested different placements for the language selector.
Half of the sample was randomly assigned to hear a brief beep and be informed that they were listening to a recording. The other half received neither the beep nor the recording notification (Table 2). Independently, a random half of the sample was asked to select an interview language prior to hearing the rest of the introduction. The other half was asked to select an interview language after hearing the rest of the introduction. If the individual chose to continue in a language other than English, all information read prior to language selection was repeated. While English is the official language in Ghana, only 67.1% of the population can read and write in English (Ghana Statistical Service 2012). [2]
We conducted two sets of analyses – one set of analyses to assess the effect of the experiments on productivity and one to assess the effect on representativeness. First, five outcome measures were used to measure productivity: cooperation rate, screener completion rate, eligibility rate, interview completion rate, and the yield rate among contacted individuals.[3] Case counts, categories, and equations for calculating each rate can be found in Table 3. Where relevant, these are consistent with AAPOR guidelines (AAPOR 2016). The rates not found in AAPOR guidelines are constructed in a similar manner as rate calculations found in the National Immunization Survey, one of the largest telephone surveys in the United States (Wolter, Smith, & Khare 2017), and by Leo and his colleagues (Leo, Morello, Mellon, Peixoto, & Davenport 2015) in their IVR feasibility study in four LMICs. Individuals were considered cooperative if they selected a language.
After selecting a language, the consent text was read, and individuals were asked to report their age. Anyone who answered the age question was considered to have completed the screener, and all those who reported being 18 years of age or older were eligible. All individuals who answered the last question (even if it was to refuse) in the survey were considered complete. Note that these rate calculations are different from those used to evaluate the SMS prenotification experiments in the first three studies. More data were available for this study than in Studies 1-3, so more granular metrics could be calculated.
In the second set of analyses, we tested whether the experimental conditions resulted in the recruitment of different types of respondents. We hypothesized that the placement of the language selector would affect the proportion of recruited English speakers, with the later placement increasing the proportion of English speakers. We also expected the presence of the recording notification to increase the proportion of individuals who were not technologically savvy. English speakers were measured in two ways: (1) the percent of interviews conducted in English and (2) the percent of respondents who understood English. Individuals were considered to understand English if they were taking the survey in English, if they reported usually speaking English at home, or if they reported speaking English ‘well’ or ‘very well’. Tech savvy was evaluated using four proxy indicators: (1) level of education, (2) frequency with which the respondent sends SMS, (3) whether the respondent uses a smart phone, and (4) how confident he or she is with new technology. For thoroughness, we also tested whether the experimental conditions had differential effects on the recruitment of men and women and of different age groups . For exact question wording, please see Appendix A.
Logistic regression models were used to test the main and interaction effects of the experiment on each outcome variable. The dependent variable was the variable of interest (e.g., cooperation rate) and the independent variables were dummy variables representing the experimental conditions and their interaction. All analyses are unweighted. The main effects refer to the effect of each component of the experiment, independent of the other component while the interaction effects identify whether there is a significant relationship between language selector placement and acknowledgement that the individual was listening to a recording.
Results and Discussion
Studies 1-3: SMS Prenotification Experiments
Table 4 displays the effects of the SMS prenotification on three outcome rates (contact, completion, and overall yield) for three countries. While sending an SMS reduced the contact rate and improved the completion rate for all three studies, only two of the six comparisons reached statistical significance. Nigerians who were sent an SMS were significantly less likely to answer the phone (16.7% vs. 23.5%, respectively) while only the Ghana study yielded significant differences in the completion rate (11.2% vs. 9.6% for the experimental and control groups, respectively). The SMS effect of reducing the contact rate and improving the completion rate produced mixed results for the overall yield rate. The Ghana sample that received an SMS was significantly more productive (1.8% vs. 1.5%) while the differences in Malawi and Nigeria trended in opposite directions but neither reached significance. While a 0.3 percentage point difference may often be practically ignored in other contexts, it deserves attention here. Given the low overall yield, a small change can have large implications. In the case of Ghana, the effect of sending a prenotification SMS increased the number of completed interviews by 20% compared to the control group (1,250 vs. 1,089 completed interviews, respectively). Similar differences in the final completion rates may be seen in Malawi and Nigeria, but these comparisons failed to reach significance given the smaller sample sizes.
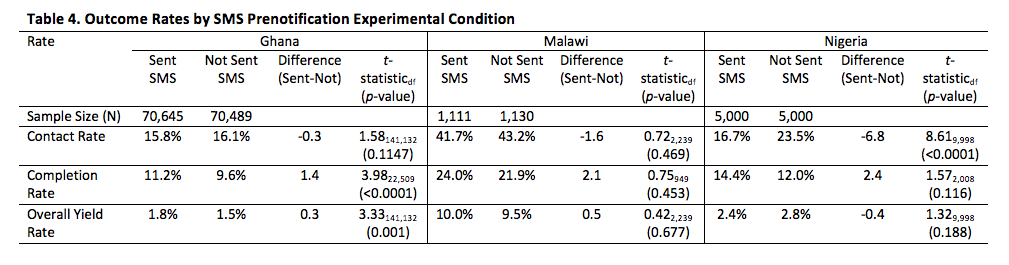
The variation in the effectiveness of the prenotification SMS may also be the result of country- or survey-specific differences. The surveys were conducted in different countries, using different frames, on different topics, at different points in times, and varied in length. For example, the Malawi and Nigeria sample was client-provided, as opposed to the RDD sample used in Ghana. While we do not have evidence to support this, it is possible that individuals sampled from a client-provided list may recognize the client’s number when they are called and may not need a prenotification SMS to build legitimacy and rapport. Despite the large differences in design across countries, the general trend of lower contact rates among all three studies is troublesome. Given the limited number of surveys and the limited information about each survey, we could not conduct a meta-analysis or otherwise control for differences across surveys to identify interactions between the SMS prenotification and other factors nor could we conduct a further investigation into the reason that the SMS may reduce contact rates. We hypothesize that an SMS prenotification may not have sufficient space to establish credibility and answer questions. As a result, SMS prenotifications may be ineffective, or potentially harmful to outcome rates.
An alternative explanation may be related to the number of dials placed. No number in any study received more than two dials. Individuals may have been busy, the time of the dials may not have been optimized, or phones may have been turned off or out of range. This is all conjecture and additional research is necessary to test these hypotheses.
Study 4: Introduction Experiments
A total of 13,624 individuals were contacted in Study 4. The first set of columns in Table 5 displays the main effects of recording acknowledgement on outcome rates. Notifying individuals of the recorded message increased the cooperation rate – i.e., the proportion of contacted individuals who chose a language by which to continue (48.1% vs. 45.6%, respectively), but this increase was offset by a lower screener completion rate among the notified individuals (50.3% vs. 54.8%, respectively).
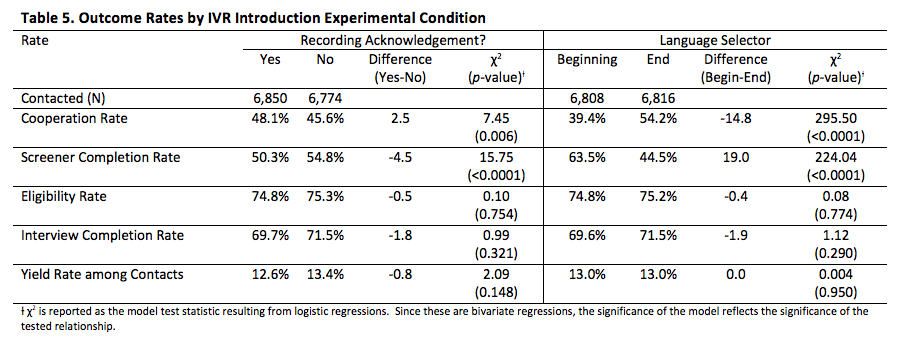
We hypothesized two explanations for this phenomenon, but neither could be tested given the available data. Less educated or tech savvy individuals may benefit from the recording acknowledgement, do not try to talk over the instructions for language selection, and are labeled as cooperative when they select their preferred language. After selecting a language, they are read the informed consent in which we inform them that their participation is voluntary and that we will ask questions about how they use technology. This is slightly more information than the introduction that just says the survey is about technology. The gain in the number of less tech savvy individuals that was made from hearing the recording acknowledgement may be lost if they are disproportionately less interested in answering questions about their own use and may drop off. This hypothesis is consistent with the topic saliency hypothesis that suggests individuals for whom the survey topic is uninteresting or irrelevant will participate at a lower rate than others (Groves, Presser, & Dipko 2004).
Similarly, if the recording acknowledgement attracted individuals who were less educated or tech savvy, it may have also recruited individuals who were less familiar with IVR. While the introduction may have provided them the information necessary to progress through the survey (i.e., listen to the response options then type one into the key pad), individuals who were unfamiliar with IVR may have expected that they would be transferred to a live interviewer once the individual selected a language. When this did not occur, these newly recruited individuals may have dropped off at a disproportionate rate.
A cancelation effect also occurred in the language selector experiment, shown in the last set of columns in Table 5. When asked to choose a language at the end of the introduction as opposed to the beginning, significantly more people chose a language and agreed to participate in the survey (54.2% vs. 39.4%, respectively). However, these same individuals were significantly less likely to answer the age question in order to complete the screener (44.5% vs. 63.5%), ultimately resulting in no significant differences in yield (13.0% for both groups).
We considered two possible explanations for these conflicting results in the language selector experiment and conducted some additional analyses (not shown). We first hypothesized that individuals who did not speak English did not understood the purpose of the call when this information was placed before the language selector. They may have selected a language just to hear more information about the call. Once they heard the nature of the call, they decided not to participate and hung up. If this hypothesis were true, we may have expected a higher proportion of individuals wishing to continue in a language other than English when the language selector was placed at the end of the introduction as opposed to the beginning. We did not find support for this hypothesis in the data; we found the opposite effect. When the language selector was placed at the beginning of the introduction, 47.2% opted to continue in English while the number increased to 65.7% when the language selector was at the end of the introduction (p<0.0001).
Alternatively, we considered the time lag between the language selector and the age question. The different experimental conditions had different amounts of information read to individuals between the point where they selected a language and the time they provided their age. The lag between responses also varied by language selected with English requiring the least amount of time and Ewe requiring the most. Overall, the lag ranged from 43.6-88.9 seconds. This included the informed consent and any relevant introductory text (see Table 2 for exact text read under each condition). We hypothesized that individuals who experienced a longer lag between answering the language selector and the age question got bored or frustrated, causing them to break off at a higher rate. While we failed to find support for this hypothesis, we could not isolate the effect of the lag from other differences that may be conflated with language selection itself (e.g., individuals who select English may be more educated).
In addition to the main effects, we also reviewed the interaction effects of the two experiments on the various rates. None were significant so the results are not displayed.
Separately from the experiments’ effects on outcome rates, we analyzed a variety of variables to determine if the experiments recruited different types of individuals. Specifically, we hypothesized that the experiments may affect the proportion of respondents who spoke English and the proportion of tech-savvy individuals. The main effects are displayed in Table 6. We found no differences in the type of respondents recruited under any of the experimental conditions. The interaction terms were also reviewed, but none were significant and for clarity are not displayed.
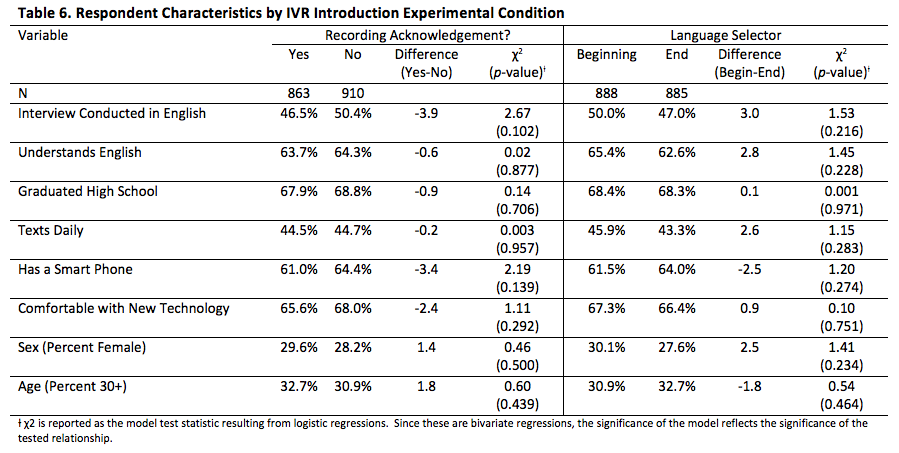
While data for most of the variables presented in Table 6 were only available for completed interviews, we had data on the interview language for all individuals who answered the language selector. While the placement of the language selector did not appear to have an effect on the proportion of individuals who completed the survey in English (p=0.216), the placement did affect the proportion of individuals who started the survey in English. 65.7% of all individuals who received the language selector at the end of the introduction and selected a response chose to continue in English compared to 47.2% in the other group (p<0.0001). This suggests that if researchers could identify how to reduce the number of breakoffs, placing the language selector after the introduction would likely result in a higher proportion interviews conducted in English and, possibly, a higher proportion of individuals who understand English. However, additional research would be necessary to confirm this hypothesis. If the hypothesis is accurate and researchers could reduce breakoffs, the overall response rate would increase, but it would likely also introduce nonresponse bias, since it would result in an overrepresentation of English speakers. English speakers typically have higher levels of education and reside in urban areas (Ghana Statistical Service 2012). To the extent that these demographics are correlated with the outcome of interest, the results would be biased.
Conclusion
There are many methods that may be used to increase response to outbound IVR surveys in LMICs. We tested three design choices – sending a prenotification SMS, changing the placement of the language selector, and notifying individuals that they were listening to a recording. While some of these experimental conditions resulted in different outcome rates at different points in the survey, there was no clear effect on the yields. Mixed findings were found in the SMS prenotification experiment, and no significant differences were identified in the yield rate among the introductory text experiment. Additional analysis on the introduction text experiment also found no significant differences in the type of individuals that were being recruited to participate.
If focusing solely on the effects of prenotification SMS on outcome rates, we would recommend that there is currently not enough evidence to recommend their use. However, other factors deserve consideration when deciding whether to use SMS as a prenotification tool. One additional factor is cost; telephone companies in many LMICs only charge for connected dials, whereas they charge for all outgoing SMS. It would likely be less expensive to make additional IVR contact attempts as a method to increase response than send an SMS. A second factor is the ability to identify nonworking numbers. When making a call to a nonworking number, our experience was that the IVR technology could not adequately distinguish between a working and nonworking number. When sending an SMS, we received bounce backs and delivery failure notifications that identified these numbers as nonworking (although, there is some error in these reports and this experience may vary by country). To the extent that researchers see value in being able to identify nonworking numbers, sending a prenotification SMS may be beneficial.
In terms of the introduction itself, we experienced higher cooperation rates when individuals were informed that they were listening to a recording and when we placed the language selector at the end of the introduction. While these gains were later lost, they are an important first step in increasing overall response rates. Only once the individual chooses a language can he or she progress through the rest of the survey. However, we caution against blindly applying these methods to all IVR surveys. The populations within LMICs are not homogenous. The number of languages spoken, proportion of individuals who speak and understand English, level of education, experience with IVR, and more could alter the effectiveness of these introduction methods.
Most importantly, more research is necessary to identify other design decisions that can increase response rates and ensure representativeness in IVR surveys. We recommend research focus on three broad areas: improving contact, improving cooperation, and reducing breakoffs. Additional research into SMS prenotification may be useful to improve contact rates among some populations. Given the brevity of the SMS, it is difficult to build legitimacy and rapport in all instances. However, SMS may be effective when a single piece of information may affect the participation decision for large portions of the population (e.g., offering an incentive or conveying that the survey is mandatory). Similarly, it may only be effective among specific types of populations (e.g., literate individuals). Turning to breakoffs, we hypothesized, but could not sufficiently test, that long lags between respondent interactions (i.e., the time between when the respondent is asked to answer one question and the next) increase break offs. We also identified that individuals who opted to continue in English were more likely to break off. It may also be fruitful to record interviews, especially the introduction. Recordings would help identify the reasons for breakoff and failure to gain cooperation. For example, we may only be connected to voicemail as opposed to an individual. Recordings would enable further investigation of the hypothesis that people are speaking over the recording. Individuals may be trying to change their language selection later in the interview or may be speaking their responses instead of using the number pad. Recordings would allow us to investigate all of these possibilities and develop more effective tools.
More research is also necessary to understand the types of people who break off and methods to prevent it. No research would be complete without assessing representativeness. While an increase in response is an end unto itself – higher response rates reduce costs and increase power, response is not necessarily correlated with bias. Methods to increase response should focus on disproportionately increasing response among underrepresented populations to minimize bias and improve overall data quality.
__________________________________________________
[1] LMICs are defined by the World Bank and frequently analyzed together. “As of 1 July 2016, low-income economies are defined as those with a GNI per capita, calculated using the World Bank Atlas method, of $1,025 or less in 2015; lower middle-income economies are those with a GNI per capita between $1,026 and $4,035; upper middle-income economies are those with a GNI per capita between $4,036 and $12,475” (World Bank Data Team 2016).
[2] Ghana does not produce official estimates on the proportion of the population who can understand spoken English. While it is likely higher than the 67.1% cited here, it is far from universal.
[3] Researchers often use response rate as an outcome measure. We excluded this comparison because the large proportion of unresolved numbers added noise to the analysis. Additionally, the experiments could not affect response until they were contacted. As such, all analysis is limited to contacted numbers. A contact is one in which the call connected on at least one dial.
Appendix A: Study 4 Questionnaire
References
- American Association for Public Opinion Research. (2008). An evaluation of the methodology of the 2008 pre-election. https://www.aapor.org/AAPOR_Main/media/MainSiteFiles/AAPOR_Rept_FINAL-Rev-4-13-09.pdf: AAPOR.
- American Association for Public Opinion Research. (2016). Standard definitions: final dispositions of case codes and outcome rates for surveys.
- Bason, J. J. (2000). Comparison of telephone, mail, web, and IVR surveys of drug and alcohol use among University of Georgia students. 55th Annual Conference of the American Association for Public Opinion Research, (pp. 1074-1080). Portland.
- Bosnjak, M., Neubarth, W., Couper, M. P., Bandilla, W., & Kaczmirek, L. (2008). Prenotification in Web-based Access Panel Surveys: The Influence of Mobile Text Messaging Versus E-mail on Response Rates and Sample Composition. Social Science Computer Review, 213-223.
- Boyera, S., Froumentin, M., Grewal, A., & Alonso, J. M. (2012). Mobile data collection in Africa. World Wide Web Foundation.
- Couper, M. P., Singer, E., & Tourangeau, R. (2004). Does voice matter? An interactive voice response (IVR) experiment. Journal of Official Statistics, 551-570.
- Daftary, A., Hirsch-Moverman, Y., Kassie, G. M., Melaku, Z., Gadisa, T., Saito, S., & Howard, A. A. (2016). A qualitative evaluation of the acceptability of an interactive voice response system to enhance adherence to isoniazid preventive therapy among people living with HIV in Ethiopia. AIDS and Behavior, 1-11.
- Elliott, M. N., Zaslavsky, A. M., Golstein, E., Lehrman, W., Hambarsoonmians, K., Beckett, M. K., & Giordano, L. (2009). Effects of survey mode, patient mix, and nonresponse on CAHPS hospital survey scores. Health Services Research, 501-518.
- Ghana Statistical Service. (2012). 2010 population & housing census: summary report of final results. Accra: Sakoa Press Limited.
- Grice, H. P. (1975). Logic and Conversation. In P. Cole, & J. Morgan, Syntax and Semantics (pp. 41-58). New York: Academic Press.
- Grover, A. S., Stewart, O., & Lubensky, D. (2009). Designing interactive voice response (IVR) interfaces: localisation for low literacy users. http://hdl.handle.net/10204/3882.
- Groves, R. M., & Couper, M. (1998). Nonresponse in Household Interview Surveys. New York: Wiley-Interscience.
- Groves, R. M., Presser, S., & Dipko, S. (2004). The Role of Topic Interest in Survey Participation Decisions. Public Opinion Quarterly, 2-31.
- Kenny, C. (2005). Reforming the posts: abandoning the monopoly-supported postal universal service obligation in developing countries. http://documents.worldbank.org/curated/en/848091468313749210/pdf/wps36270rev.pdf: World Bank.
- Kreuter, F., Presser, S., & Tourangeau, R. (2008). Social Desirability Bias in CATI, IVR, and Web Surveys: The Effects of Mode and Question Sensitivity. Public Opinion Quarterly, 847-865.
- Lau, C., Cronberg, A., Marks, L., & Amaya, A. (working paper). What is the Optimal Mobile Phone Survey Mode in Developing Countries? A Comparison of IVR, SMS, and CATI in Nigeria.
- Leo, B., Morello, R., Mellon, J., Peixoto, T., & Davenport, S. (2015). Do mobile phone surveys work in poor countries? Accessed at https://www.cgdev.org/sites/default/files/CGD-Working-Paper-398-Mobile-Phones.pdf
- Lerer, A., Ward, M., & Amarasinghe, S. (2010). Evaluation of IVR data collection UIs for untrained rural users. Proceedings of the First ACM Symposium on Computing for Development. London: ACM Press.
- Nuance Communications, Inc. (2015). An IVR that your customers will love, not loathe: four ways to create an IVR experience that meets your customers’ self-service expectations. http://newzealand.nuance.com/for-business/customer-service-solutions/conversational-ivr/Nuance_HowtoCreateIVR_WP_1215.pdf: Nuance Communications, Inc.
- Pan, Y. (2008). Cross-cultural communication norms and survey interviews. In H. Sun, & D. Z. Kadar, It’s the Dragon’s Turn: Chinese Institutional Discourses (pp. 17-76). New York: Peter Lang Publishing.
- Roos, D. (2008) How Interactive Voice Response (IVR) Works. HowStuffWorks.com. <https://electronics.howstuffworks.com/interactive-voice-response.htm>. Accessed 5 June 2018.
- Steeh, C., & Piekarski, L. (2008). Accommodating New Technologies: Mobile and VoIP Communication. In J. M. Lepkowski, C. Tucker, J. M. Brick, E. D. de Leeuw, L. Japec, P. J. Lavrakas, R. L. Sangstar, Advances in Telephone Survey Methodology (pp. 423-446). Hoboken: John Wiley & Sons, Inc.
- Tourangeau, R., & Yan, T. (2007). Sensitive questions in surveys. Psychological Bulletin, 859-883.
- Tourangeau, R., Rips, L. J., & Rasinski, K. (2000). The Psychology of Survey Response. New York: Cambridge University Press.
- Wikipedia (2018). Interactive Voice Response. https://en.wikipedia.org/wiki/Interactive_voice_response. Accessed 5 June 2018.
- Wolter, K., Smith P., Khare M., et al. Statistical methodology of the National Immunization Survey, 2005–2014. National Center for Health Statistics. Vital and Health Statistics 1(61). 2017
- World Bank Data Team (2016). New Country Classifications by Income Level. Accessed 5 June 2018: http://blogs.worldbank.org/opendata/new-country-classifications-2016.
-
Keywords
calibration CATI coverage coverage bias cross-national surveys data linkage data quality European Social Survey experiment face-to-face face-to-face survey Facebook hard to reach populations incentives item nonresponse measurement measurement error mixed-mode surveys multitasking non-probability samples Nonresponse nonresponse bias nonresponse rates paradata PIAAC Probability sample probability samples QR codes rare populations response rate Satisficing social desirability Social media survey survey-taking climate survey data survey management survey methods Telephone survey telephone surveys total survey error unit nonresponse validity web survey Web surveys weighting
