

Analysing Poor Reading Skills: A Comparison Between PIAAC Literacy Levels and Reading components
Perry A. & Gauly B. (2019). Analysing Poor Reading Skills: A Comparison Between PIAAC Literacy Levels and Reading components. Survey Methods: Insights from the Field. Retrieved from https://surveyinsights.org/?p=12603
© the authors 2019. This work is licensed under a Creative Commons Attribution 4.0 International License (CC BY 4.0) 
Abstract
The aim of this paper is to compare two measures of literacy skills used in the Programme for the International Assessment of Adult Competencies (PIAAC), i.e. literacy levels and reading components. Different from assessing literacy levels, which cover the entire range of reading skills from very high to very low, the reading components assessment is specifically designed to test the reading skills of the low literate. As literacy skills are an important determinant for labour market success, we examine whether the reading components assessment is a better predictor of employment of the test takers than the general literacy level assessment used in PIAAC. We compare different logistic regression models that include literacy levels and the reading components and use the Wald-test to compare the model fit of each examined model. In a further step we test whether the predictive validity differs between low and high literate test takers. Our results indicate that the PIAAC reading components are more useful in predicting employment of the low literate than the PIAAC literacy levels.
Keywords
Literacy measures, low-literate, PIAAC, reading components
Acknowledgement
We thank John Sabatini for valuable methodological advice. We also thank David McNeill for his support in data analysis. We are furthermore grateful for comments and suggestions received at the 2nd Annual BAGSS Conference “Inequalities” (2015) and the Conference of the Society of Empirical Educational Research (GEBF) (2016). Also, we thank two anonymous reviewers for their suggestions and comments. This work is financially supported by the German Federal Ministry of Education and Research within the Reading components Project (PIAACRC1).
Copyright
© the authors 2019. This work is licensed under a Creative Commons Attribution 4.0 International License (CC BY 4.0)
Introduction
Recent decades have been characterized by a growing interest in the role of cognitive skills for individuals and societies at large. On the macro level, skills drive the long-run prosperity of nations (Hanushek and Woessmann, 2015). On the micro level, skills provide individuals with the prerequisite to successfully participate in the labour market (Hanushek, Woessmann, Schwerdt, & Wiederhold, 2015; OECD, 2016), which is not only important for economic reasons but also associated with social participation and individual self-esteem (Solga, 2008).
The Programme for the International Assessment of Adult Competencies (PIAAC) provides internationally comparable data on the working age population’s (16-65 years) cognitive skills (OECD, 2016). In accordance with previous studies (Grotlüschen, Heinemann, Nienkemper, 2015) PIAAC shows that even in industrial nations a substantial share (17.5 %) of individuals have very low literacy skills (OECD, 2016).
To gain additional information on the reading skills of adults at the lower end of the literacy scale, the assessment of three components that are fundamental for understanding written texts were introduced in PIAAC in 2012 i.e., the reading components (print vocabulary, sentence processing, and passage comprehension, see Sabatini & Bruce, 2009). These comprise simple reading tasks on the word, sentence and passage level. With a deeper understanding of an individual’s performance in these components we can learn more about their actual reading skills. In addition, a better instrument targeted at low literate may decrease nonresponse and drop-outs when traditional literacy assessments are too complex for them to solve.
However, looking at the proficiency of PIAAC respondents who took the reading component assessment we find that the performance does not differ substantially among the test takers. A large proportion (80 % or more, depending on the component) was able to solve all or at least 90 % of the test items correctly. Because of this lacking ability to better distinguish low skilled readers, one might ask whether the assessment of the reading components actually provides information regarding the reading ability of presumably low skilled / low literate adults in addition to the PIAAC literacy assessment. Because reading skills have such fundamental impact on employability (see e.g., Osberg, 2000; Arendt, Rosholm, and Jensen, 2005; Jäckle and Himmler, 2012), we want to know whether the three reading components are better labour market participation predictors for low literate adults in Germany than the PIAAC literacy levels.
In doing so, this paper contributes to ongoing research on literacy measures. We follow the idea of Finnie and Meng (2005), who predict the likelihood of being employed by using two different literacy measures: test scores and self-assessed literacy. We complement their work by concentrating on two types of objective test scores among low literate individuals who are particularly at risk of being excluded from the labour market. We evaluate the predictive power of the two literacy measures in PIAAC, literacy levels and reading components, in terms of size and significance regarding labour market participation in Germany. If the reading component however, do not provide any additional information on low literate adults’ labour market participation, one might question whether assessing the reading components in the current design is useful for PIAAC.
Literacy Measures in PIAAC
Literacy in PIAAC is defined as “understanding, evaluating, using and engaging with written texts to participate in society, to achieve one’s goals, and to develop one’s knowledge and potential” (OECD, 2012a, p. 22). PIAAC measures literacy using computer and paper-based assessments. In order to better describe individuals who do not perform well in this literacy test, a reading component test was added (OECD, 2016). The two measures are described in the following subsections.
Literacy Levels
The PIAAC literacy levels measure individuals´ ability to access and identify information in a text, interpret this information, which means relating different parts of a text to one another, and to evaluate this information (OECD, 2016). Figure B1 in the appendix is an example of how a task of low to medium difficulty in the PIAAC literacy assessment may look like.
The literacy proficiency results are presented on a 500-point scale for all individuals in PIAAC. The average score for Germany is 270 with a standard deviation of 47 points. To make the interpretation and comparison of performance on literacy tasks more manageable, the scale is divided into six proficiency levels, which range from below Level 1 to Level 5 (OECD, 2016; Yamamoto, Khorramdel, & von Davier, M. 2013a). For our analyses we distinguish between respondents with high and low literacy proficiency. This is because we want to compare the literacy measure to the reading components measure (see discussion below). We define low literacy as scores at or below Level 1 on PIAAC’s literacy scale. The distribution of respondents over literacy levels is presented in Figure 1.
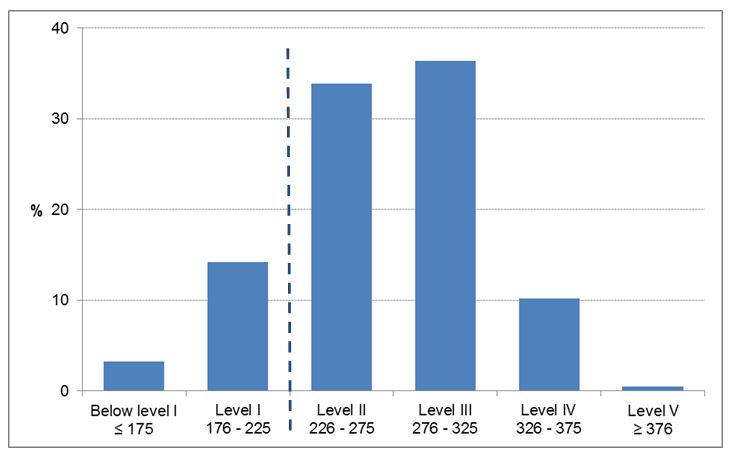
Figure 1: Distribution in % over literacy levels[1] in Germany, including thresholds for literacy levels (own calculations)
Reading components
Based on the idea that reading consists of word recognition as well as linguistic comprehension, the reading components approach aims to differentiate the lowest level of readings skills into components that are fundamental for the reading process (Hoover & Tunmer, 1993):print vocabulary, sentence processing and passage comprehension (see Sabatini & Bruce, 2009, for a detailed overview of these three measures). The three measures are not placed on one common scale and are analysed separately (c.f., Strucker, Yamamoto and Kirsch, 2007). Although respondents completed the reading components tasks without time restriction, the total time they took was recorded. Examples of tests for the three reading components are presented in Figure B2 in the appendix.
Not all respondents took the reading components test as it was only part of the paper-based assessment. The aim of testing the reading components only on paper was to reach only low literate respondents and not burden medium and high literate respondents with a test that is very easy for them to take. Three groups of reading component test takers can be distinguished according to their routing into the reading component assessment (see Figure 2).
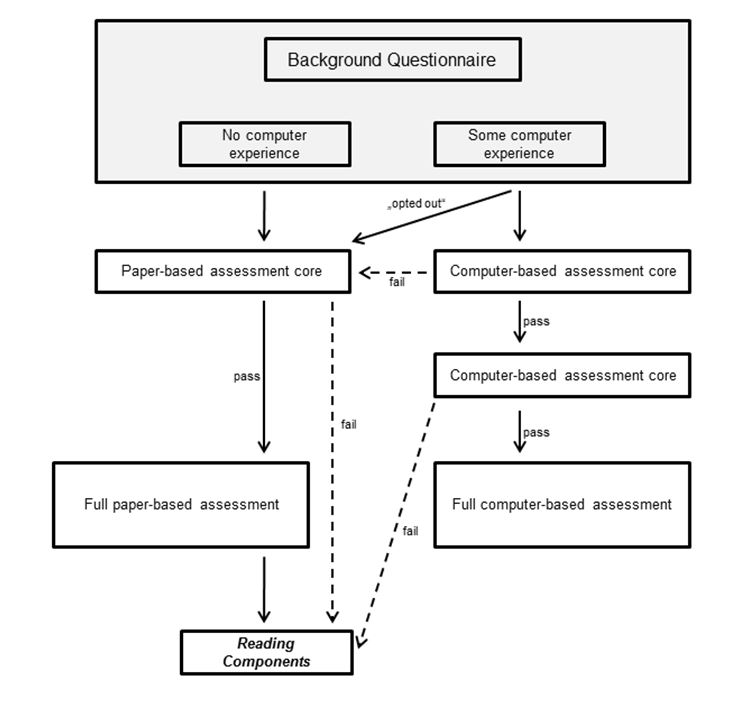
Figure 2: Routing in PIAAC (adapted from OECD, 2016)
The first group consists of the adults who reported that they have no or little experience in using computers. These were directed to the paper-based assessment immediately (no computer experience) or after failing a test on basic test application features (little computer experience). 56.4 % of the reading component sample belongs to this group. A second group refused to take the computer assessment and was given the opportunity to take the paper-based test (33.7 % of the reading component sample). The third group consists of adults who passed the computer application test. However, they failed a test consisting of six very easy literacy and numeracy items and were routed to the reading component test directly without taking the PIAAC literacy test (10.0 %, Zabal et al., 2014.[2] It is only this third group which can, with some certainty, be identified as low literate readers.
It becomes apparent that the selection of respondents into the reading component test is not entirely based on literacy skills. This becomes even more obvious when looking at the cross table between low vs. medium and high literate on the PIAAC literacy scale in the appendix (Table A1, from here on we will refer to the group “medium to high literate” as “high literate”) and the participation in the reading component test. 13.4 % of the respondents who did not take the reading component test are considered low-literate (i.e., at or below Level 1) while 64.9 % of the respondents who took the reading component test are considered high literate.
The reading component test does not follow the same scale as the literacy test. Instead, percentage of correct answers in the test and mean time needed to solve the tasks play a role for determining the performance in the reading components test. Therefore, we divide the reading component sample into efficient and inefficient readers. Efficient readers score 90 % or more correct answers and need less than the mean time to complete the task (rounded to half a minute). A 90 % threshold might seem to be a rather high value. But a relatively high guessing probability between 24 and 50 %, depending on the number of possible answers to choose from, makes it easy to score around 40 % correct answers without having any literacy skills at all. Inefficient readers either fail to solve the reading components tasks or, if they can solve them, need more time to do so. This distinction is done for every reading components domain separately and results in three binary variables for our analysis.
Data, Sample, and Methodology
Data
The data for our analysis come from the German PIAAC 2012 Sample (Rammstedt et al., 2016) and its extension with microm data (Rammstedt et al., 2017).[3] The survey assesses the proficiency of the working-age population in literacy, numeracy and problem solving in technology-rich environments. Furthermore, it uses a comprehensive background questionnaire to collect information on participants’ socio-demographic characteristics, their educational background and labour market participation. Data in Germany was collected from October 2011 to March 2012 and the total sample consists of 5,465 men and women. The response rate in PIAAC Germany is 55 %. Further information on study design and sample quality can be found in Zabal et al. (2014).
Sample
We restrict our analysis to the respondents who took the reading component assessment (822 individuals). We exclude individuals who did not finish the assessment, who are still in their initial education cycle, or who have missing values for some explanatory variables. We are left with a total sample size of 725. Our analysis sample is not a random sample. As described above, participants in the reading component test were selected according to their familiarity with computers or their basic literacy performance. Table 1 presents the basic sample statistics in comparison to the full PIAAC sample.

Methodology
In our analysis we examine whether for the sub-group of individuals who are considered low literate the PIAAC reading components provide more information than the PIAAC literacy levels. We do so by comparing both measures in how well they can predict an individual’s likelihood to be employed. Hence, we test the predictive validity of the reading components test in relation to the PIAAC literacy scale. Our paper is therefore an addition to the work done by Strucker et al. (2007) who very carefully analysed the content validity of the reading component approach.
In our analyses we define employment according to the International Labour Organization (ILO, 1982) as an individual who has worked at least one hour in the week preceding the survey. We include socio-demographic characteristics widely used in analysis on labour market outcomes to control for potential biases: gender, potential work experience (age minus six minus years of schooling)[4] and potential work experience squared, education (eight categories according to the International Standard Classification of Education), a dummy variable for participation in further education in the 12 months preceding the survey, a dummy to indicate whether a person holds the same native language as the test language (German), and the regional unemployment rate.
We estimate a set of logistic regressions to analyse the determinants of employment for adults who took the reading component assessment.[5] In every model the dependent variable is employment, but the models differ regarding the reading ability measures used as an explanatory variable. Sampling and replicate weights are also taken into account (Mohadjer, Krenzke, & van de Kerckhove, 2013a, 2013b).
In a second step we use the Wald-test[6] to analyse whether each of the reading component measures significantly increases the model fit compared to using the PIAAC literacy levels alone (see e.g. Hosmer, Lemeshow, & Sturdivant, 2013).
In a third step we run the same set of logistic regressions, however, we divide the sample into low vs. high literate (according to the PIAAC literacy scale) in order to test whether the predictive power of the reading component tests is higher for adults at the lower end of the literate scale.[7]
Results
To have a general idea of how employment shares are distributed we included employment shares by literacy status in Table A2 in the appendix. For all literacy tests the employment shares are lower when test scores are low compared to high performance in these tests.
Results of our logistic regression analysis are presented in Table 2. Reference categories for each literacy measures included in the different models are low literacy level and inefficient use of reading components, respectively. In Model (1) we include performance on the PIAAC literacy scale as a binary measure of literacy proficiency in our regression. The coefficient is significant on the 10-percent-level. Thus, the higher the proficiency in PIAAC literacy, the higher are the chances of being employed. Similarly, the performance in print vocabulary, sentence processing, and passage comprehension tasks adds to the chances of being employed as the coefficients are highly significant and they are also larger than the one for literacy level in Model (1). Model (5) includes all reading component measures. The two domains print vocabulary and passage comprehension have a significant association with the likelihood of being employed.
In Models (6) to (8) we include literacy level as well as one of the three reading components tasks, respectively. In Model (6) the literacy level coefficient is not significant while the coefficient for print vocabulary is highly significant although lower compared to Model (2). Model (7) includes sentence processing as well as literacy level. The size of both coefficients is lower compared to the case in which they are included in the model separately and only the coefficient for sentence processing is significant. In Model (8) passage comprehension and literacy level are used as predictors. Again, both coefficients are lower than in Models (1) and (4) and only passage comprehension is significant. Also here, the coefficients for the three reading component measures (Model (6) through (8)) are larger than the one for literacy level in the respective models while the coefficients for literacy level are insignificant throughout these models. Model (9) includes all four measures of literacy proficiency. Again, as in Model (5), only the coefficients for print vocabulary and passage comprehension are significant. Hence, again performance in print vocabulary and passage comprehension help to explain the employability of poor readers better than the PIAAC literacy levels, whereas performance on sentence processing seems to only have an increased explanatory power compared to the PIAAC literacy levels when it is used as a single predictor of the reading components.
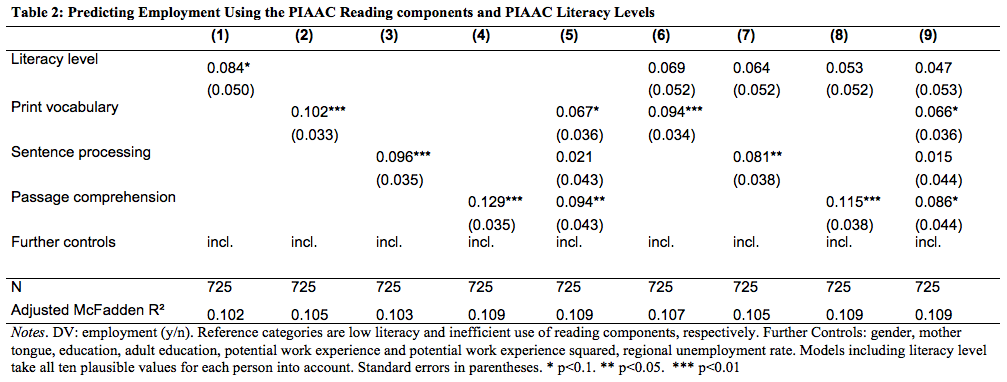
When adding variables to the model which measure the same or a similar construct, multicollinearity may occur (Kennedy, 2008). As this is the case in models (5) through (9), we check the Variance Inflations Factors which do not exceed 2.5 indicating that our models are not affected by multicollinearity. We also included the correlation matrix of literacy measures in the appendix (Table A3). Print vocabulary and sentence processing, respectively, and literacy levels are weakly correlated. All other combinations are moderately correlated.
Beyond looking at size and significance of the coefficients on literacy measures, we want to evaluate which model fits the data best. Thus, we perform Wald-tests that test whether including different literacy measures in our model on predicting employment increases the model fit. For example, the Wald-test for Model (1) would test whether leaving the measure of literacy levels out of the model significantly reduces its fit. A p-value smaller than 0.05 indicates that we can reject the null hypothesis that the left out coefficient(s) is (are) equal to zero (Hosmer et al., 2013). Hence, the coefficient(s) has (have) additional explanatory power. Table 3 gives an overview on the respective Chi-squared values generated by the Wald-test and its p-values for each logistic regression model.
The Wald-test resulted in the null hypothesis not being rejected for Model (1), implying that there is no evidence that adding literacy levels to the model increases the model fit. For Models (2), (3) and (4) the null hypotheses can be rejected. The three models include print vocabulary, sentence processing as well as passage comprehension, respectively, and the model fit is increased when adding the respective reading component measure to the model. For Model (5), which includes all reading component measures, the null hypotheses can be rejected due to the rejection for passage comprehension included in the model. The results for Models (6) to (8), which include literacy level and reading component measures as explanatory variables, suggest similar results. While the null hypotheses can be rejected for the PIAAC literacy levels in Models (6) to (8), all reading components lead to a significant increase in the model fit. The Wald-test results for Model (9), which includes all four literacy measures, show that the model fit only increases when all measures are included into the model.
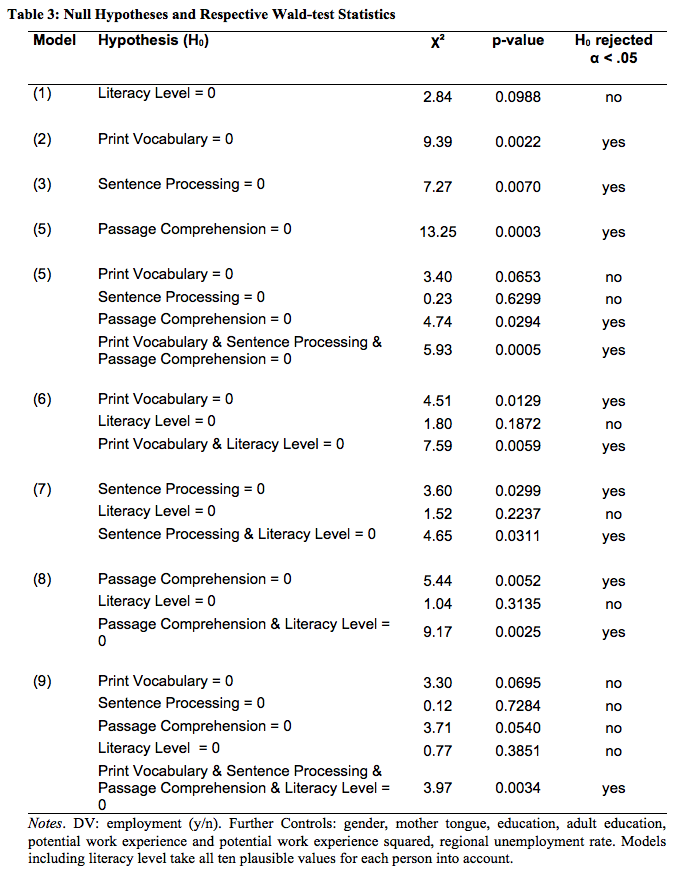
The results of the Wald-tests reflects the findings from the regression results presented in Table 2 in which the reading component coefficients are larger than those of literacy levels and remain significant (except sentence processing in combination with print vocabulary and passage comprehension) throughout all models that include these measures.
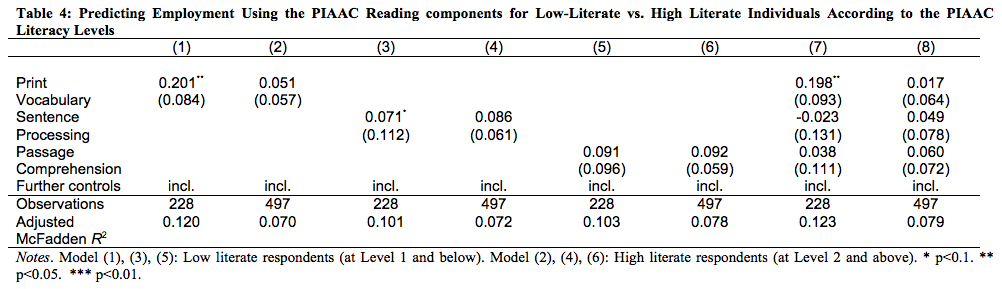
In a third and final step we split the sample into low literate and high literate individuals, according to the PIAAC literacy levels (Table 4). This distinction allows for the assessment of whether the reading component test predicts employment better for the actual low literate (as it is designed) than for the high literate. Similarly to our approach above, we introduce the three reading components measures individually at first and then run a model which includes all three measures. Models (1), (3), (5), and (7) are run with low literate individuals and Models (2), (4), (6), and (8) with high literate individuals. The coefficients for print vocabulary and sentence processing are both significant predictors for employment for the low literate, while they are insignificant for high literate (Models (2) and (4)). For passage comprehension the coefficients for both groups are insignificant (Models (5) and (6)). When all reading component measures are included in the model (Models (7) and (8), only print vocabulary remains significant at the 5 % level for low literate individuals, while insignificant for the group of high literate individuals. Sentence processing is insignificant for both groups, reflecting our results for the full sample in Table 2. Similarly to Models (5) and (6) passage comprehension is also insignificant when included simultaneously with the two other measures. What is striking is that the Pseudo-R² in models (1), (3), (5), and (7) for the low literate sample are much higher than in models (2), (4), (6), and (8) for the high literate sample, confirming that these measures work better in predicting employment for the low literate.
Discussion and Conclusion
For the sample we use, our results indicate that the assessment of the three reading components in PIAAC help to gain additional information about adults with poor reading skills concerning the likelihood of their integration in the labour market. The performance in all three tasks is positively related to higher chances of being employed. This positive relationship remains when adding the PIAAC literacy levels as an indicator of literacy proficiency. Print vocabulary and passage comprehension are the only factors that remain statistically significant for the likelihood of being employed when all four measures (three reading component measures and literacy levels) are added to the logistic regression model. The Wald-tests emphasize our findings as they confirm that the models including the reading components significantly increase the overall model fit while adding the PIAAC literacy levels does not.
Furthermore, when we split the sample into low literate and high literate individuals, print vocabulary and sentence processing remain significant predictors of employment for the low literate sample. For high literate readers all three reading component measures are insignificant.
Following that, we conclude that the reading components are suitable for analysing the likelihood of low literate for being employed. They provide additional information on low-skilled readers’ economic participation compared to using the PIAAC literacy levels alone. For the full sample, better model fits are achieved with individual reading component measures and when all three reading component measures are jointly used in the regression. However, distinguishing the reading components sample into low and high literate according to the PIAAC literacy scale results in a rather small sample of low literate individuals. It therefore remains unclear whether the passage comprehension measure is indeed not relevant for determining the likelihood of low literate being employed or whether its significance is not revealed due to the small sample size.
Hence, a major drawback is the sample we analysed in this paper. The participants in the reading components assessment were selected from the representative German PIAAC sample according to their lacking computer experience or by refusing to take a computer-based test. Only a small proportion of test takers (10 %) can be clearly identified as low literate based on their failure in a very basic reading test. This group is too small for meaningful analyses. It is therefore not a random sample and our results should not be interpreted in a way to provide deeper insights into labour market participation of the low literate. Rather, we want to point out the challenges when working with the reading component sample as it is currently designed. To solve the problem of having a non-random reading component sample, the routing into the reading components should be improved. As described above, the assessment did not include all low literate respondents in PIAAC while, at the same time, it did include adults who can be considered as high literate. Hence, in further assessments respondents with little or no computer experience should not be automatically routed into the reading component assessment. Instead, a more comprehensive basic reading test is advised which could include a larger variety of low literate in the reading component assessment.
A larger and more carefully defined reading component sample also brings more variance into the data, compared to mostly well performing test takers due to the current routing. This will allow more meaningful analyses with this sample than it is currently possible.
Further research is needed to verify our results. We suggest three main research directions. First, one should analyse the relationship between performance in the two tests and further labour market outcomes, such as earnings and job satisfaction.
Second, it is necessary to perform our analysis for a variety of languages as the ability of the reading component measures to predict economic outcomes may differ across languages. The relationship between spoken language and a language’s written system is different in each language. These further analyses will reveal whether our conclusion for the German sample is true for other languages as well. Based on such results, one can also decide whether language specific reading components or similar measures should be developed for international literacy assessments such as PIAAC.
And third, it is useful to test the assessment of the reading components against several other assessments that are designed to measure reading skills of adults at the lower end of the continuum. For example, in Germany one could test the reading component approach against the leo. – Level-One-Study (Grotlüschen, Riekmann, & Buddeberg, 2012).
[1] The distribution over the six levels does not add up to 100 %. 86 individuals are part of the German PIAAC sample but did not participate in any competency test due to language or health reasons (literacy related non-response).
[2] Even though these individuals do not take the PIAAC literacy test, they are assigned a literacy score through imputation according to Item-Response-Theory (Yamamoto, Khorramdel, & von Davier, M., 2013b).
[3] Microm data is street-level background data, such as unemployment rate, provided by microm Micromarketing-Systeme und Consult GmbH, Neuss, Germany.
[4] Potential work experience is the time span between leaving school and the time of the survey. By using the potential work experience, contrary to actual work experience, the analyses are not affected by the internal choice to work or not.
[5] Item-Response-Theory was applied when creating the PIAAC literacy scores. This results in a measurement error that is corrected by empirically deriving a distribution of ten plausible values. We apply Rubin’s Rule (Rubin, 1987; Von Davier, Gonzalez, & Mislevy, 2009) to account for all ten plausible values in all models that include literacy levels as an independent variable. When distinguishing the sample by literacy levels, we assign respondents to a level according its threshold ten times (once with each plausible value). Following Rubin’s Rule, we then conduct the analyses 10 times and take the average of the ten results.
[6] The Wald test is the only suitable model fit test for data with multiple imputations. See f. ex. Buse (1982) for an overview of different model fit tests and a discussion on Statalist: https://www.stata.com/statalist/archive/2012-05/msg00860.html
[7] Instead of interaction effects we split our sample, i.e. running a fully interacted regression. This is due to constraints in data analysis and Item Response Theory only allowing analysing variables included in the population model. Interaction terms were not included in the population model (Rutkowski, Gonzalez, Joncas, von Davier, 2010; Yamamoto et al., 2013b)
Appendix
Appendix A
Table A1: Participation in reading component test by literacy status
Table A2: Employment Shares by High vs. Low Literacy According to Both Literacy Measures
Table A3: Correlation Matrix of Literacy Measures
Appendix B
References
- Arendt, J. N., Rosholm, M., & Jensen, T. P. (2005). The importance of literacy for employment and unemployment duration. Syddansk Universitet.
- Buse, A. (1982). The Likelihood Ratio, Wald, and Lagrange Multiplier Tests: An Expository Note The American Statistician, 36(3), 153–157.
- Finnie, R., & Meng, R. (2005). Literacy and labour market outcomes: self-assessment versus test score measures. Applied Economics, 37(17), 1935–1951.
- Grotlüschen, A., Riekmann, W., & Buddeberg, K. (2012). Hauptergebnisse der leo. – Level-One Studie. In A. Grotlüschen & W. Riekmann (Eds.), Funktionaler Analphabetismus in Deutschland. Ergebnisse der ersten leo. – Level-One Studie (pp. 13–53). Münster: Waxmann.
- Grotlüschen, A., Heinemann, A.M.B., Nienkemper, B. (2015). Stärken zweier Leitstudien für die Weiterbildung. PIAAC und leo. – Level-One Studie im Vergleich. In A. Grotlüschen & D. Zimper (Eds.), Lern- und Adressatenforschung zur Grundbildung (pp. 79–88). Münster: Waxmann.
- Hanushek, E. A., & Woessmann, L. (2015). The Knowledge Capital of Nations. Education and the Economics of Growth. Cambridge, Massachusetts: MIT Press.
- Hanushek, E. A., Woessmann, L., Schwerdt, G., & Wiederhold, S. (2015). Returns to skills around the world: Evidence from PIAAC. European Economic Review, 73, 103–130.
- Hoover, W. A., & Tunmer, W. E. (1993). The components of reading. In G. B. Thompson, W. E. Tunmer & T. Nicholson (Eds.), Reading acquisition processes (pp. 1–19). Philadelphia: Multilingual Matters.
- Hosmer, D. W., Lemeshow, S., & Sturdivant, R. X. (2013). Applied Logistic Regression. John Wiley & Sons.
- ILO. (1982). Resolution concerning statistics of the economically active population, employment, unemployment and underemployment. Paper presented at the Thirteenth International Conference of Labour Statisticians, Genf.
- Jäckle, R., & Himmler, O. (2012). Ökonomie und Analphabetismus. In A. Grotlüschen & W. Riekmann (Eds.), Funktionaler Analphabetismus in Deutschland: Ergebnisse der ersten leo. – Level-One Studie (pp. 267–289). Münster: Waxmann.
- Kennedy, P. (2008). A Guide to Econometrics. 6th edition. Malden, MA: Wiley-Blackwell.
- Mohadjer, L., Krenzke, T., & van de Kerckhove, W. (2013a). Sampling design. In OECD (Ed.), Technical report of the Survey of Adult Skills (PIAAC). Paris: OECD.
- Mohadjer, L., Krenzke, T., & van de Kerckhove, W. (2013b). Survey weighting and variance estimation. In OECD (Ed.), Technical Report of the Survey of Adult Skills (PIAAC). Paris: OECD.
- National Research Council. (2012). Improving adult literacy: Options for practice and research. Washington, DC: National Academy of Sciences.
- OECD. (2012a). Better skills, better jobs, better lives: A strategic approach to skills policies. Paris: OECD Publishing.
- OECD. (2012b). Literacy, Numeracy and Problem Solving in Technology-Rich Environments: Framework for the OECD Survey of Adult Skills. Paris: OECD Publishing.
- OECD. (2016). Skills Matter: Further Results from the Survey of Adult Skills. Paris: OECD Publishing.
- Osberg, L. (2000). Schooling, Literacy and Individual Earnings. International Adult Literacy Survey. Ontario Statistics Canada, Dissemination Division, Circulation Management.
- Rammstedt, B., Martin, S., Zabal, A., Konradt, I., Maehler, D., Perry, A.,…Helmschrott, S. (2016). Programme for the International Assessment of Adult Competencies (PIAAC), Germany – Reduced Version [ZA5845, Data file Version 2.2.0]. Available from GESIS Data Archive, Cologne. doi:10.4232/1.12660.
- Rammstedt, B., Martin, S., Zabal, A., Helmschrott, S., Konradt, I., Maehler, D. (2017). Programme for the International Assessment of Adult Competencies (PIAAC), Germany – Extended Version – microm data [ZA5963, Data file Version 1.0.0]. GESIS Data Archive, Cologne. doi:10.4232/1.12926.
- Rubin, D. (1987). Multiple Imputation for Nonresponse in Surveys. John Wiley & Sons.
- Rutkowski, L., Gonzalez, E., Joncas, M. von Davier, M. (2010). International Large-Scale Assessment Data: Issues in Secondary Analysis and Reporting. Educational Researcher, 39(2), 142–151. DOI: 10.3102/0013189X10363170
- Sabatini, J. P., & Bruce, K. M. (2009). PIAAC Reading components: A Conceptual Framework. OECD Education Working Paper No. 33. Paris: OECD
- Solga, H. (2008). Lack of Training: Employment Opportunities for Low-Skilled. In K. U. Mayer & H. Solga (Eds.), Skill Formation. Interdisciplinary and Cross-National Perspectives (pp. 173–207). Cambridge University Press.
- Strucker, J., Yamamoto, K. Kirsch, I. (2007). The Relationship of the Component Skills of Reading to IALS Performance: Tipping Points and Five Classes of Adult Literacy Learners. NCSALL Reports #29. Cambridge, MA: National Center for the Study of Adult Learning and Literacy.
- Von Davier, M., Gonzalez, E., & Mislevy, R. (2009). What are plausible values and why are they useful. IERI monograph series, 2, 9–36.
- Yamamoto, K., Khorramdel, L., von Davier, M. (2013a). Scaling Outcomes. In OECD (Ed.), Technical report of the Survey of Adult Skills (PIAAC). Paris: OECD.
- Yamamoto, K., Khorramdel, L., von Davier, M. (2013b). Scaling PIAAC Cognitive Data. In OECD (Ed.), Technical report of the Survey of Adult Skills (PIAAC). Paris: OECD.
- Zabal, A., Martin, S., Massing, N., Ackermann, D., Helmschrott, S., & Barkow, I. (2014). PIAAC Germany 2012. Technical Report. Münster: Waxmann.
-
Keywords
calibration CATI coverage coverage bias cross-national surveys data linkage data quality European Social Survey experiment face-to-face face-to-face survey Facebook hard to reach populations incentives item nonresponse measurement measurement error mixed-mode surveys multitasking non-probability samples Nonresponse nonresponse bias nonresponse rates paradata PIAAC Probability sample probability samples QR codes rare populations response rate Satisficing social desirability Social media survey survey-taking climate survey data survey management survey methods Telephone survey telephone surveys total survey error unit nonresponse validity web survey Web surveys weighting
