

Using Geofences to Collect Survey Data: Lessons Learned From the IAB-SMART Study
Haas, G.-C., Trappmann M., Keusch F., Bähr S. & Kreuter F. (2020). Using Geofences to Collect Survey Data: Lessons Learned From the IAB-SMART Study in Survey Methods: Insights from the Field, Special issue: ‘Advancements in Online and Mobile Survey Methods’. Retrieved from https://surveyinsights.org/?p=13405
© the authors 2020. This work is licensed under a Creative Commons Attribution 4.0 International License (CC BY 4.0) 
Abstract
Within the survey context, a geofence can be defined as a geographical area that triggers a survey invitation when an individual enters the area, dwells in the area for a defined amount of time or exits the area. Geofences may be used to administer context-specific surveys, such as an evaluation survey of a shopping experience at a specific retail location. While geofencing is already used in other contexts (e.g., marketing and retail), this technology seems so far to be underutilized in survey research. We implemented a geofence survey in a smartphone data collection project and geofenced 410 job centers with the Google Geofence API. Overall, the app sent 230 geofence-triggered survey invitations to 107 participants and received 224 responses from 104 participants. This article provides an overview of our geofence survey, including our experiences analyzing the data. We highlight the limitations in our design and examine how those shortcomings affect the number of falsely triggered surveys. Subsequently, we formulate the lessons learned that will help researchers improve their own geofence studies.
Keywords
analysing data, geofence, IAB-SMART, limitations, triggered surveys
Copyright
© the authors 2020. This work is licensed under a Creative Commons Attribution 4.0 International License (CC BY 4.0)
Introduction
Designed for the purpose of survey data collection, a geofence can be defined as a geographical area that triggers a survey invitation when an individual enters the area, dwells in the area for a defined amount of time or exits the area. For a geofence to work, the individual needs to carry a device, such as a smartphone, that collects geolocation data and allows geofence software to run within an app that triggers the survey invitation. The geofence software can identify if the individual is inside or outside the geofence.
In market research, geofences are used to collect real-time feedback about a store or other establishment aimed at reducing the recall bias of costumers (Greenwood 2017). Geofences might also be used in combination with ecological momentary assessments (EMAs, e.g., Stone and Shiffman 1994). Usually, EMAs consist of asking participants about their current affect or behavior at random points in time during a day. Geofences allow researchers to target these questions about people’s moods or behaviors when they are at a specific location (e.g., at school, the work place, a fitness studio). For instance, Wray et al. (2019) used smartphone geofences to evaluate if specific characteristics of locations such as bars are associated with consuming more alcohol when visited by study participants.
However, to date, the literature on geofences in surveys is very sparse, and no clear study design guidelines exist that would help researchers to avoid certain pitfalls when employing this technology for survey research.
We conducted a feasibility study where we geofenced 410 job centers in Germany to assess whether geofence surveys can provide researchers with insightful data on formal job search methods. Usually, the Panel Study “Labour Market and Social Security” (PASS) collects data on formal job search methods with a yearly telephone or face-to-face survey in Germany (Trappmann et al. 2019). One dimension of the formal job search methods that PASS assesses is welfare recipients visiting a job center. Asking respondents about their experience during job center visits once a year may bias estimates if respondents visit the job center multiple times during that year. During the PASS interview, respondents have to summarize their experience over all visits in a given year. Furthermore, since job center visits may have happened almost a year ago at the time of the interview, responses are likely to suffer from recall bias (see Tourangeau et al. 2000). Geofences offer the possibility to collect information on respondents’ feelings directly after each job center visit, that means, for each job center visit, we get a timely estimate of the current visit.
During analysis of the data from our feasibility study, we noticed several challenges that are easy to overlook when designing a geofence survey. Since the literature provides little guidance on how to conduct geofence-triggered survey data collection, this article serves as a summary of different challenges that survey researchers should consider when conducting a geofence survey. The geofence study is part of a larger app data collection project (Kreuter et al. 2018). We first provide an overview of the main study and describe our geofence survey design. We then report the number of triggered surveys and responses, followed by an evaluation of our geofence study. Finally, we list the lessons learned from our study that will help future geofence studies to improve their designs.
Design
The IAB-SMART study uses a smartphone app to collect data for labor market research from the smartphones of participants. The app was designed to collect passive smartphone data and to deliver short surveys. In January 2018, we invited 4,293 participants of the Panel Study “Labour Market and Social Security” (PASS) via a postal letter to install the IAB-SMART app on their smartphones, respond to survey questions and passively share data over a period of six months.
PASS is a household panel survey based on a probability sample of the residential population aged 15 and above in Germany with annual waves of data collection (Trappmann et al. 2019). The goal of PASS is to facilitate research on unemployment, poverty and the receipt of state transfers. The questionnaire focuses, among other topics, on income sources, deprivation, (un)employment, job search behavior, social inclusion and attitudes towards the labor market. A dual sampling frame (population registers and welfare benefit recipient registers) is used in order to oversample welfare benefit recipients (for more information, see Trappmann et al. 2013). The data collection mode of PASS is a sequential mixed-mode combination of computer-aided personal and telephone interviews. Overall, 13,703 respondents participated in wave 11 in 2017. Invitation to the IAB-SMART study was restricted to respondents aged 18—64 (n=11,208) who had reported owning an Android-operated smartphone (n=6,544), conducted their wave 11 PASS interview in the German language (n=5,826) and agreed to be re-contacted for the panel (n=5,771). We only invited Android smartphone users because extensive passive data collection is restricted under iOS (the operating system of Apple iPhones). The shares of other operating systems are too small to justify the effort to program additional apps. Keusch et al. (2020a) evaluated how smartphone owners as well as android and iOS smartphone owners differ from the general population in Germany. The authors find that the likelihood of owning an Android smartphone increases with being male, younger and with a higher formal education level. Out of the 5,771 eligible respondents, 4,293 were randomly selected and invited to participate in the IAB-SMART study with a postal letter and one reminder. Overall, 685 of the invited PASS participants installed the app (Keusch et al. 2020b).
During the installation process, individuals could decide if they wanted to allow the IAB-SMART app to passively collect data by enabling up to five data collection functions: (1) network quality and location information, (2) interaction history, (3) social network characteristics, (4) activity data, and (5) smartphone usage. Withdrawing consent was possible at any time in the app’s setting menu. For the purpose of this specific study, we only used information from the first function, and we only did this to verify information about geofences (see below). More details on the other functions, including consent rates, can be found in Kreuter et al. (2018).
“Network quality and location information” app function
If an individual decided to enable the “Network quality and location information” function, they allowed the app to collect the location of the smartphone every 30 minutes and to trigger surveys via the geofences. Note, however, that the geofencing did actually happen outside this custom-made function (see below). However, to receive a geofenced survey in the app, the function needed to be enabled by the participant. Out of the 680 participants of the IAB-SMART study, 577 participants (87.4 %) successfully shared at least one geoposition with us during the data collection period and 209 participants (30.6 %) shared at least one geoposition per day for over 180 days. To collect geopositions, four different methods were used, with each method acquiring data with different accuracy: (1) GPS (median accuracy: 12 meters), (2) mobile carrier network (median accuracy: 20 meters), (3) WiFi (median accuracy: 30 meters), and (4) cell tower database (median accuracy: 930 meters). With each 30-minute measurement, the app tried to collect the most accurate geoposition available (see Bähr et al. in press). We used this information to verify which geofence triggered a survey.
Job center geofences
We specified 410 geofences distributed across Germany for our study. Each geofence was defined as an area with a 200-meter radius around a job center. Job centers are agencies responsible for the provision of welfare benefits for people aged 15—64 who are able to work. In Germany, this welfare benefit is called Unemployment Benefit II and is available to all households with an insufficient income, irrespective of the labor market status of their members, as long as at least one member is aged 15—64 and able to work. Job centers administer the payments but also have the task to support recipients in finding employment, providing them with job offers, and offering training or active labor market policy programs. For long-term unemployed who have lower chances to reenter the labor market, such training and programs can focus on stabilizing their life situations and improving their employability. Welfare benefit recipients usually visit their local job centers at regular intervals. These visits can happen for two different purposes: (1) visits to file and discuss claims (administrative meetings) or (2) visits to improve labor market and life situations (consulting meetings).
To prevent falsely triggered surveys (e.g., due to passing by a center), we defined a minimum duration of 25 minutes within the geofence before a survey was triggered. Those 25 minutes are based on a plausible guess on the minimum length of stay at a job center. However, we may have missed some job center visits that took less than 25 minutes. The app would administer a short survey upon exiting the geofence, asking the participant if she had a consulting meeting, and, if so, their experience with the meeting. The survey was triggered after a participant exits the geofence to prevent participants from responding to the survey during their job center visits.
To identify when a participant stayed for at least 25 minutes in a geofence and then exited it, we used the Google Geofence API. The Google Geofence API measures three events (see Figure 1): (1) whether an individual enters, (2) dwells and (3) exits the geofence. In our use case, the Google Geofence API only documented how long an individual dwelled in the geofence and when she exited. For the sake of simplicity, we will use the term visited to describe the procedure of dwelling for at least 25 minutes in a geofence and exiting it.
Note that the Google Geofence API operated independently of our custom “Network quality and location information” function in the IAB-SMART app, and it used Google Services for geopositioning to identify whether an individual visited a geofence. To preserve participants’ privacy, we did not save any geolocation data measured from the Google Geofence API or any other apps. This implies that we did not collect data on which specific geofence triggered a survey. However, to evaluate how well the geofences worked in terms of identifying if a participant was within a geofence, we can use the timestamp of the survey trigger and the geolocation information from our custom 30-minute interval as an approximation of whether a participant was or was not within a geofence at the time the survey invitation was sent (see the Results section).
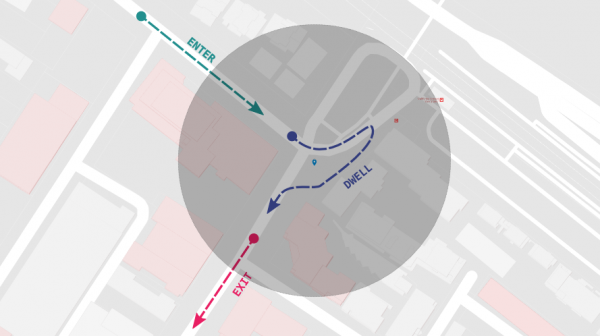
Figure 1: The three events (Enter, Dwell and Exit) that the Google Geofence API measures (source: https://developers.google.com/location-context/geofencing/, accessed: January 12, 2020).
The Google Geofence API has a limit of 100 geofences per user and device. To circumvent this limitation, each user was dynamically assigned to 100 geofences depending on their current spatial area.
Survey data
Upon visiting a job center geofence, the Google API triggered a survey invitation through the IAB-SMART app asking about the job center visit. The first question was used to verify that the participant had a consulting meeting (see Figure 2).
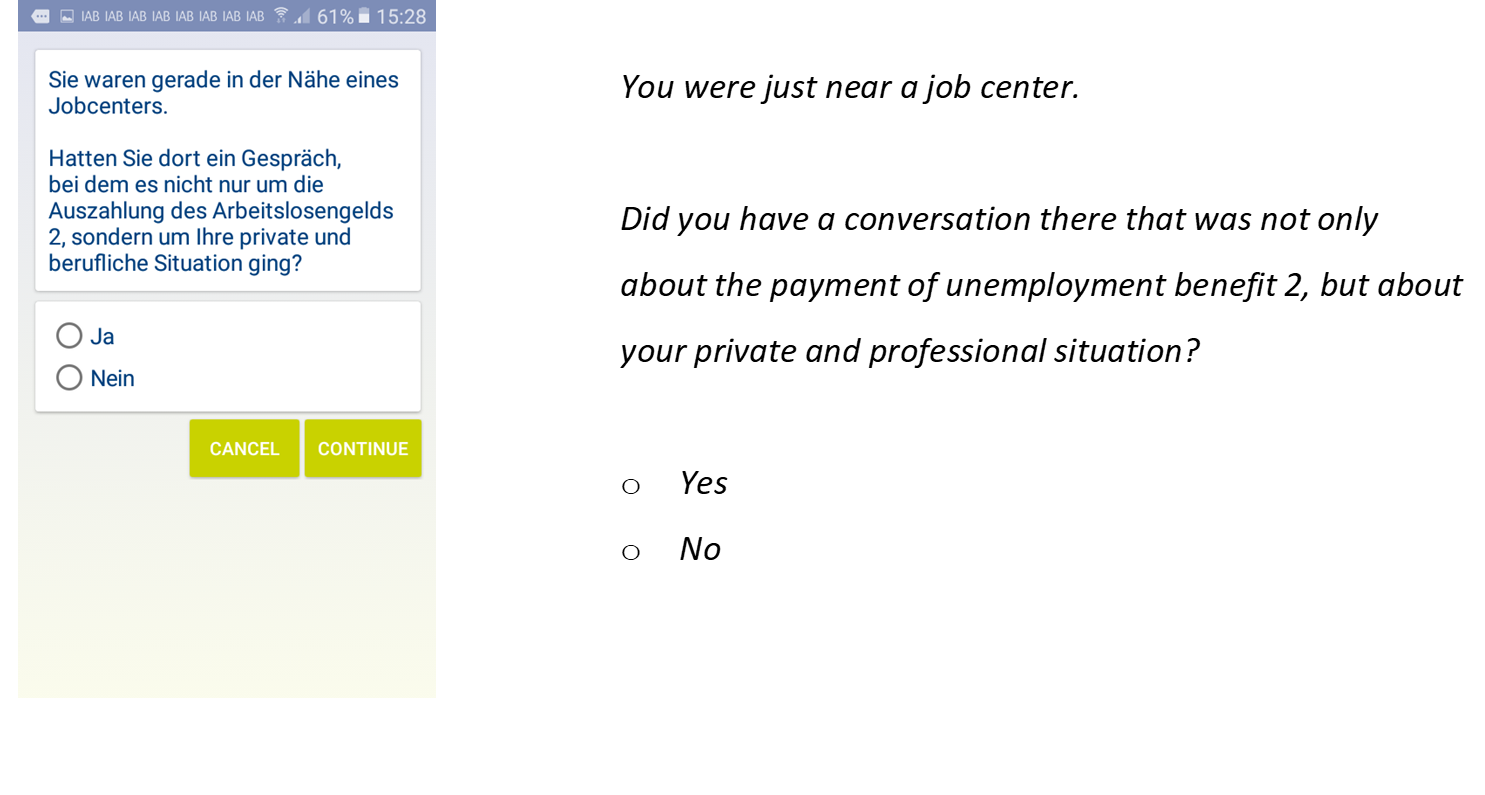
Figure 2: Verification question that appeared as the first question upon accessing the geofence survey with the translation on the left.
If a participant answered the question with no, no follow-up questions were asked; if a participant answered the question with yes, ten follow-up questions were asked evaluating the consulting meeting with the placement officer (see Appendix Figure A1 for the full wording). In the IAB-SMART app, participants were incentivized to allow passive data collection and respond to the short surveys (the job center survey was one of a total of twelve different survey modules programmed into the app). For each answered survey question, participants received an incentive of 10 points, that is participants received 10 points by answering the first question with “No”, and 110 points by answering the first question with “Yes” and completing the entire survey module. Once participants reached 500 points, they could convert the points to amazon.de vouchers; 500 points equaled a 5 Euro voucher (for more information about the incentives, see Haas et al. 2020).
Results
To assess how well the geofence study worked, we organize the presentation of our results in two sections. First, we present the number of triggered invitations and responses for all job center geofences as quantitative measures of how often the geofences triggered a survey in the IAB-SMART study. Second, we discuss the challenges by qualitatively evaluating (1) how considering the operation times of job centers would have affected the number of triggered surveys and responses, (2) if the participant visited a valid geofence, (3) on which day the survey was answered and (4) how well the geofence trigger worked by assessing if the location of our custom function measurement was within a geofence shortly before the time that a survey was triggered. We use data from the custom “Network quality and location information” function and the responses to the in-app survey questions for this purpose.
Number of triggered surveys and responses
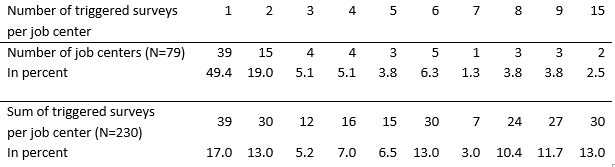
If a participant visits a geofence, the IAB-SMART app triggers a survey invitation. Overall, the IAB-SMART app sent 230 geofence-triggered survey invitations to 107 participants. Table 1 shows that the majority of participants (62) received only one, 18 participants received two and 26 participants received more than two geo-triggered survey invitations, including one participant who received nine invitations. Overall, 104 out of the 107 (97.2%) IAB-SMART participants who received a geofence-triggered survey invitation responded at least once. In terms of invitations, 224 out of a total of 230 (97.4%) survey invitations that were sent led to a response by a participant. Out of these, participants reported 56 times (25.0%) that they had a consulting meeting in the job center.
Table 1: Number of IAB-SMART participants by the number of triggered surveys

Figure 3 shows the positions of all geocoded job centers in the IAB-SMART app. The size of the marker indicates the number of triggered surveys per job center. Overall, 79 of the 410 (19.3%) implemented job center geofences were triggered at least once, whereas the number of triggered invitations per job center ranges from one to 15 times (see Table 2).
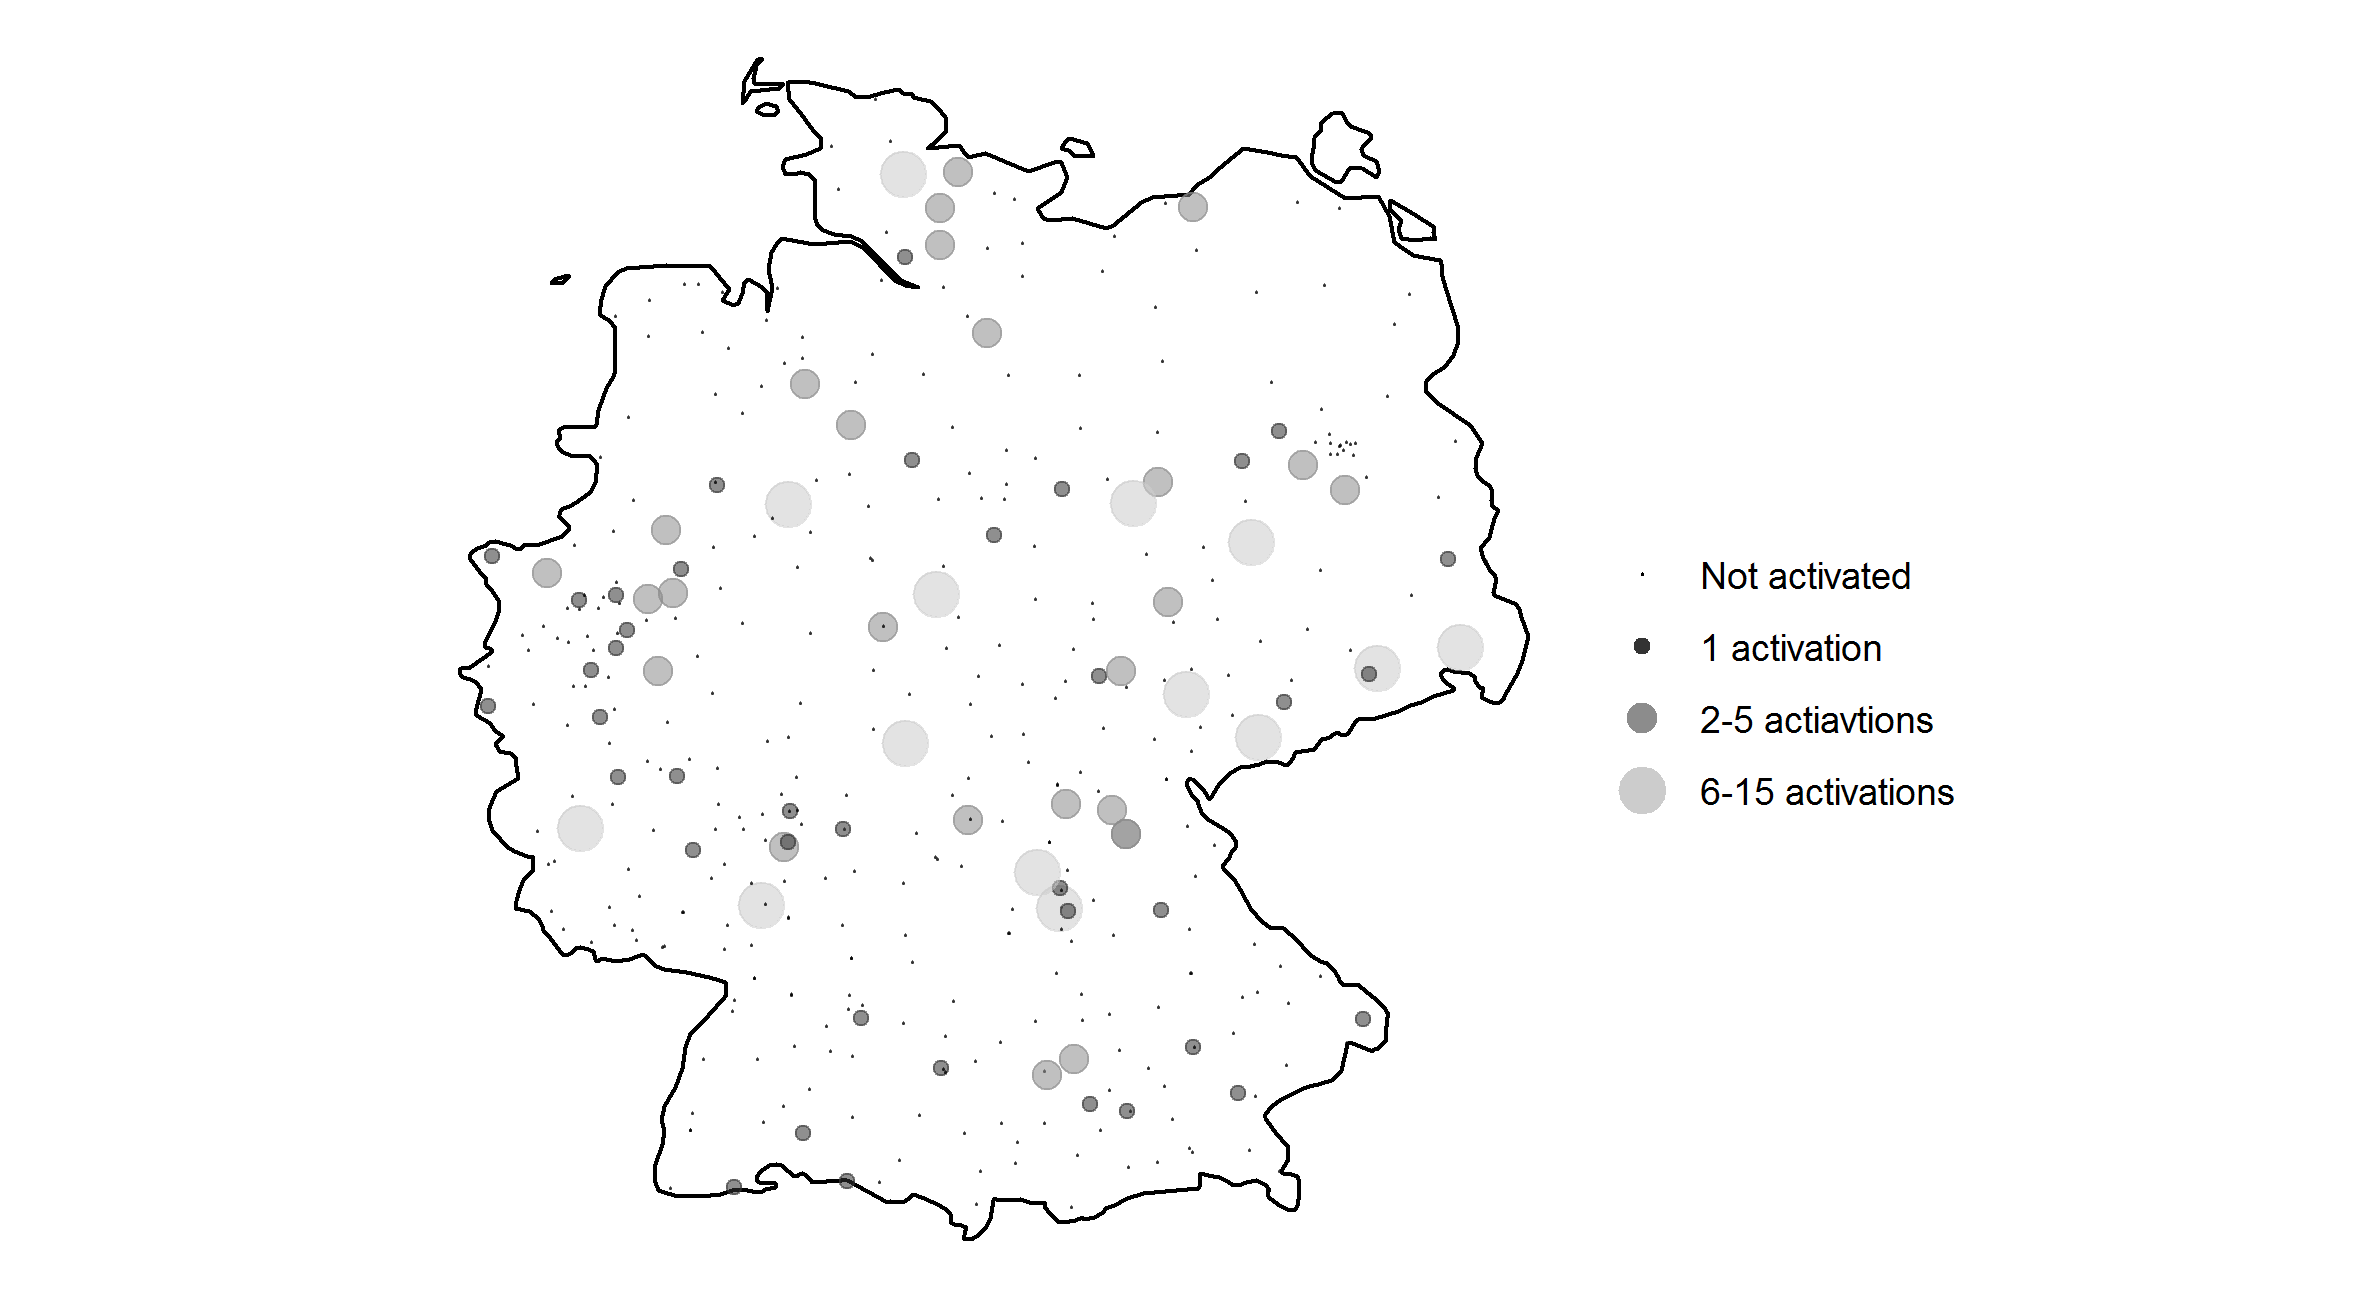
Figure 3: Implemented job center geofences in Germany (N=410)
Table 2: Number of triggered surveys by the number of job centers
Only after the end of our data collection did we notice that five pairs of job centers were very close to each other and thus had overlapping geofences. The closest distance between two job centers in the IAB-SMART app is 167 meters. If a participant visits the overlapping space of two geofences, it is not clear which geofence triggered a survey and, thus, it is not clear which triggered surveys belong to which job center. We did, however, not find a geolocation in our data that indicates that any participant actually dwelled within the overlapping area of two geofences.
Challenges
Operation times of job centers
Our design did not consider the operation times of job centers, which made geofence triggered surveys possible at times when job centers were closed. For the sake of simplicity, we assume that job centers operate from 7 am to 7 pm on business days. The actual opening times may vary slightly between job centers, but these were the maximum opening hours found in a small data collection from the websites of a sample of 15 job centers. Overall, we find 45 (19.6%) triggered surveys on the weekend. Additionally, we find 14 (6.0%) triggered surveys before 7 am or after 7 pm on weekdays. As a result, we have 59 (25.6%) clearly false triggered surveys that could have been avoided by considering the operation times of job centers. This can even be considered a conservative estimate since we chose the maximum opening times.
Each participant who received a survey invitation at the time the job center was closed and responded to the survey (N=59) should have answered “No” to the first survey question asking if a consulting meeting took place. However, we find that in eight surveys (13.6%), respondents reported that they had a consulting meeting in the job center, which are probably false reports. If we sum up the incentive costs of those false triggered surveys, we obtain an amount of 13.9 Euros, which is approximately 18% of the overall incentive costs for the geofence surveys (77.4 Euros). While the monetary consequences are negligible in our study, geofence studies with larger sample sizes may benefit from the cost savings through considering the opening times. Additionally, this points to a potential measurement error problem induced by the incentive structure. Identified false reporters can be interpreted as a reversal of an effect termed ‘motivated underreporting’, where respondents answer filter questions in such a way that they avoid lengthy follow-ups (Eckman et al. 2014). When confronted with the option to earn extra money per question, respondents might tend to choose longer paths through the survey.
Valid geofences per participant
In our design, each participant was able to access each geofence and trigger a survey. In practice, however, each participant is assigned to one job center based on the participant’s home address located within the administrative area of the job center. We do not know the administrative areas of our job centers. For the sake of simplicity, we thus assume that the responsible job center is within a radius of less than 100 kilometers of the participant’s home address. If the distance between a job center geofence that triggered a survey and the home address is greater than 100 kilometers, we can assume that this person walked randomly into the geofence ( e.g., during a business or leisure trip).
To infer home addresses, we use our collected geolocation data from the custom “Network quality and location information” function. First, we assume that most individuals stay more nights at home than anywhere else (i.e., even if individuals work night shifts, they should be more at home than at other places). Second, we round the coordinates of the location measurement to the 3rd digit after the decimal point and identify the rounded location that appears the most often from 8 pm to 6 am over all days of data in the study. Third, we calculate the average of the unrounded location measurements to obtain an approximate home address of the participant.
Overall, we find nine triggered invitations that are more than 100 kilometers away from the participants’ home addresses and are likely implausible. We find that in one of these nine triggered surveys, respondents stated that they had a consulting meeting.
Availability of the survey invitation
With a few exceptions, all surveys sent through the IAB-SMART app were available to participants for seven days after the initial invitation. All geofence survey questions, however, contained the word “TODAY” to reference the day of the geofence visit. This might compromise the validity of the survey responses for participants who did not respond on the day the invitation was sent. We rely on their implicit understanding that the questions refer to the date of the job center visit that triggered the survey.
Comparing the timestamp of the survey invitation with the timestamp of the survey response, we find that for 74 of 224 responded surveys (33.0%), the day of the survey invitation does not match the day of the survey response.
Evaluating the geofence survey trigger
A geofence should only trigger a survey when an individual visits that geofence. In practice, however, the geofence may malfunction in two ways. First, a survey might be triggered even though the geofence was not visited (false positive). We are concerned about this kind of error because each additional survey invitation may increase the respondent’s burden to participate (Bradburn 1978). Furthermore, the content of the survey may be out of context and thus increase the burden. In addition, when individuals receive an incentive for responding to a geofence survey, each survey invitation increases the data collection costs and – as stated above – may even induce false reports of visits that actually did not occur. To minimize the respondent burden, data collection costs and measurement error, we need to minimize false positives.
A second malfunction would be when no survey is triggered, even though the geofence was visited (false negative). If the app fails to trigger a survey, even though the participant visited the geofence, we fail to cover part of the events of interest. This will lead to an underestimation of the frequency of such visits and decrease the statistical power for analyzing such visits. Furthermore, if false negatives are systematically related to the attributes of the visit (e.g., duration), they might potentially bias the estimates of any statistics produced from the geofence surveys.
Unfortunately, our design does not allow us to examine false negatives. Having a geoposition measurement at best every 30 minutes (see Bähr et al. (2020) for reasons why the intervals might have been longer), we are never able to verify whether a participant remained within the fence between two measurements. To be able to verify whether a participant remained within the fence between two measurements, we would need a higher frequency of geoposition measurements.
We can, however, approximately evaluate the false positives by comparing the geofence survey trigger via the Google Geofence API with our custom geolocation measurement. The Google Geofence API was programmed to trigger a survey after identifying that the participant dwelled for 25 minutes within the geofence and then exited the geofence.
Dwelling within the geofence means that the geolocation along with its location uncertainty is within the geofence. It is very unlikely that this condition was fulfilled if none of our geolocation measurements designed to be taken in 30 minute intervals lies within the geofence.
To compare the Google Geofence API and our custom function, we use an explorative approach by creating a figure for each triggered survey. Figure 3 shows how it looks in our data when the geofence triggered survey matches our custom function. The x-axis in Figure 3 shows the time of the day that the geofence triggered a survey. The y-axis shows the distance of the participant to the job center. Each point represents a geomeasure from our customized function, which was designed to collect a geoposition every 30 minutes. The dashed line is the 200 meter mark for the geofence and the triangular shaped marker represents the triggered survey.
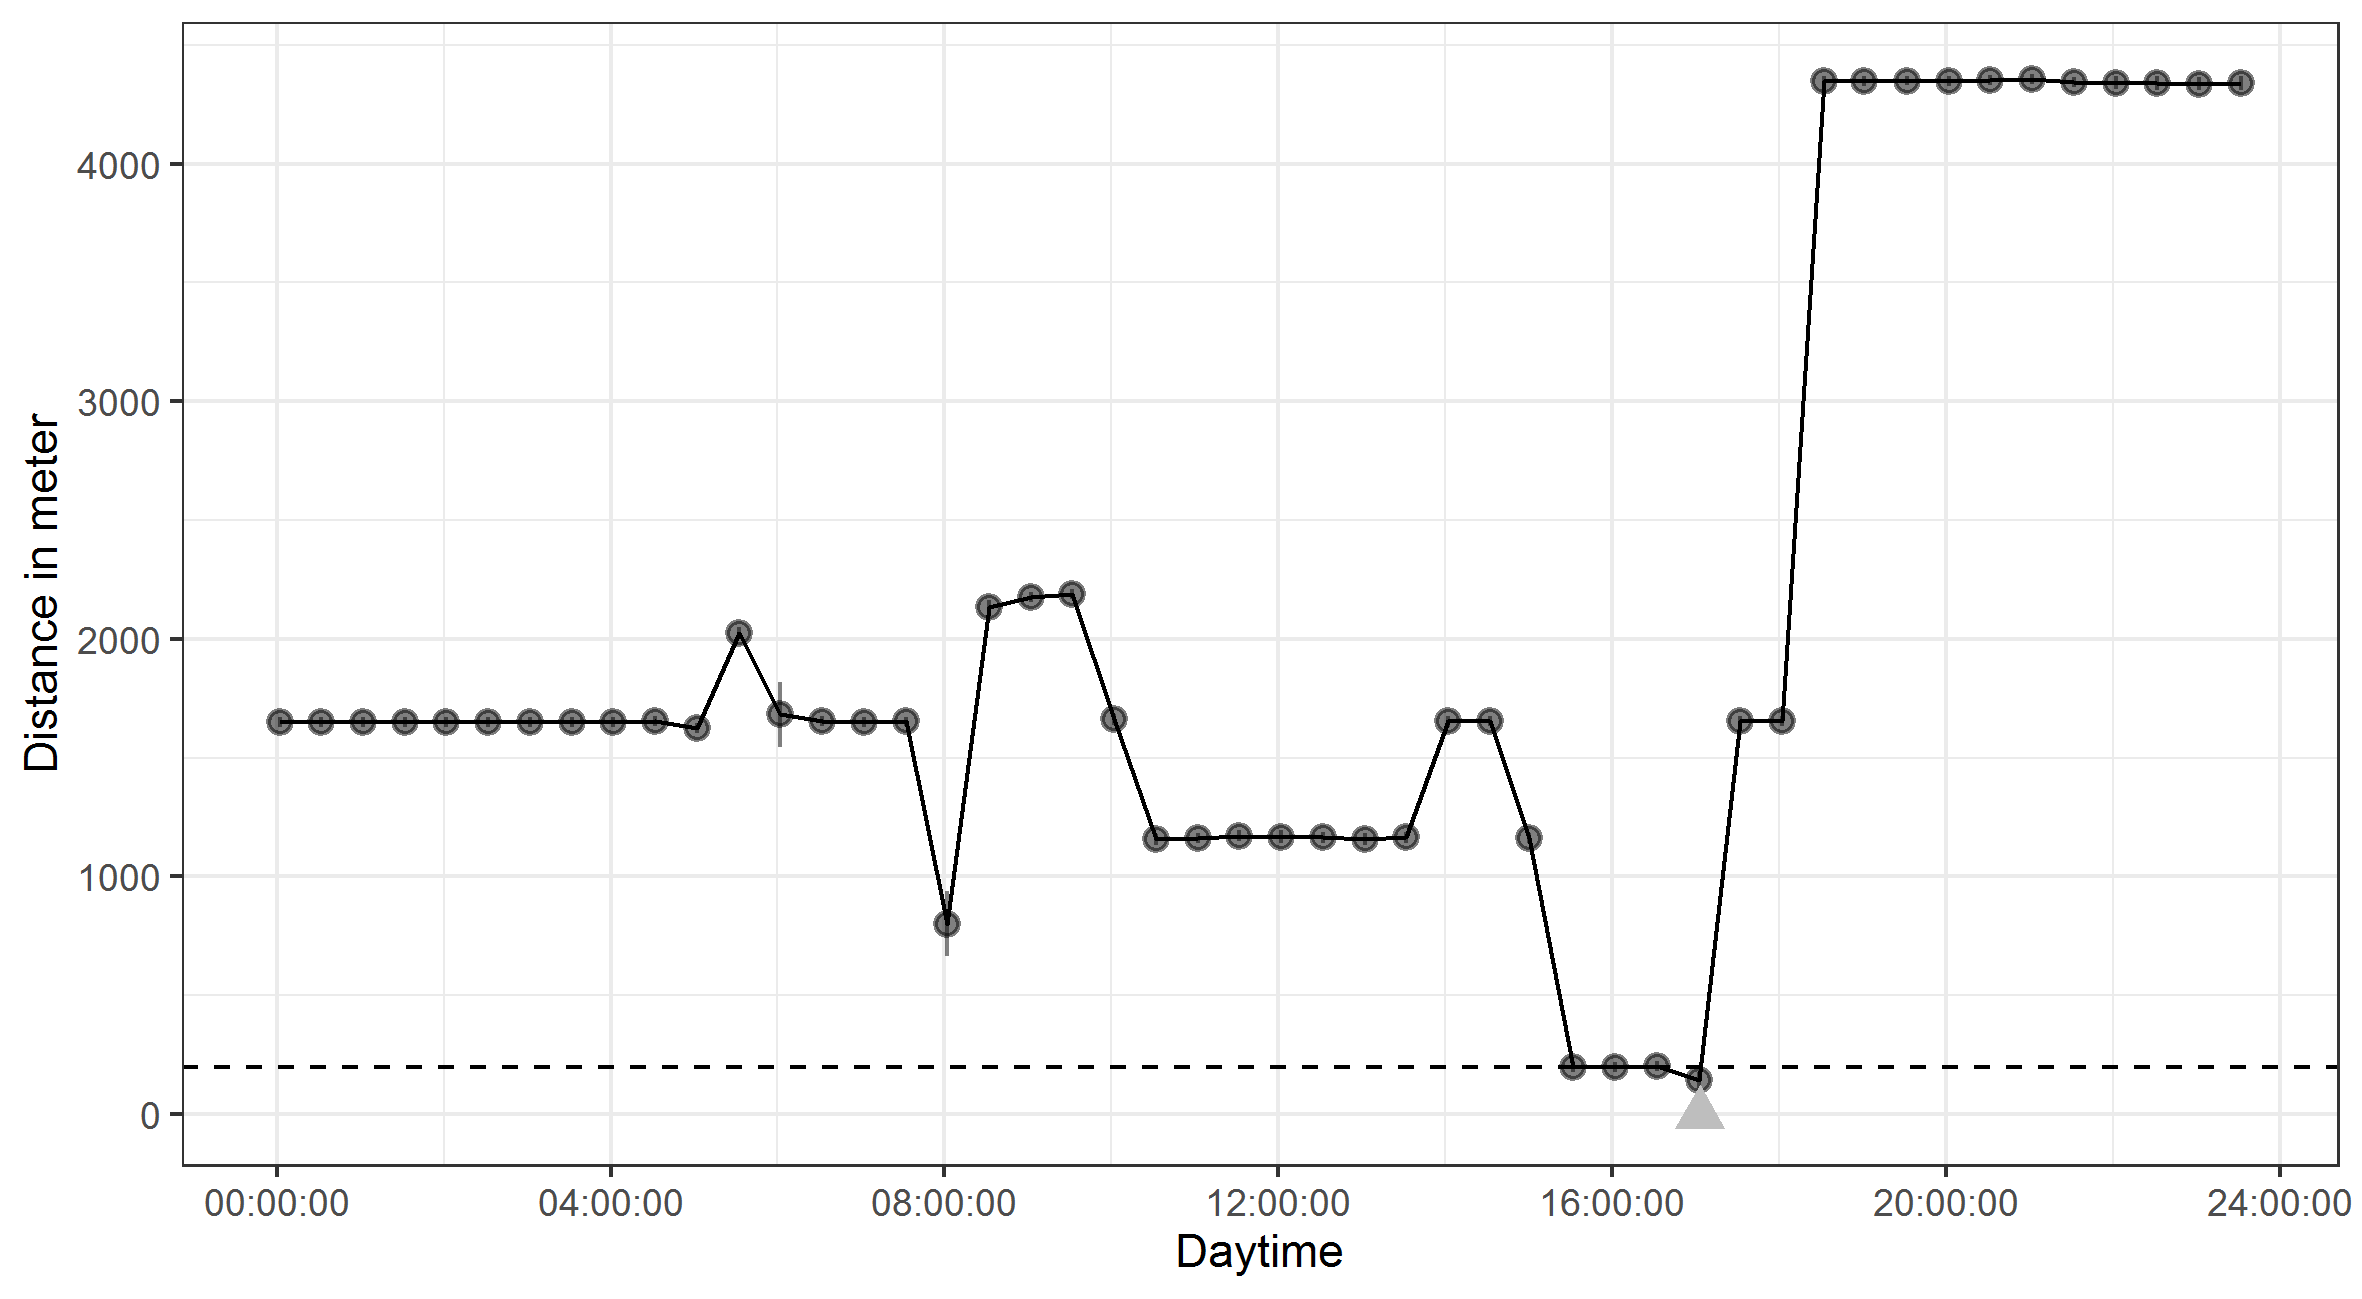
Figure 3: Example plot for the distances between the job center and the custom function geolocation measures on the day of the geofence triggered survey
During our explorative analysis, we find that in 121 out of 230 triggered surveys (52.6%) the Google API trigger matches our geolocation measure, similar to the example in Figure 3. In these cases, we are confident that the survey trigger using the geofence worked as intended. For the remaining 109 triggered surveys, we notice a pattern that deviates from that in Figure 3.
For 66 triggered surveys, we find that the location accuracy radius overlaps the area inside and outside of the geofence (i.e., participants could have been within the geofence or not). We assume that the geofence survey trigger also worked correctly for those cases but that the different measurement time points and possibly different accuracies between the Google Geofence API and our custom function lead to those mismatches.
We find 28 triggered surveys in which participants were not within the geofence prior to the survey trigger. We have no explanation for why this kind of mismatch appears.
For 15 triggered surveys, we do not have any geolocation measures from our custom function at least two hours prior to the time of the survey trigger. It may be possible that the Google API was able to collect geolocation data while our custom function was not. The lack of geomeasures from our custom function may be due to technical errors during the data transfer from the app to the backend or due to the Android operating system killing the data collection process (Bähr et al. in press). Since the Google Geofence API was able to collect data, the Android operating system might discriminate between the custom data collection functions from third parties, like our IAB-SMART app, and functions developed and implemented by Google.
In addition to examining if participants visited the geofence prior to a triggered survey, some patterns indicate that a participant may not have visited the geofence for a job center visit but for another purpose. Figure 4, for example, shows a participant near the geofence from 7 am to 5 pm, which may indicate that the person works somewhere near the job center, potentially even in the job center. It seems very unlikely but not impossible that this individual had a consulting meeting at the job center.
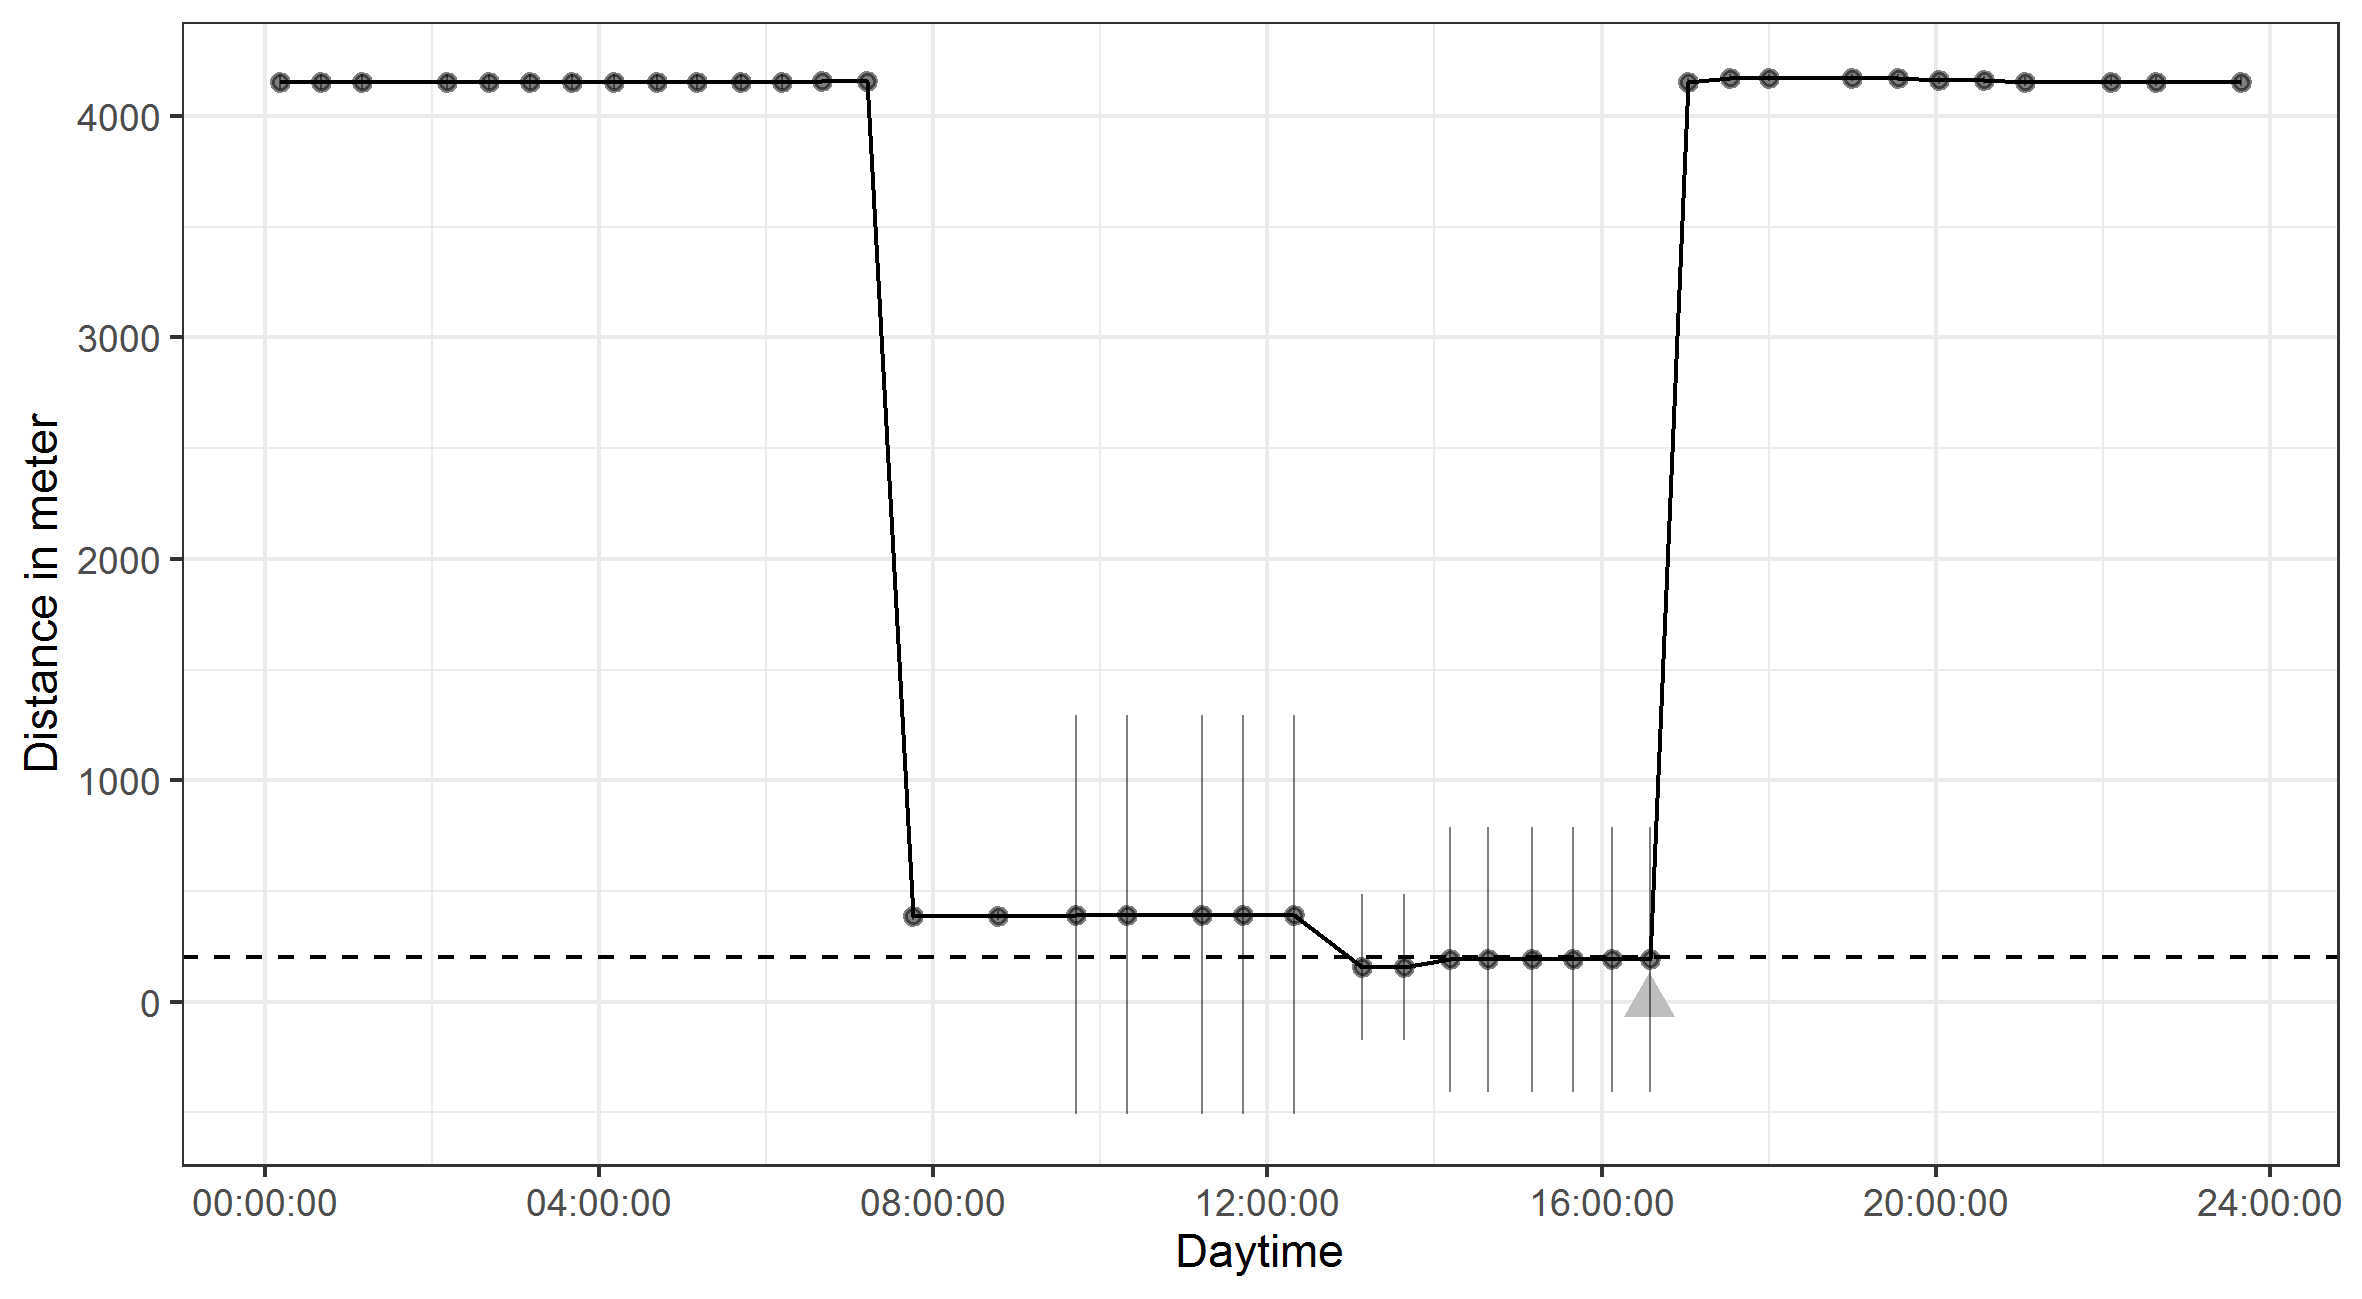
Figure 4: Example for distances between the job center and the custom function geolocation measures on the day of the geofence triggered survey
Conclusion – lessons learned
In this paper, we described a geofence feasibility study with 410 geofences corresponding to job centers in Germany. Ideally, if an IAB-SMART participant visited a geofence with their smartphone for at least 25 minutes, a survey about the visit was triggered. In retrospect, we have to concede that many decisions we made were not optimal with respect to the data quality and data collection costs. Most errors we made originated from having no literature available on prior studies utilizing this data collection technique. We derive a series of lessons learned from our study that researchers may consider when designing and implementing a geofence survey in the data collection process. While some of these recommendations build on the specifics of our study design, population of interest and research question about job center visits, they can inform researchers who plan to employ geofenced surveys in various contexts.
1. Collect information that indicates which geofence triggered a survey
When setting up the geofence surveys, we did not consider specifically instructing the programmers to save the information on which geofence triggered a survey. As a result, this exact information was lost, and we only know that one of the 410 geofences triggered a survey, but not which one. For an evaluation of how well the geofence surveys worked or to compare estimates between job centers, we needed to infer which geofence triggered a survey from a different, unrelated function in the app. Especially, studies that use more than one geofence should make sure to program the information on which geofence triggered a survey into their app.
2. Avoid overlapping geofences
If geofences overlap and an individual is within the overlapping space, a triggered survey cannot be reliably assigned to the geofence since one of four possible scenarios happens.
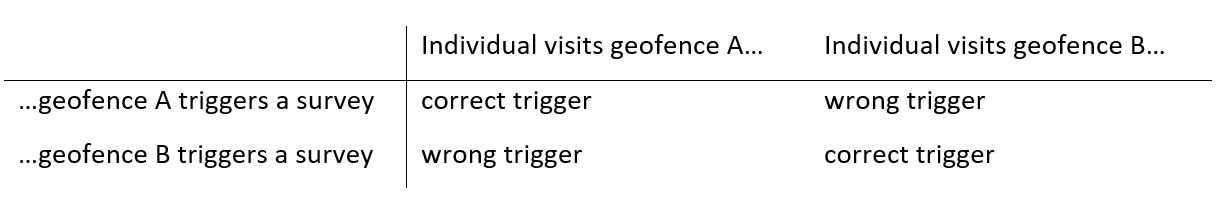
Therefore, researchers should avoid overlapping geofences by, for example, creating more precise geofences around the locations of interest, such as our job center, that include just a small buffer of a few meters instead of using a simple large radius of several hundred meters as we did. Such a more sophisticated approach would increase the time and effort needed when defining each geofence individually, but it would increase precision by avoiding overlaps and reducing the chance of a survey being triggered by a passersby, which might be especially problematic in densely frequented areas.
3. Consider the operation times of the locations in the geofence
As a result of not considering any operation times of the job centers, we find false triggered surveys in our data (i.e., triggered surveys on weekends and after business hours). Not considering operation times may not only increase the number of false triggered surveys but also the number of false reports. Even if the exact operation times are not known or they vary between geofences, it may be a good strategy to define broad operation times for all geofences to single out at least part of the false triggered surveys. Especially when the researchers are interested in locations that operate at certain hours only, geofences should be implemented with operation times to prevent false triggered surveys and reduce the amount of data cleaning required afterwards.
4. Consider the number of valid geofences per participant
In our design, each participant was able to trigger a survey for each geofence. In practice, however, each participant will only have one job center that is responsible for them. Therefore, we have participants who triggered a survey for a geofence of a job center that is not responsible for them. In cases where valid geofences differ between respondents, we therefore propose to link each participant to their valid geofence(s) (e.g., via the home address of the participant).
5. Availability of the survey invitation
As it is a major benefit of a geofence survey to collect real-time feedback, researchers should consider for how long a geofence survey should be available to participants. If an individual responds to a geofence survey after a day, survey questions may be out of context or the individual may have a harder time recalling events.
6. Validate the geofence visit and the event
We assumed that not every participant who visited the job center geofence was there for a consulting meeting. Therefore, we implemented a question in the geofence survey that asked if a consulting meeting took place or not. Participants who reported not being in the geofence for a consulting meeting were filtered out and did not receive the follow-up questions about the job center visit. From our design, we cannot validate whether a participant answering “no” to the validation question visited the job center at all or for a different purpose (i.e., we cannot distinguish between administrative visits to the job center and visits to other locations within the geofence). To distinguish between these cases, we should have implemented two validation questions: one that asks whether the participant was at the point of interest, and a second one that asks about the specific purpose of the visit (e.g., a consulting meeting). Researchers need to consider the context in which their study is conducted to determine what questions need to be asked to validate whether a survey is triggered in the appropriate context (i.e., at the right time, at the right location, and for the right person).
Use of geofences in future research
As noted earlier, the lessons learned from the implementation of geofences are informed by the scope of our IAB-SMART study, and not all recommendations might apply to all geofence surveys in other contexts. To broaden our understanding of when geofencing can be used as a valuable tool in survey research, we need more studies that implement the technology in the data collection process and validate the findings in different settings. Based on our experience, working with 410 geofenced job centers might have been too ambitious of a task. There still seem to be many technical and logistic problems pertaining to the accuracy of the geoposition measurement and the validation of locations to simultaneously implement several hundred geofences in one study. For example, while it is highly unlikely that a job center visit happened at 10 on a Saturday evening, our definition of opening hours between 7am and 7pm for all job centers might have been too imprecise. However, for studies with one or just a few precisely defined geofences, such as a stadium where the spectators of a sports event or concert visitors should be invited to an experience survey, this technology could be a very promising addition to the toolkit of survey designers.
Appendix
References
- Bähr, S., Haas, G.-C., Keusch, F., Kreuter, F., & Trappmann, M. (2020). Missing Data and Other Measurement Quality Issues in Mobile Geolocation Sensor Data. Social Science Computer Review. https://doi.org/10.1177/0894439320944118
- Bradburn, N. (1978). Respondent burden. Proceedings of the Survey Research Methods Section of the American Statistical Association, 35-40.
- Eckman, Stephanie; Kreuter, Frauke; Kirchner, Antje; Jäckle, Annette; Tourangeau, Roger; Presser, Stanley (2014): Assessing the mechanisms of misreporting to filter questions in surveys. In: Public Opinion Quarterly, Vol. 78, No. 3, S. 721-733.
- Grennwood, A. (2017). The Importance of Geofencing Market Research Surveys. [Blog Post]. Retrieved from https://blog.flexmr.net/the-importance-of-geofencing-market-research. Accessed: January 05, 2020.
- Haas, G.‐C., Kreuter, F., Keusch, F., Trappmann, M. and Bähr, S. (2020). Effects of Incentives in Smartphone Data Collection. In Big Data Meets Survey Science (eds C.A. Hill, P.P. Biemer, T.D. Buskirk, L. Japec, A. Kirchner, S. Kolenikov and L.E. Lyberg). doi:10.1002/9781118976357.ch13
- Keusch, F., Bähr, S., Haas, G.-C., Kreuter, F., & Trappmann, M. (2020a). Coverage error in data collection combining mobile surveys with passive measurement using apps: Data from a German national survey. Sociological Methods & Research. Published online before print April 7, 2020. DOI: 10.1177/0049124120914924
- Keusch, F., Bähr, S., Haas, G.-C., Kreuter, F., & Trappmann, M. (2020b). Participation rates and bias in a smartphone study collecting self-reports and passive mobile measurements using a research app. AAPOR 75th Annual Conference, Virtual Conference, June 11-12.
- Kreuter, F., Haas, G.-C., Keusch, F., Bähr, S., & Trappmann, M. (2018). Collecting Survey and Smartphone Sensor Data With an App: Opportunities and Challenges Around Privacy and Informed Consent. Social Science Computer Review. Published online before print December 18, 2018. DOI: 10.1177/0894439318816389
- Stone, A. A., & Shiffman, S. (1994). Ecological momentary assessment (EMA) in behavorial medicine. Annals of Behavioral Medicine, 16(3), 199–202. https://doi.org/10.1093/abm/16.3.199
- Trappmann, M., Bähr, S., Beste, J., Eberl, A., Frodermann, C., Gundert, S., Schwarz, S., Teichler, N., Unger, S. & Wenzig, C. (2019). Data Resource Profile: Panel Study Labour Market and Social Security (PASS). International Journal of Epidemiology, 2019, 1411–1411g.
- Trappmann, M., Müller, G., & Bethmann, A. (2013). Design of the study. In A. Bethmann, B. Fuchs, & A. Wurdack (Eds.), User guide “Panel Study Labour Market and Social Security” (PASS): Wave 6 (pp. 13–22). Retrieved from http://doku.iab.de/fdz/reporte/2013/DR_07-13.pdf
- Tourangeau, R., Rips, L.J., & Rasinski, K.A. (2000): The Psychology of Survey Response. Cambridge University Press.
- Wray, T. B., Pérez, A. E., Celio, M. A., Carr, D. J., Adia, A. C., & Monti, P. M. (2019). Exploring the Use of Smartphone Geofencing to Study Characteristics of Alcohol Drinking Locations in High-Risk Gay and Bisexual Men. Alcoholism, clinical and experimental research, 43(5), 900–906. https://doi.org/10.1111/acer.13991
-
Keywords
calibration CATI coverage coverage bias cross-national surveys data linkage data quality European Social Survey experiment face-to-face face-to-face survey Facebook hard to reach populations incentives item nonresponse measurement measurement error mixed-mode surveys multitasking non-probability samples Nonresponse nonresponse bias nonresponse rates paradata PIAAC Probability sample probability samples QR codes rare populations response rate Satisficing social desirability Social media survey survey-taking climate survey data survey management survey methods Telephone survey telephone surveys total survey error unit nonresponse validity web survey Web surveys weighting
