

Revisiting the ESS R8 sample a year after – Lessons from a re-contact survey to test patterns of unit non-response in Hungary
Research note
Szeitl, B. & Tóth, I. Gy. (2021). Revisiting the ESS R8 sample a year after – Lessons from a re-contact survey to test patterns of unit non-response in Hungary. Survey Methods: Insights from the Field. Retrieved from https://surveyinsights.org/?p=14864
© the authors 2021. This work is licensed under a Creative Commons Attribution 4.0 International License (CC BY 4.0) 
Abstract
The phenomenon of declining response rates is a major challenge for empirical social research. Should the loss of response units be non-random, population estimates may become biased. A rising share of the “unreachable” may lead to an increased probability of non-randomness of the loss. Exploring the process is therefore crucial to understanding what can be expected of our achieved samples. In a recent study, we investigated patterns of response unit loss by conducting a lagged recontact survey based on the European Social Survey (ESS) Round 8. We found that before one arrives at a premature verdict of unreachability, it is worth trying again: the combined reach of the original and the recontact surveys rose to over 63.6%, from the initial 41.1%. The proportion of total ineligibles in the two surveys was 6.5% (compared to 10.7% in the ESS), and the rate of stable non-responders (i.e. those who refused to answer in both surveys) was only 11.3% (29.7% in the ESS). The joint profile of the original and the recontact sample may be more balanced in terms of the representativeness of what we believe to be the “reality”. Regarding the explanatory factors of successful interviews, the research shows that several factors “pull” the sample of successful interviews toward the centre, compared to the gross sample: the chances of a successful interview are worse if the neighbourhood is run down, among those with a lower level of education and among those in higher income categories.
Keywords
European Social Survey, Survey methodology, unit nonresponse
Acknowledgement
This work was sponsored as basic research by the NKFIH OTKA grant, project number K125162. The authors are grateful to the anonymous reviewers at SMIF for their thorough reading and very insightful comments on the first version of this article.
Copyright
© the authors 2021. This work is licensed under a Creative Commons Attribution 4.0 International License (CC BY 4.0)
1. Introduction and research questions
Unit non-response – when a household/individual in a sample is not interviewed at all – has been rising worldwide in most surveys. Unit non-response generally arises from non-contact (the household/individual cannot be reached), from refusal (the household/individual is reached, but refuses to participate in the survey) or from incapacity to answer (the household/individual would participate, but cannot – for example, because of health problems) (Osier, 2016). Unit non-response only leads to bias if it is non-random. But if non-response relates to the variables under investigation, then the survey distributions will not accurately reflect the true distribution of the variables of interest in the population, and this results in systematically biased sample-based inferences, even in large samples (Korinek et al., 2007). However, it can be difficult to explore whether unit non-response is random or is dependent on any variables under investigation, as only limited information is available on the characteristics of non-respondents. Even if non-respondents are similar to respondents in terms of a limited number of characteristics – gender, age and geography – that does not mean that these groups are similar along other dimensions, such as attitudes, trust or beliefs (Meyer et al., 2015).
The social background of unit non-response has attracted great research interest (Goyder et al., 2002). The most commonly used hypotheses are linked to the theory of general and social trust and to the theory of social integration (Amaya and Presser, 2016). Other studies have examined basic proxies for a more complex background (Abraham et al., 2006). Another reason for non-response could be “inability”: some people are mentally or physically unable to participate, while others may be left out for reasons of language. In ageing societies and countries (and also in societies and countries with increasing levels of immigration), these reasons for non-response may become more important (Vandenplas et al., 2018). Several analyses have identified response characteristics within population subgroups; however, further research is needed on how to identify stable and universal non-response patterns and on response probability estimates. Research has found that single-person households, tenants and individuals who are out of the labour force are less likely to participate in surveys than are other social groups (Abraham et al., 2006; Meyer et al., 2015). Social changes, such as shifts in the work/life balance, falling trust in surveys or an increased survey burden, may also affect individual response propensities (Vandenplas et al., 2018).
Given that unit non-response often seems to be non-random, it may lead to bias (termed “non-response error”). There are two ways of reducing non-response error: the first is by conducting interviews with as many individuals in the sample as possible and then analysing the interview data to detect whether those individuals who have chosen to respond are somehow different from the entire population (Klofstad, 2005). This is a good (albeit expensive) way of increasing the response rate in a survey, though analysing non-responders is more complex. The nature of the bias is most often measured by comparing the data collected with administrative sources, in order to determine key deviations from population parameters (Klofstad, 2005). Often, the administrative data are difficult to access and outdated, and the scope for combining parameters (e.g. age and schooling) is limited. The only other solution is the second way: by collecting data from non-responders, though this actually sounds like a contradiction in itself. However, although there is a group of people in the population that can never be reached, there is another group whose inaccessibility is only temporary – and with special methodological research, we can find out more about them.
The extent of the problem in the field is pressing. Unit non-response rates rose by some 3–12 percentage points over the 1990s for six US Census Bureau surveys, and by 2013 the rates had reached almost 35% (Meyer et al., 2015). Non-response rates and the rates of non-contact have risen over the past 20 years in Hungary as well: in 1996, 16% of the households selected refused to answer an optional survey block during the microcensus (Havasi, 1997); by 2016, a survey conducted by the Hungarian Central Statistical Office experienced a response rate of just 59% (with a 3% rate of non-contact) (European Central Bank, 2016). In one of our own previous survey results in 2015, 40% of the households selected refused to answer, while 2% of the addresses selected were ineligible (Tárki, 2016). Since this is a problem that primarily occurs in the field, stepping up fieldwork efforts would seem to be a promising strategy. Previous research has found that these efforts do have an effect on non-contact rates, but they are less effective at reducing refusal rates (Vandenplas et al., 2018). In longitudinal surveys, occasional methodological changes have coincided with changes in the contact rates: some of these changes – such as the provision of incentives – may have been effective; however, increases in the response rate thanks to incentives are almost always temporary and are often followed by a sharp decline (Williams and Brick, 2018). Therefore, fieldwork characteristics, methodological changes and the characteristics of the interviewer may all play an important role in any analysis of non-response patterns.
This paper presents findings from a methodological study of survey non-response, based on a European Social Survey (ESS) sample (Round 8, fielded originally between May and September 2017). We recontacted a random selection of the original sample after roughly a year and a half (between December 2018 and February 2019), with the aim of finding out how far the original reach could be extended by a second attempt, and how previously unsuccessful cases (no-contact and refusals) can be characterized on the basis of their second responses (if available).[i]
We seek to answers to the following research questions:
Q1: How can the two surveys and the joint sample be characterized regarding outcome rates? What is the scale of non-response in the two samples and to what extent can non-response and no-contact be considered stable in the joint sample?
Q2: What factors affect success in contacting those respondents who were unreachable (refusal or no-contact) during the first fieldwork (ESS R8 sample)? Does reach depend on the characteristics of the locality and neighbourhood? On the characteristics and operation of the fieldwork apparatus? Or does it depend on the demographic characteristics of the target individuals?
Q3What factors affect interview response (once contact is made)? Which of the three broad categories of potential drivers (i.e. variables related to locality and neighbourhood; fieldwork characteristics (including the characteristics of interviewers, such as gender, age and level of education); and the demographic characteristics of target persons) is most important in determining interview success?
The remainder of the paper is organized as follows: first, we briefly introduce the basis of the analysis in chapter 2.1 (Round 8 of the European Social Survey) and chapter 2.2 (the recontact fieldwork). In chapter 2.3 we introduce the definitions and terminology used and present the analysis methods. Chapter 3 reports our findings. Chapter 3.1 presents the rates of response, non-response and contact in both surveys; this is followed in chapter 3.2 by a short presentation of the distribution of the responses to some target questions that were part of both questionnaires. Chapter 3.3 then presents the results of multivariate analysis for the determinants of contact, refusal and success rates. Finally, we summarize our conclusions (chapter 4).
[i] Details of the survey are available in the original Hungarian report (Szeitl and Tóth, 2020) and data from the survey have been deposited in the openly accessible Tárki Social Science Data Archive (https://adatbank.tarki.hu/en/).
2. Data and methods
2.1 Round 8 of ESS in Hungary
For Round 8 of the ESS, a stratified sample of individuals was drawn from the Hungarian population register. ESS targets all persons aged 15 and over: no upper age limit is set for the responders, and nor are there other restrictions on eligibility (e.g. based on ethnicity, locality, etc.). The only exception is that people living in institutions are excluded. Hence, the aim was to achieve equal coverage of all residents within private households in Hungary. As the ESS R8 quality matrix states (Wuyts-Loosveldt, 2019: 20, Table 2.8), the sampling frame (purchased from the Hungarian population registry) was somewhat outdated, compared to other participating countries: 8.5% of the gross sample (of 4,006 cases) had moved by the time of first contact. That figure is relatively high: of the 13 countries using similar population registers of individuals for sampling, it is only exceeded by Poland (14.7%) and Spain (11.1%).
For the selection of the field unit, a multistage cluster design was applied in the domain that represented rural areas (mostly villages), while an unclustered design was employed in a second domain representing urban centres with high population density (see the quality matrix, as above). The realized gross sample was 3,954 individuals; the realized net sample size was 1,625; and the realized effective net sample size was 1,330. The fieldwork lasted from May to December 2017. Round 8 of the ESS in Hungary involved a computer-assisted personal interview (CAPI) survey. During the data collection, ESS standards were followed.[i]
2.2 The recontact sample
The aim of the recontact sample was to investigate how non-responders and ineligible households could be characterized. For reasons of cost, a randomly generated subsample of 3,000 addresses from the original ESS R8 gross sample of 4,006 was recontacted, irrespective of their availability and previous interview take-ups. The fieldwork lasted from December 2018 to February 2019.[ii] The fieldwork protocols of the ESS[iii] were closely followed during the recontact survey, too. All the original fieldwork conditions and standards regarding data collection were applied: addresses were randomly distributed across the same group of interviewers as during the initial fieldwork. For the selection of the recontact sample, we conducted simple random sampling. This approach was chosen to produce an additional random sample, and also to provide an opportunity to specify different types of non-responder (participants in both surveys; only in the ESS; only in the recontact survey). The wording of the questions remained exactly the same, but a shortened version of the original questionnaire was used, with some specific additions related to the recontact methodology. In the recontact survey (just as in the baseline one), a very detailed record of contact attempts was made, including data on the circumstances of the attempts, the characteristics of the neighbourhoods, etc. Later, administrative data on settlements were added to the respondents’ records; and, in addition to the questionnaire files, the demographic and work experience characteristics of the interviewers were added and analysed.
2.3 Some definitions and terminology used
In what follows, for the sake of simplicity, we call the ESS R8 sample ESS and the follow-up survey RECONTACT. In this section, we describe general outcome rates calculated from the final disposition codes in both surveys and in the joint sample. Outcome rates are outlined, based on the official definitions of the American Association for Public Opinion Research (AAPOR, 2016). We use the following final disposition codes:
I = Complete interview
P = Partial interview
R = Refusal and break-off
NC = Non-contact
O = Other
UH = Unknown whether household/occupied
UO = Unknown, other
We define the response rate as the number of successful interviews, divided by the number of eligible units in the sample (AAPOR, 2016):
Response Rate (RR1)=
(1) 
We define the refusal rate as the proportion of all cases in which a housing unit or respondent refuses to give an interview/to comply (AAPOR, 2016):
Refusal Rate (REF1)=
(2) 
We define the no-contact rate based on the AAPOR definition of contact rates (CON1): the no-contact rate is the proportion of all cases in which no responsible member of the housing unit could be reached by the interviewer:
No-contact Rate (NOCON1)=
(3) 
To answer Q1, one- and two-dimensional tables are presented. For Q2, distributions of respondents and non-respondents in ESS are compared. For Q3, logit analysis with specified subsamples is used.
3. Results
The response rate (i.e. the rate of successful interviews within the gross sample) was higher in the RECONTACT survey (48%), than in the original ESS (41%). All in all, the no-contact rate fell from 11% to 5% in the second survey. The share in other categories remained roughly the same (Table 1).
Table 1 Results in the ESS and the RECONTACT sample
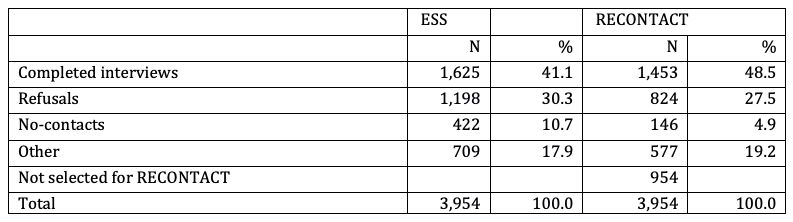
Source: ESS and RECONTACT survey.
The percentages for various success/non-response combinations are shown in Table 2 for the combined ESS/RECONTACT sample. Numbers in brackets refer to the internal distribution of all cases, net of those not included in the RECONTACT sample. When taking the total of the two surveys combined, we see that still in over a third of cases (36.4% – 1,091 individuals) where an attempt at contact was made, that attempt failed (Table 2, upper-left cell, figure in brackets); meanwhile, in rather more than a quarter of cases (25.7% – 772 individuals), a person was available for both surveys (Table 2). Over the two surveys, there were 461 cases (15.4%) where only the ESS questionnaire was filled in, and 676 cases (22.5%) where only the RECONTACT questionnaire was completed.[iv] The combined reach of the two surveys rose to 63.6% (Table 2, the sum of cells showing success in either survey, 63.6=22.5+15.4+25.7) from the initial 41.1% response rate of Round 8 of the ESS (Table 1).
Table 2 Distribution of all contact attempts, % (in brackets: % distribution of the joint ESS–RECONTACT sample)
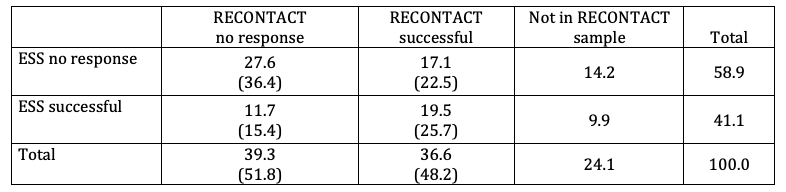
Note: Percentages (not in brackets) are inclusive for all attempts (included are those not selected for the RECONTACT sample), percentages in brackets are inclusive only for the joint sample (selected for the RECONTACT sample).
Source: ESS and RECONTACT survey, N of joint sample=3,954.
3.2 Sample distributions of some core variables of the survey
As we show, the RECONTACT survey was able to bring in a group of previous ESS non-responders. Here we compare the sample distributions of their answers to those of the answers of the original ESS respondents for four variables. Two of these are subjective target variables of the ESS (generalized trust and satisfaction with their own lives), while the other two serve to indicate sample composition by education and working hours in employment (Figure 1). Some caution in interpretation is warranted, but nevertheless these preliminary results do perhaps provide a sufficient basis for more detailed further research, despite the small number of cases.
In general, the recontacted sample seems to show a somewhat wider distribution of these test variables.
- In the case of generalized trust,[v] the distribution of non-responders’ answers is wider and the proportion of extreme answers is higher than in the case of responders.
- For general life satisfaction,[vi] ESS non-responders were slightly more satisfied than responders, though the difference was not significant.
- Among previous non-responders (i.e. among those who were successfully interviewed only in RECONTACT), the proportion of highly educated[vii] individuals was higher; in terms of working hours,[viii] non-responders seem to have been less concentrated among those following the most typical working schedule (approx. 40 working hours per week).
Figure 1 Distributions of responders and non-responders by generalized trust and satisfaction categories, education level and number of working hours
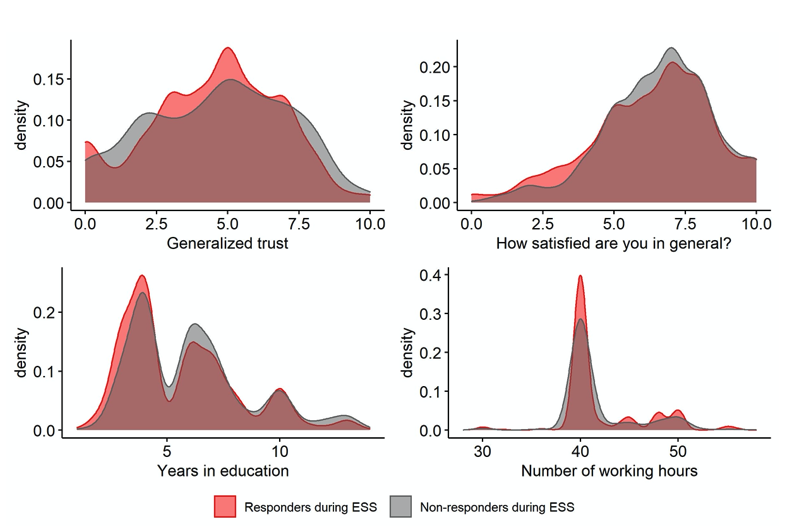
Note: Based on the results of the Kolmogorov–Smirnov tests for homogeneity, the variables have the same distributions in both surveys. P-values= 0.129 (generalized trust); 0.103 (satisfaction); 0.001 (education); 0.000 (working hours). Kolmogorov–Smirnov test statistics: 0.055 (generalized trust); 0.058 (satisfaction); 0.09 (education); 0.17 (working hours).
Source: ESS, N(responders during ESS)=1,032 to 1,228; N(non-responders during ESS)=445 to 676.
3.3 Factors affecting no-contact, refusal and response rates
We considered three factors that could contribute to interview success and to maximizing the number of completed questionnaires. The first is related to locality and neighbourhood where the interview was supposed to take place. From potential candidates for neighbourhood variables, we chose three: size of the settlement; level of economic development (measured by the average income of households) in the settlement; and physical characteristics (cleanliness, street and house conditions, etc.) of the neighbourhood. The first two variables were imputed to the data file from official statistics, while the third came from the interviewers’ assessments (recorded for each and every targeted address, together with several other features of the address and number of contact attempts). Please note that for community wealth, we treat Budapest as a separate category, whereas for population size we keep Budapest in the category of all cities with more than 50,000 inhabitants. The reason for this decision is partly methodological: entering two different explanatory variables with exactly the same subcategories (Budapest as the largest city and Budapest as the richest city) would have confused the estimates. However, the decision is also justified for theoretical reasons: Budapest is undoubtedly the richest part of Hungary (defining the context for all Budapest citizens, regardless of the internal distribution of household wealth in the city). Settlement size, however, is intended to denote urbanization and frequency of social interaction in the living environments. Therefore, we may reasonably assume that this contextual effect is similar in all Hungarian cities with over 50,000 inhabitants. The second set of variables relates to the qualities of the fieldwork apparatus (gender, age and education level of the interviewers, as well as the stability of the interviewer across the two surveys – i.e. whether the same interviewer visits the same household). Finally, the third factor relates to characteristics of the (potential) responders: gender, age, education, plus income categories and their subjective evaluation of getting by in material terms. Variables for this third group were derived from the successful interviews (either from the first survey or from the second).
Multinomial logit regressions were applied to explain the determinants of no-contact, of refusal and of successful interviews. We present our results for each of these explanatory factors.
The results for the determinants of contact success (i.e. finding the target person) are presented in Tables 3 and 4. To summarize, for chances of no-contact (Table 3) the characteristics of locality and neighbourhood matter: by category of settlement wealth, no-contact is significantly lower in the capital city, Budapest, than in settlements with a medium level of development. The physical state of the living environment (judged by the interviewer) has an important effect on the probability of not being able to contact a given address: where the interviewer assesses the environment as “poor or very poor”, it is significantly more likely that nobody will be reached.
Table 3 Probability of no-contact and its explanatory factors in the ESS Hungarian survey and in the RECONTACT survey (logit models, reference categories in brackets)

Note: Level of significance *p<0.1; **p<0.05; ***p<0.001. General information on all variables involved in the models can be found in Table A1 in the Appendix. HUF means Hungarian forints, the Hungarian national currency. +: We use annual tax capacity data – a figure that is calculated to measure the eligibility of municipalities for various government redistribution schemes. The local commerce tax serves as a basis for this calculation. The relative levels proxy the relative wealth of municipalities.
Source: ESS and RECONTACT surveys, N(ESS)=3,954; N(RECONTACT)=3,000.
Rates of no-contact – as expected – vary by interviewer and by instructor (the local manager of an interviewer). In a multivariate context, inclusion of the above two variables representing fieldwork quality increases the strength of our models (as measured by the pseudo R-squares of our logit models) (Table 4).[ix] We analyse further details of the effects of interviewer and instructor heterogeneity in the next parts.
Table 4 Effect of fieldwork characteristics on probability of no-contact in the ESS Hungarian survey and in the RECONTACT survey, based on model A (settlement characteristics) and B (settlement characteristics and fieldwork characteristics)
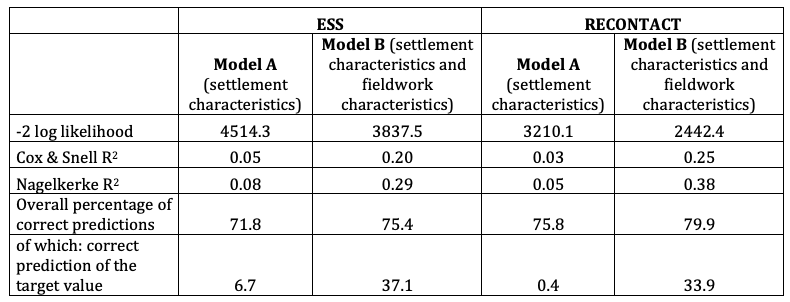
Source: ESS and RECONTACT surveys, N(ESS)=3,954; N(RECONTACT)=3,000.
To identify the characteristics of refusals, we continue with three models, with the gradual introduction of the variables of the three groups of factors that are of relevance: the settlement variables; the variables representing the quality of the apparatus; and the variables characterizing the socio-economic standing of respondents. The results are shown separately for the two blocks of the left-hand variables first, followed by a presentation of the full models for these three blocks.
Respondents’ socio-demographic characteristics seem to matter – but not as strongly as might be imagined. The chances of a refusal are slightly smaller among the youngest age groups, and are higher among higher-income groups (Table 5). When it comes to a subjective evaluation of their personal income situation, those who report material difficulties tend to refuse to cooperate more often than do those who are comfortable with their income level. Somewhat surprisingly, refusals and no-contact rates are lower at higher levels of education. An urban/rural gradient is also in evidence: refusals decline and reach increases as we move from richer to poorer settlements.[x] Interviewer characteristics also matter: prime-age interviewers (those born between 1952 and 1972) seem to perform better than those in the younger cohort (born between 1973 and 1987). Also, interviewers with tertiary education encounter significantly fewer refusals than those with at most primary education.
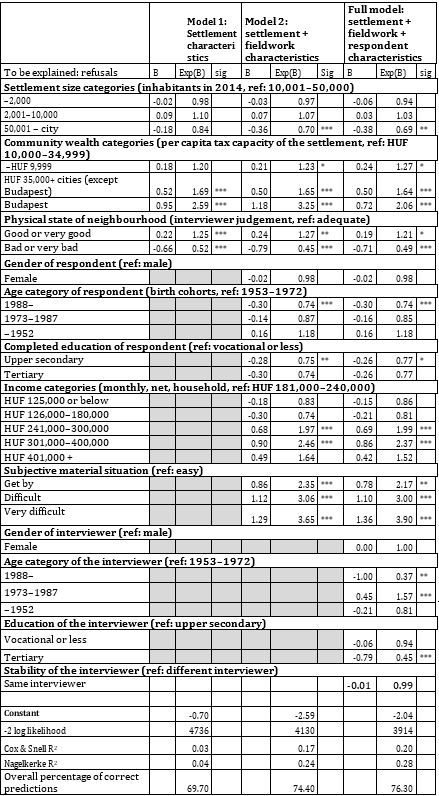
Note: Level of significance *p<0.1; **p<0.05; ***<0.001. General information on all variables involved in the models can be found in Table A1 in the Appendix.
Source: ESS, N=3,954.
As for the explanatory factors of successful interviews, one may consult Table 6 (results on ESS, to be explained: successful interviews). Affluence seems to matter. The probability of a successful interview is significantly higher in Budapest than in cities in the reference category (those settlements where per capita wealth is second from bottom – see the odds ratio of 2.46 in the relevant category). We might also assume that in this respect, Budapest, the capital, “behaves” differently from other large cities (with over 50,000 inhabitants), given that the odds ratios for the latter group are significantly lower. This finding is confirmed by simple comparisons of success rates between Budapest and the other settlements of at least 50,000 inhabitants. The state of the living environment has a significant (negative) effect when neighbourhood quality is assessed as “bad or very bad” by the interviewer. The level of education of the interviewer seems to play a significant role: those with tertiary education have a better chance of conducting a successful interview. Neither the gender nor the age of the interviewer seems to have an effect in this model. The chances of a successful interview are worse among the higher-income categories (over HUF 241,000 per month). This, together with the lower chances of an interview in “bad or very bad” areas, suggests there is a risk that certain factors “pull” the realized sample by social status and affluence toward the centre. This combines with the fact that the more frustrated (i.e. subjectively dissatisfied) respondents are with their material situation, then – all things being equal – the less willing they are to respond (see Table 5), which further aggravates the problem of the “pull-to-centre” tendency.
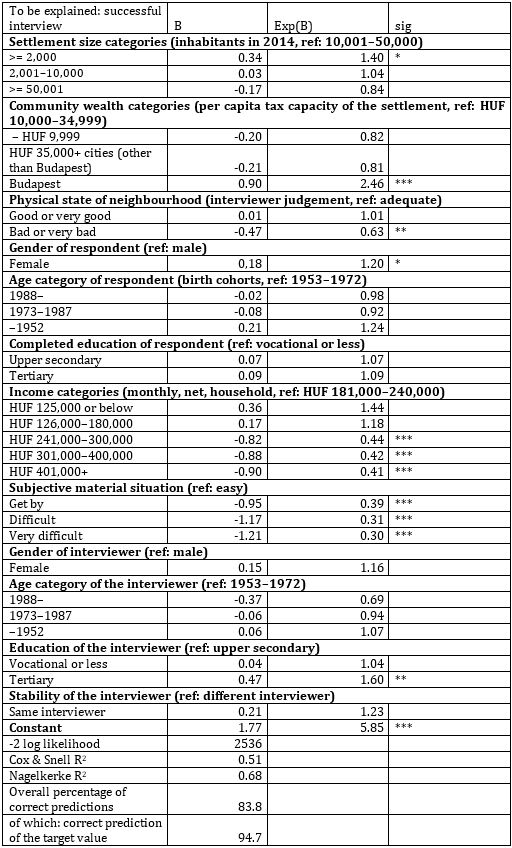
Note: Successful interviews are defined as completed interviews (partially completed or abandoned interviews are considered unsuccessful interviews). Level of significance: *p<0.1; **p<0.05; ***<0.001. General information on all variables included in the models can be found in Table A1 in the Appendix.
Source: ESS, N=3,954.
When it comes to the allocation of the interviewers, the variable for interviewer stability is not significant. However, in our more detailed analysis (see Szeitl and Tóth, 2020) we found that allocating the same address to the same interviewer reinforces the results (the same interviewer at the same address tends to replicate success and failure in the two surveys, too). However, reallocating an unsuccessful address to a different interviewer in the RECONTACT survey raises the chances of a successful interview. We also found that the skills (education) and training/experience of interviewers had a positive effect on interviewer efficiency (Szeitl and Tóth, 2020).
4. Conclusion/Discussion
We presented our findings from a methodological investigation into survey non-response, based on the European Social Survey sample in Hungary. The research was based on a recontacted sample, and we were able to draw conclusions regarding key methodological issues. Our research questions sought (Q1) to characterize the samples regarding outcome rates, (Q2) to determine the factors affecting success in reaching those who had previously been unreachable, and (Q3) to determine the factors affecting successful interviews.
We found that the outcome rates were roughly the same in the recontact sample as they had been in the ESS sample. The share of cases that turned out to be “hopeless” was much lower in the combined sample than it seemed to be in the initial, Round 8 of the ESS alone. The second-round contact rate for those deemed to have been unavailable in the first round was shown to be in the same range (38.3%) as for the full sample of the first round (41.1%). Hence, the analysis shows that significantly better reach (higher contact and higher response rates) could be achieved in the gross sample when the joint dataset was taken as a base. This finding draws attention to the reach-enhancing potential of revisiting initial non-respondents within the framework of any particular survey.
Among the factors affecting non-response, a person’s socio-demographic characteristics do seem to matter, though not as strongly as we expected from previous research (Abraham et al., 2006; Meyer et al., 2015). The chances of a refusal are higher among higher-income groups, and also among those reporting material difficulties.
Our study also reinforces earlier studies (and ESS recommendations) arguing that the careful selection and training of the fieldwork staff is of key importance. Better-educated, better-skilled and more-experienced staff have better results in reaching potential respondents. The standardization of operational protocols across the various fieldwork teams led by different instructors also matters in the process of making fieldwork more efficient. Our results related to fieldwork characteristics suggest that collecting data on interviewers (education, experience, attitude) is highly recommended. This would provide an opportunity to investigate more closely the fieldwork effects on unit non-response (or on other fieldwork efficiency parameters) after a specific survey round. Although it slows down data collection in the field, monitoring variations in the refusal rates of different interviewers during fieldwork and reallocating interviewers to different addresses may improve field efficiency. Obviously, this should all be considered in light of the given field and organizational opportunities.
Regarding the differences in the distribution of certain core variables in the questionnaire between responders and non-responders, the initial findings are consistent with previous results (Meyer et al., 2015). Recontacting people who had either previously refused an interview or who could not be contacted can result in a wider distribution of answers, with more responses from those with a higher level of education and from people whose working time routine deviated from the standard 40 hours a week.
We consider that face-to-face interviews (for specific research questions) remain important, however much administrative data there is, and whatever the volume of the various kinds of Big Data. Face-to-face contact surveys also have their place assured in a world of mixed mode surveys. Therefore, understanding non-response and tackling the problems it may cause for the accuracy of population estimates will continue to be of key importance for social research in the foreseeable future. Having said all that, we believe that our findings on the determinants and effects of non-response may be useful for empirical social scientists who wish to improve the efficiency of data-collection strategies.
Appendix
[i] Further details can be found in the relevant parts of the ESS webpage https://www.europeansocialsurvey.org/data/country.html?c=hungary
[ii] For more on the fieldwork characteristics of the RECONTACT survey, see Section 3 in Szeitl and Tóth (2020).
[iii] The fieldwork protocols for Round 8 can be found at: https://www.europeansocialsurvey.org/docs/round8/survey/ESS8_data_documentation_report_e02_2.pdf
[iv] The initial random selection of the 3,000 cases turned out to be somewhat biased towards the originally unsuccessful cases. We finally ended up with 392 cases not questioned in RECONTACT, though questioned in ESS, and 562 cases uncontacted in either survey. Please note that just because no interview occurred, that does not mean there was no information about the (non-)respondent. We had the age, gender and address of each person from the registry, and interviewers were asked to record information on the characteristics of the neighbourhood.
[v] Standard question on trust: position on a scale from 0 (no trust in others) to 10 (full trust in others).
[vi] “To what extent are you satisfied with your life in general?” (on a scale of 0 to 10).
[vii] Measured by the total number of years of education.
[viii] Standard question on average working hours per week.
[ix] We use annual tax capacity data – a figure that is calculated to measure the eligibility of municipalities for various government redistribution schemes. The local commerce tax serves as a basis for this calculation. The relative levels proxy the relative wealth of municipalities.
[x] For a better understanding of the mechanisms, further – qualitative – analysis is needed.
[xi] To further investigate readiness to cooperate, we also designed a specific block of questions to find out personal motivations for decisions about whether to cooperate in surveys (i.e. we also tried to investigate the effect of the general social climate surrounding opinion polls and research). Multivariate models show that trust in opinion polls in general (which is, of course, part of a general attitude climate) is positively related to readiness to cooperate in such polls (Szeitl and Tóth, 2020).
References
- Abraham, K., Maitland, A. and Bianchi, S. (2006). Nonresponse in the American Time Use Survey: Who is missing from the data and how much does it matter? Public Opinion Quarterly 70(10), pp. 676–703. doi: 10.1093/poq/nfl037
- Amaya, A. and Presser, S. (2016). Nonresponse bias for univariate and multivariate estimates of social activities and roles, Public Opinion Quarterly 81(10), pp. 1–37. doi:10.1093/poq/nfw037
- American Association for Public Opinion Research (AAPOR) (2016). Standard Definitions: Final Dispositions of case codes and outcome rates for surveys, 9th edition. AAPOR. https://www.aapor.org/AAPOR_Main/media/publications/Standard-Definitions20169theditionfinal.pdf European Central Bank (2016). The Household Finance and Consumption Survey: Methodological report for the second wave, ECB Statistics Paper Series No. 17. https://www.ecb.europa.eu/pub/pdf/scpsps/ecbsp17.en.pdf?1ec7c85bc7ace1c59117f664bdafeb08
- Goyder, J., Warriner, K. and Miller, S. (2002). Evaluating socio-economic status (SES) bias in survey nonresponse, Journal of Official Statistics 18(1), pp. 1–11.
- Havasi, É. (1997). Válaszmegtagadó háztartások, Statisztikai Szemle 75(10), pp. 831–843. http://www.ksh.hu/statszemle_archive/1997/1997_10/1997_10_831.pdf
- Klofstad, C.A. (2005). Interviews, in Kimberly Kempf-Leonard (ed.), Encyclopedia of Social Measurement. Elsevier Science Publishing Company Inc., pp. 359–365.
- Korinek, A., Mistiaen, J. and Ravallion, M. (2007). An econometric method of correcting for unit nonresponse bias in surveys. Journal of Econometrics 136(1), pp. 213–235.
- Meyer, B., Mok, W. and Sullivan, J. (2015). Household surveys in crisis, Journal of Economic Perspectives 29(11), pp. 199–226. doi:10.1257/jep.29.4.199
- Osier, G. (2016). Unit non-response in household wealth surveys, ECB Statistics Paper Series No. 15. https://www.ecb.europa.eu/pub/pdf/scpsps/ecbsp15.en.pdf
- Szeitl, B. and Tóth, I.Gy. (2020). Megközelíthetetlen csoportok elérése: hogyan lehet javítani a személyes megkeresésen alapuló empirikus adatfelvételek minőségén? A „Hogyan kezeljük a „nemválaszolók”-at? – Az empirikus kutatások során jellemzően válaszmegtagadó, vagy elérhetetlen csoportok pilot kutatása speciális felméréssel és módszerekkel” című K 125162 számú OTKA Kutatás záró beszámolója. [Reaching the unreachable: How to improve the quality of face-to-face surveys? “How to deal with ‘non-responders’? – Pilot methodological research into characterizing non-responders and no-contacts” Final report of the OTKA Research K 125162]. Budapest: Tárki (in Hungarian). https://tarki.hu/hogyan-kezeljuk-a-nemvalaszolokat-0
- Tárki (2016) „Makro sokkok – mikro válaszok: sikeres és sikertelen háztartási alkalmazkodás a válság idején Magyarországon – A Tárki Háztartás Monitor kutatás” – 1. kötet: A kutatás koncepciója, adatfelvételei és dokumentációja [“Macro shocks – micro responses: Successful and unsuccessful household adaptation strategies in times of crisis in Hungary – Tárki Household Monitor research” – Volume 1: Research concept, data collection and documentation] (in Hungarian). http://www.tarki.hu/hu/research/hm/2016/monitor2015_gyorsjelentes_1_kotet.pdf
- Vandenplas, C., Beullens, K., Loosveldt, G. and Stoop, I. (2018). Response Rates in the European Social Survey: Increasing, decreasing, or a matter of fieldwork efforts? Survey Methods: Insights from the Field. doi:10.13094/SMIF-2018-00003
- Williams, D. and Brick, J.M. (2018). Trends in US face-to-face household survey nonresponse and level of effort, Journal of Survey Statistics and Methodology, 6(2), pp. 186–211. http://doi.org/10.1093/jssam/smx019
- Wuyts, C. and Loosveldt, G. (2019). Quality matrix for the European Social Survey, Round 8: Overall fieldwork and data quality report. ESS ERIC Core Scientific Team, Leuven. http://www.europeansocialsurvey.org/docs/round8/methods/ESS8_quality_matrix.pdf
-
Keywords
calibration CATI coverage coverage bias cross-national surveys data linkage data quality European Social Survey experiment face-to-face face-to-face survey Facebook hard to reach populations incentives item nonresponse measurement measurement error mixed-mode surveys multitasking non-probability samples Nonresponse nonresponse bias nonresponse rates paradata PIAAC Probability sample probability samples QR codes rare populations response rate Satisficing social desirability Social media survey survey-taking climate survey data survey management survey methods Telephone survey telephone surveys total survey error unit nonresponse validity web survey Web surveys weighting
