

The most successful interviewers in income questions: A SHARE study
Cunha, C., Delerue Matos, A. & Voss, G. (2023). The most successful interviewers in income questions: a SHARE study. Survey Methods: Insights from the Field. Retrieved from https://surveyinsights.org/?p=16532
© the authors 2023. This work is licensed under a Creative Commons Attribution 4.0 International License (CC BY 4.0) 
Abstract
Item nonresponse is a significant concern since the power of survey data can be overridden if the information requested in a questionnaire is not provided. Interviewers are pinpointed as important in influencing the item nonresponse rates of studies. However, the literature is highly inconsistent regarding the interviewer characteristics responsible for this influence, and there is limited research focusing on the importance of interviewers’ attitudes and behaviours. This study, therefore, aims to understand which characteristics of the interviewers working for the Survey of Health Ageing and Retirement in Europe (SHARE) (wave 6) are associated with income nonresponse. Multilevel logistic regression models were used to assess the association between income nonresponse and the interviewers' sociodemographic characteristics, experience, attitudes, expectations and behaviour when asked about their income. Results show that income nonresponse is negatively associated with interviewer characteristics such as age, positive expectations and being less willing to report their income. These findings have implications for the recruitment, selection and training of interviewers.
Keywords
income nonresponse, Interviewers, item nonresponse, SHARE, survey quality
Acknowledgement
The authors are grateful for the funding awarded to SHARE-Portugal by the FCT/MCTES and Calouste Gulbenkian Foundation (SHARE-Portugal, 2013-2016) and by FCT/MCTES through National Funds (PIDDAC) and the European Regional Development Fund (ERDF) through the Operational Program PORNorte and PORLisboa, AACNº 01/SAICT/2016, Application nº022209 –DATALAB (SHARE-Portugal, from 2017 to the current date). The SHARE data collection has been funded by the European Commission, DG RTD through FP5 (QLK6-CT-2001-00360), FP6 (SHARE-I3: RII-CT-2006-062193, COMPARE: CIT5-CT-2005-028857, SHARELIFE: CIT4-CT-2006-028812), FP7 (SHARE-PREP: GA N°211909, SHARE-LEAP: GA N°227822, SHARE M4: GA N°261982, DASISH: GA N°283646) and Horizon 2020 (SHARE-DEV3: GA N°676536, SHARE-COHESION: GA N°870628, SERISS: GA N°654221, SSHOC: GA N°823782) and by DG Employment, Social Affairs & Inclusion through VS 2015/0195, VS 2016/0135, VS 2018/0285, VS 2019/0332, and VS 2020/0313. Additional funding from the German Ministry of Education and Research, the Max Planck Society for the Advancement of Science, the U.S. National Institute on Aging (U01_AG09740-13S2, P01_AG005842, P01_AG08291, P30_AG12815, R21_AG025169, Y1-AG-4553-01, IAG_BSR06-11, OGHA_04-064, HHSN271201300071C, RAG052527A) and from various national funding sources is gratefully acknowledged (see www.share-project.org).
Copyright
© the authors 2023. This work is licensed under a Creative Commons Attribution 4.0 International License (CC BY 4.0)
1. Introduction
Surveys can provide extremely rich data on several matters. Bethlehem, Cobben and Schouten (2011) stress that the economic, social, political and cultural statistics produced by these studies are often the backbone of many public policies implemented across countries. Thus, it is of the utmost importance for surveys to be endowed with quality. However, this quality is severely jeopardised by the lack of answers to questions within an interview, that is, item nonresponse (Bethlehem et al., 2011; De Leeuw et al., 2003; Tourangeau & Yan, 2007).
When presented with the interview questions, the respondents can either provide an answer or not give any information. A research synthesis developed by West and Blom (2017) showed that some features of survey questions, such as question sensitivity and open-ended questions, are more prone to introduce interviewer effects (unit nonresponse, item nonresponse and measurement error). More particularly, studies indicate that item nonresponse rate increases with question sensitivity (Tourangeau & Yan, 2007). According to Tourangeau and Yan (2007), in some studies, the item nonresponse rate may range from 20 per cent to 40 per cent for questions related to financial assets and income. However, other research also indicates that cognitively demanding questions (the case of questions about income) might also be challenging to answer, especially for those with cognitive impairments (Knauper et al., 1997). This finding is especially important for surveys whose target participants are older since the cognitive decline is more common at older ages. Most studies report that item nonresponse (De Leeuw et al., 2003; Elliott et al., 2005), not codable answers and requests for clarification (Olson et al., 2019) tend to be higher among older respondents.
Analyses of the mechanisms underlying item nonresponse have highlighted that interviewers can influence item nonresponse (Pickery & Loosveldt, 1998). According to West and Blom (2017), multiple studies point out that certain interviewer features and behaviours might affect respondents’ actions during an interview in face-to-face surveys and especially for sensitive items. However, the interviewer features that might account for that influence are still weakly understood.
One strand of research focuses on the association between the sociodemographic characteristics of the interviewers and item nonresponse, even though most studies have not found evidence of this relationship (Lemay & Durand, 2002; Pickery & Loosveldt, 1998). There are, however, exceptions, with some researchers concluding that traits such as gender, age and education impact the number of refusals or don’t know answers in a questionnaire (Berk & Bernstein, 1988; Cleary et al., 1981; Riphahn & Serfling, 2005; Schräpler, 2006; Singer et al., 1983).
Even though not all studies have succeeded in explaining why this association exists, some attempts have been made using the theory of liking. This theory was developed by Groves, Cialdini and Couper (1992) and is based on the premise that the decision to participate in a study is mainly processed through heuristics mechanisms. This means that instead of rationally weighing the advantages and disadvantages of participation, sample members usually base their decision on some characteristic of the interviewers or the organisation they represent. Therefore, according to the theory of liking, people are more prone to favour interaction with someone they like or with whom they share similarities. Even though this theory was intended to help explain why some interviewer characteristics influence the sample members’ decision to cooperate in a survey, there is evidence that the liking principle also applies to item nonresponse. This was the case in the study by Vercruyssen, Wuyts and Loosveldt (2017) since matching the interviewer’s and the respondents’ age resulted in a significant reduction of item nonresponse in the European Social Survey (ESS7BE).
Furthermore, some findings also suggest that interviewers’ experience may mediate the effects of some sociodemographic characteristics on item nonresponse rates. For instance, as Cleary et al. (1981) reported, responses to psychological symptom scales were positively related to the interviewer’s age, which is attributed to feeling more comfortable in the interviewing situation due to experience. Experience is an interviewer trait addressed by a large body of literature, though findings of its influence on item missing data are still highly inconsistent. On the one hand, experience is often portrayed as beneficial, as more experienced interviewers achieve high item response rates, especially for sensitive questions such as financial assets (Essig & Winter, 2009). Even though this positive relationship is not entirely understood, Blom and Korbmacher (2013) hypothesised that experience with a survey and its questions might improve interviewers’ confidence, which shapes their behaviour during the interaction with the respondent, leading to less missing data. On the other hand, there is also evidence of the negative impact of experience on item response rates (Tu & Liao, 2007). The assignment of complex cases to more experienced interviewers (Blom et al., 2011) and heavy workloads (Pickery et al., 2001; Singer et al., 1983) have been found to negatively affect response rates and response quality due to interviewer fatigue.
A much less explored line of work addresses the influence of interviewers’ attitudes, expectations and behaviour on item nonresponse. The study of the effects of interviewers’ attitudes is mainly focused on unit nonresponse and started with the work of Lehtonen (1996), that concluded that persuasion-oriented interviewers are more prone to achieve higher cooperation rates.
Singer et al. (1983) point out that item nonresponse is positively influenced by positive interviewers’ expectations regarding respondents’ answers to survey questions. Similar results were found in a recent study using SHARE data (Friedel, 2020). Using the fifth wave of the SHARE Interviewer Survey, Friedel firstly assessed the extent to which interviewers influence nonresponse (“don’t know” and “refusal” answers) to income and asset questions (bank balances and interest or dividend income). Secondly, the author investigates how interviewers’ expectations regarding respondents’ likelihood to answer these questions predict response rates. The multilevel models showed that item nonresponse rates for all three financial questions were subjected to interviewer effects even after controlling for respondents’ and interviewers’ traits and that interviewers’ influence was strongest in the income question (41 per cent). Friedel also concludes that the interviewers who expected to obtain more than 50 per cent of answers to the income and asset questions achieved a lower item nonresponse, whereas those who expected to get less than 50 per cent achieved worse outcomes. The “self-fulfilling prophecy” referred to by Merton (1948) is often pointed out as an explanation for these results. Therefore, interviewers’ expectations influence how they conduct interviews because they behave (consciously or unconsciously) by their expectations.
Wuyts and Loosveldt (2017) contribute to this discussion by adding that the way interviewers answer survey questions themselves might explain their expectations regarding item nonresponse. In their study, the authors concluded that interviewers who refused to provide information about their income had a significant number of respondents who did not answer that question. According to the authors, based on their own behaviour, interviewers might create low expectations regarding income answers and act accordingly by not neutrally asking the question or being unable to probe correctly.
Despite the efforts to explain interviewer effects on item nonresponse, it is still unclear which interviewer characteristics underlie the lack of answers to survey questions. Furthermore, little attention has been paid to interviewers’ attitudes and behaviours. This study, therefore, aims to understand which characteristics of the interviewers working for the Survey of Health Ageing and Retirement in Europe (SHARE) are associated with item nonresponse, more specifically, with the lack of answers regarding income.
Based on the literature review, it is possible to hypothesise that positive expectations and less resistance to reporting their income are positively associated with income response. A key strength of this study lies in the extremely rich data provided by SHARE about the sociodemographic characteristics of interviewers, their experience, attitudes and behaviours. This information can be linked to item nonresponse, which makes it possible to determine the characteristics of those interviewers who managed to get answers to sensitive questions. Moreover, this study adds to the main idea underlying Friedel’s work by assessing whether other characteristics besides positive expectations are associated with income response and by addressing the role of interviewers’ attitudes and own behaviour. Ergo, the results of this study are critical for survey practitioners as there are implications for recruitment, selection and training decisions.
2. Data and Methods
2.1 Data
SHARE provides data on the health, socio-economic status and social and family networks of more than 140,000 individuals aged 50 years and over, covering 27 European countries and Israel. Every two years, the same people are interviewed at their homes, which makes it possible to understand the changes experienced by these individuals as they get older.
To develop new strategies to preserve or even increase the quality of the survey data, the central SHARE coordination team (SHARE Central) implemented the SHARE Interviewer Survey (Blom and Korbmacher 2013). This survey is intended to enable SHARE Central to understand better how the interviewers’ characteristics, experiences, attitudes, expectations and behaviour influence survey outcomes. In wave 6, SHARE interviewers from 12 European countries (Austria, Belgium, Germany, Estonia, Spain, Greece, Italy, Luxembourg, Poland, Portugal, Sweden and Slovenia) participated in this survey. The interviewer questionnaire is answered after the national training sessions but before beginning fieldwork, and the data is collected in an online survey. The data from the Interviewer Survey can be linked to the SHARE survey data through an interviewer’s (scrambled) identification code.
This study uses data from the SHARE Interviewer Survey (wave 6, release 6.0.0, DOI: 10.6103/SHARE.w6.600), as well as data provided by SHARE respondents, more specifically the Household Income module (wave 6, release 6.0.0), to assess income nonresponse (A. Börsch-Supan, 2020; Axel Börsch-Supan et al., 2013). Since this indicator is available for all SHARE countries, all interviewers who participated in the Interviewer Survey were considered in the analysis (N=809). The response rate for the Interviewer Survey ranged from 42.7 per cent to 94.3 per cent. For further details about the response rate for the Interviewer Survey, please see Table 1 in the Online Appendix.
A total of 50,854 interviews were conducted in the 12 countries included in this study (Bergmann et al., 2017). Moreover, the household response rate of wave 6, calculated according to the American Association for Public Opinion Research guidelines (AAPOR Response Rate 4), ranges from 67.51 per cent to 83.95 per cent for panel samples and from 30.29 per cent to 63.78 per cent for refreshment samples (Malter & Börsch-Supan, 2017). The income response rate achieved by the included countries is, on average, 79 per cent, with values ranging from 66.94 per cent to 87.44 per cent. For more detailed information about the number of conducted interviews and response rates, please see Table 2 in the Online Appendix.
2.2 Variables
2.2.1 Independent variables of interest
As discussed in the literature review, interviewers’ sociodemographic characteristics may influence the item nonresponse in a survey. The current analysis, therefore, includes the following interviewers’ sociodemographic variables: age at the time of the Interviewer Survey (2015); gender (0=female; 1=male); educational level (1=lower-level secondary school; 2=medium-level secondary school; 3=upper-level secondary school; 4=university degree); full-time employed (0=No; 1=Yes); part-time employed (0=No; 1=Yes); unemployed (0=No; 1=Yes); student (0=No; 1=Yes).
To measure interviewer experience, we used the variable years working as an interviewer (calculated by reference to the Interviewer Survey).
Moreover, the following question about attitudes towards persuasion was also used: “Now follow a series of statements on persuading respondents. Interviewers may differ in their opinions about these strategies. There is no right or wrong answer. We are interested in your opinion based on your experience as an interviewer.” The interviewers are presented with eight situations, some focusing on persuading reluctant respondents and others highlighting accepting refusals. More specifically, some sentences stress that all reluctant respondents must be persuaded to participate and that, with enough effort, even the most reluctant respondent can be persuaded to participate. It is also pointed out that most respondents will cooperate if they are approached at the right time. On the other hand, other statements underline that participant refusals must be accepted, that it makes no sense to contact reluctant people repeatedly, and that respondents who agree to participate after a great deal of effort will not provide reliable answers. Other situations also emphasise respondents’ privacy and the importance of pointing out that participation is voluntary. Therefore, the interviewers are asked to report if they strongly agree, somewhat agree, somewhat disagree or strongly disagree with each of the above situations. In some previous studies (De Leeuw et al. 1998; Hox and De Leeuw 2002; Blohm, Hox, and Koch 2006; Olson et al. 2020), these items were used to derive summed attitude scores. However, due to the low Cronbach’s alpha coefficient (0.051), the items were used as separate variables in this study. Following the approach recommended by Jäckle et al. (2013), the attitude items were then dichotomised by grouping together the response option “agree” and “strongly agree” as well as “disagree” and “strongly disagree” (0=Disagree; 1=Agree).
In order to assess interviewers’ expectations about obtaining answers to the income question, the following question was employed in the analysis of the characteristics underlying income nonresponse: “Social surveys very often ask about respondents’ income. What do you expect, how many of your respondents (in percentage) in SHARE will provide information about their income?”.
During the questionnaire, interviewers were also asked to provide information about their monthly household income: “All in all, approximately what was the average monthly income of your household after taxes in the past year?”. This question covers the interviewers’ behaviour, making it possible to assess whether income nonresponse to the interviewer questionnaire is correlated with income nonresponse among SHARE respondents. Not answering the income question was coded as 0, and answering the question was coded as 1.
Table 3 in the Online Appendix provides more information about the SHARE Interviewer Survey items and the operationalisation of the interviewer variables.
2.2.2 Dependent variable
Income nonresponse was measured using the household income question (hh017) in the HH module of the respondent questionnaire: “How much was the overall income, after taxes and contributions, that your entire household had in an average month in 2014?”. When a respondent answers “don’t know” or refuses to answer the question, an unfolding sequence of bracket questions follows. The use of follow-up bracket responses has been shown to significantly improve the quality of household economic data through a reduction of item nonresponse and through narrowing uncertainty about precise asset values (Juster & Smith, 1997; Moore & Loomis, 2001).
At the first question in the unfolding bracket, the programme randomly chooses one out of three possible entry points. Subsequently, it is asked if the amount is less, about or more than the shown entry point. The sequence will continue with the following bracket point unless a “don’t know”, or a “refusal” is given, in which case the series stops.
Of the respondents who did not provide their household income in question hh017, almost half (45.70%) did not answer the bracket questions. For this reason, only those individuals who did not answer the question hh017 were classified as non-respondents. Following Friedel’s (2020) procedure, answering the income question was coded as 0 and not answering this question (don’t know or refusal) was coded as 1. Additional information about the dependent variable is available in Table 4 of the Online Appendix.
2.2.3 Independent variables of control
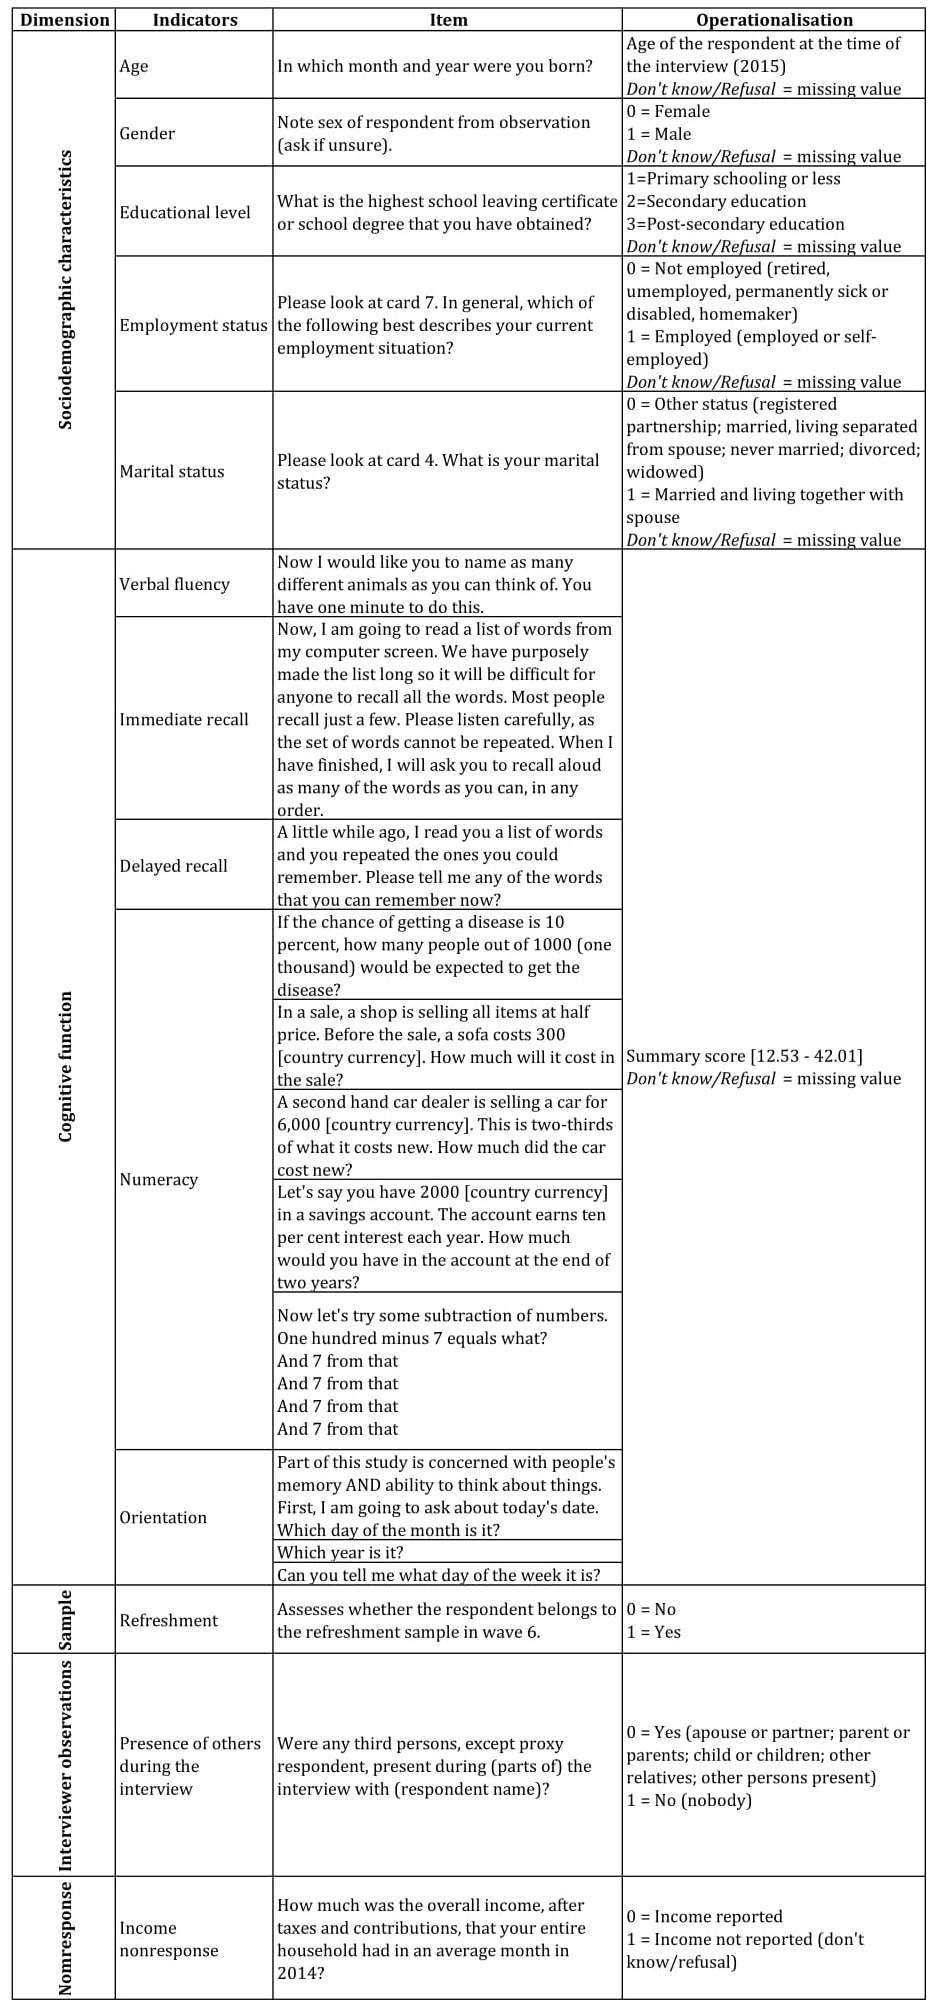
Based on the literature review, the current research includes several control variables at the respondent level: age at the time of the interview; gender (0=female; 1=male); educational level (1=primary schooling or less, 2=secondary education; 3=post-secondary education); employment status (0=not employed; 1=employed); marital status (0=other status; 1=married and living together with a spouse); and country of residence. Respondents’ cognitive function was also included, as it may influence the respondents’ behaviour. A summary score of cognitive function was built by averaging the z-scores of five objective cognitive tests focusing on verbal fluency, immediate recall, delayed recall, numeracy and orientation. The score ranges from 12.53 to 42.01, with higher values indicating better cognitive function. Additionally, a dummy variable was built to determine whether the respondent belonged to the refreshment sample (0=No; 1=Yes). The interviewer’s observation “presence of others during the interview” (0=Yes; 1=No) was also included as a control variable. Table 4 in the Online Appendix provides more information about the respondent questionnaire and the operationalisation of the variables.
2.3 Methods
This study was developed in two stages, and all analyses were performed using the software R (4.0.5) and the software Statistical Package for the Social Sciences (SPSS, 25.0).
Firstly, to characterise our study population, univariate descriptive statistics were applied. Secondly, multilevel analysis was employed to assess the association between each of the interviewer’s independent variables (sociodemographic characteristics, experience, attitudes, expectations and own behaviour) and the dependent variable, income nonresponse. The multilevel approach is the most appropriate to tackle the respondents nested within the interviewer design since it separates the interviewer and respondents’ effects by placing respondents at level one and interviewers at level two. This allows the regression intercepts to differ randomly (Hox, 2010). Multilevel logistic regression models were used as the dependent variable is dichotomous (answers to income: no/yes).
Firstly, the null model (Model 0) was assessed to determine the variance of income nonresponse explained by the interviewer characteristics without controlling for confounders. The Interclass Correlation Coefficient (ICC) of the null model is 0.355, meaning that interviewer characteristics explain 35.5 per cent of the variance of income nonresponse. The ICC of our null model is higher than the recommended cut-point of 5 per cent (LeBreton & Senter, 2008). This supports the suitability of multilevel modelling in the analysis. Secondly, Model 1 was adjusted for all potential respondent confounders. Thirdly, in Model 2, interviewers’ sociodemographic characteristics were added to the previous model and Model 3 further adjusts for the interviewers’ experience. Fourthly, Model 4 comprises interviewer attitudes towards persuasion and Model 5 additionally comprehends interviewers’ expectations. As the last step, Model 6 includes the interviewer’s own behaviour regarding the answer to the income question.
All non-significant variables were removed from the models, and the results displayed in all tables are unweighted. Odds ratios (OR), 95% confidence intervals (IC) and significance (where p-values of < 0.05 were considered statistically significant) are presented in the tables below.
3. Results
The sociodemographic characteristics and experience of the interviewers are displayed in Table 1.
Table 1. Sociodemographic characteristics and experience of the interviewers
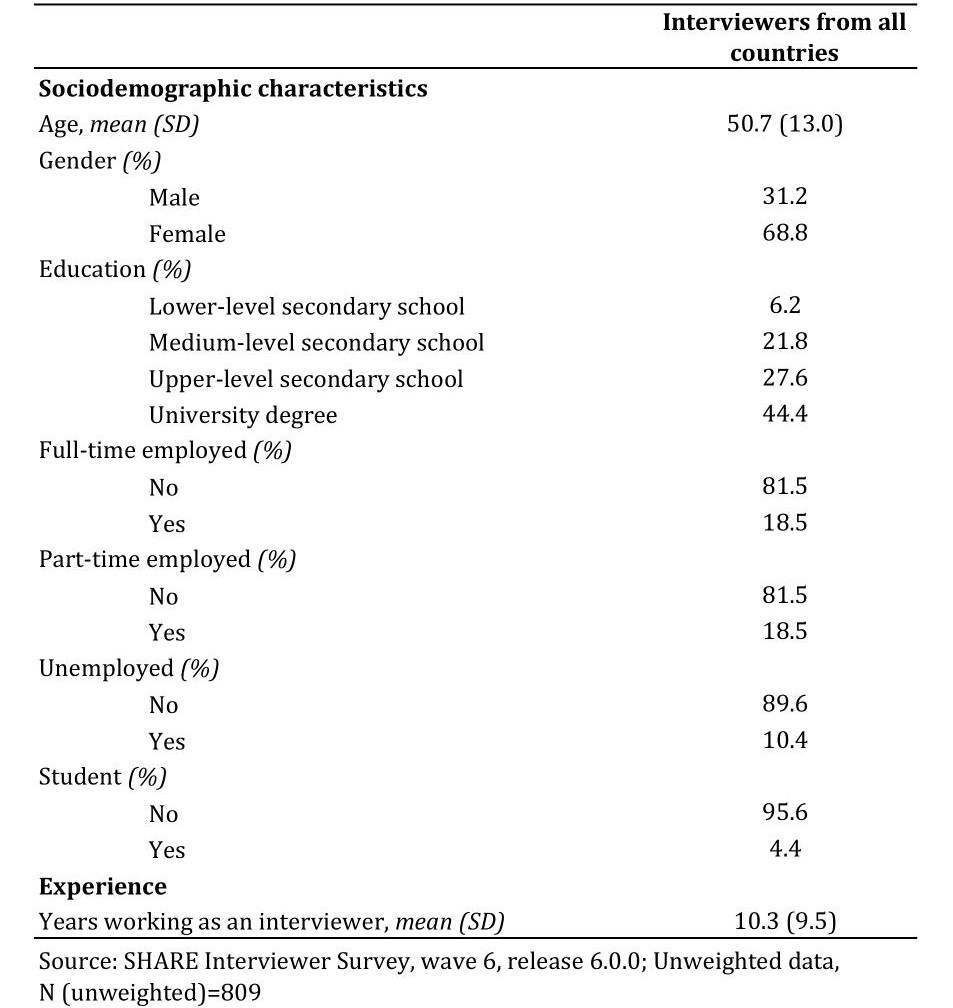
In terms of age, interviewers are, on average, 50.7 years old (SD = 13.0), and the majority are females (68.8%). Concerning education, 6.2 per cent have completed lower-level secondary school, 21.8 per cent have attended medium-level secondary school, 27.6 per cent have completed upper-level secondary school, and 44.4 per cent have a university degree. Moreover, 18.5 per cent of the interviewers work full-time in addition to interviewing, 18.5 per cent work part-time in another job, 10.4 per cent are unemployed, and 4.4 per cent are students.
With regard to experience, on average, the participants have been working as interviewers for 10.3 years (SD=9.5).
Table 2 shows the attitudes towards persuasion and the expectations of the interviewers.
Table 2. Interviewers’ attitudes towards persuasion and expectations
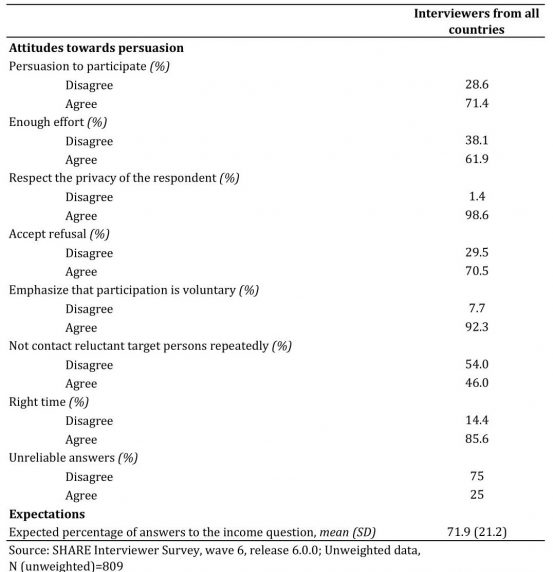
Concerning attitudes towards persuasion, most interviewers agree that reluctant respondents should always be persuaded to participate (71.4%). Table 2 also shows that 61.9 per cent of the interviewers agree that, with enough effort, even the most reluctant respondent can be persuaded to participate. Additionally, most interviewers (98.6%) agree that an interviewer should respect the respondent’s privacy. With regard to accepting refusals in the event of reluctance, most interviewers concur with this approach (70.5%), and 92.3 per cent of them agree that the voluntary nature of the study should always be emphasised. Moreover, 46 per cent of interviewers agree that it does not make sense to contact reluctant target persons repeatedly. Regarding the respondents’ willingness to participate if approached at the right time, 85.6 per cent of the interviewers support this argument. Most interviewers also disagree that respondents persuaded after much effort do not provide reliable answers (75%).
With regard to interviewers’ expectations, the expected percentage of answers to the income question is 71.9 per cent (SD=21.2).
The results of the interviewers’ own behaviour regarding the income question are shown in Table 3. Descriptive results show that 70.5 per cent of interviewers provided information about their income.
Table 3. Behaviours of the interviewers

The results of the multilevel logistic regression for income nonresponse are shown in Table 4.
Table 4. Multilevel logistic regression for income nonresponse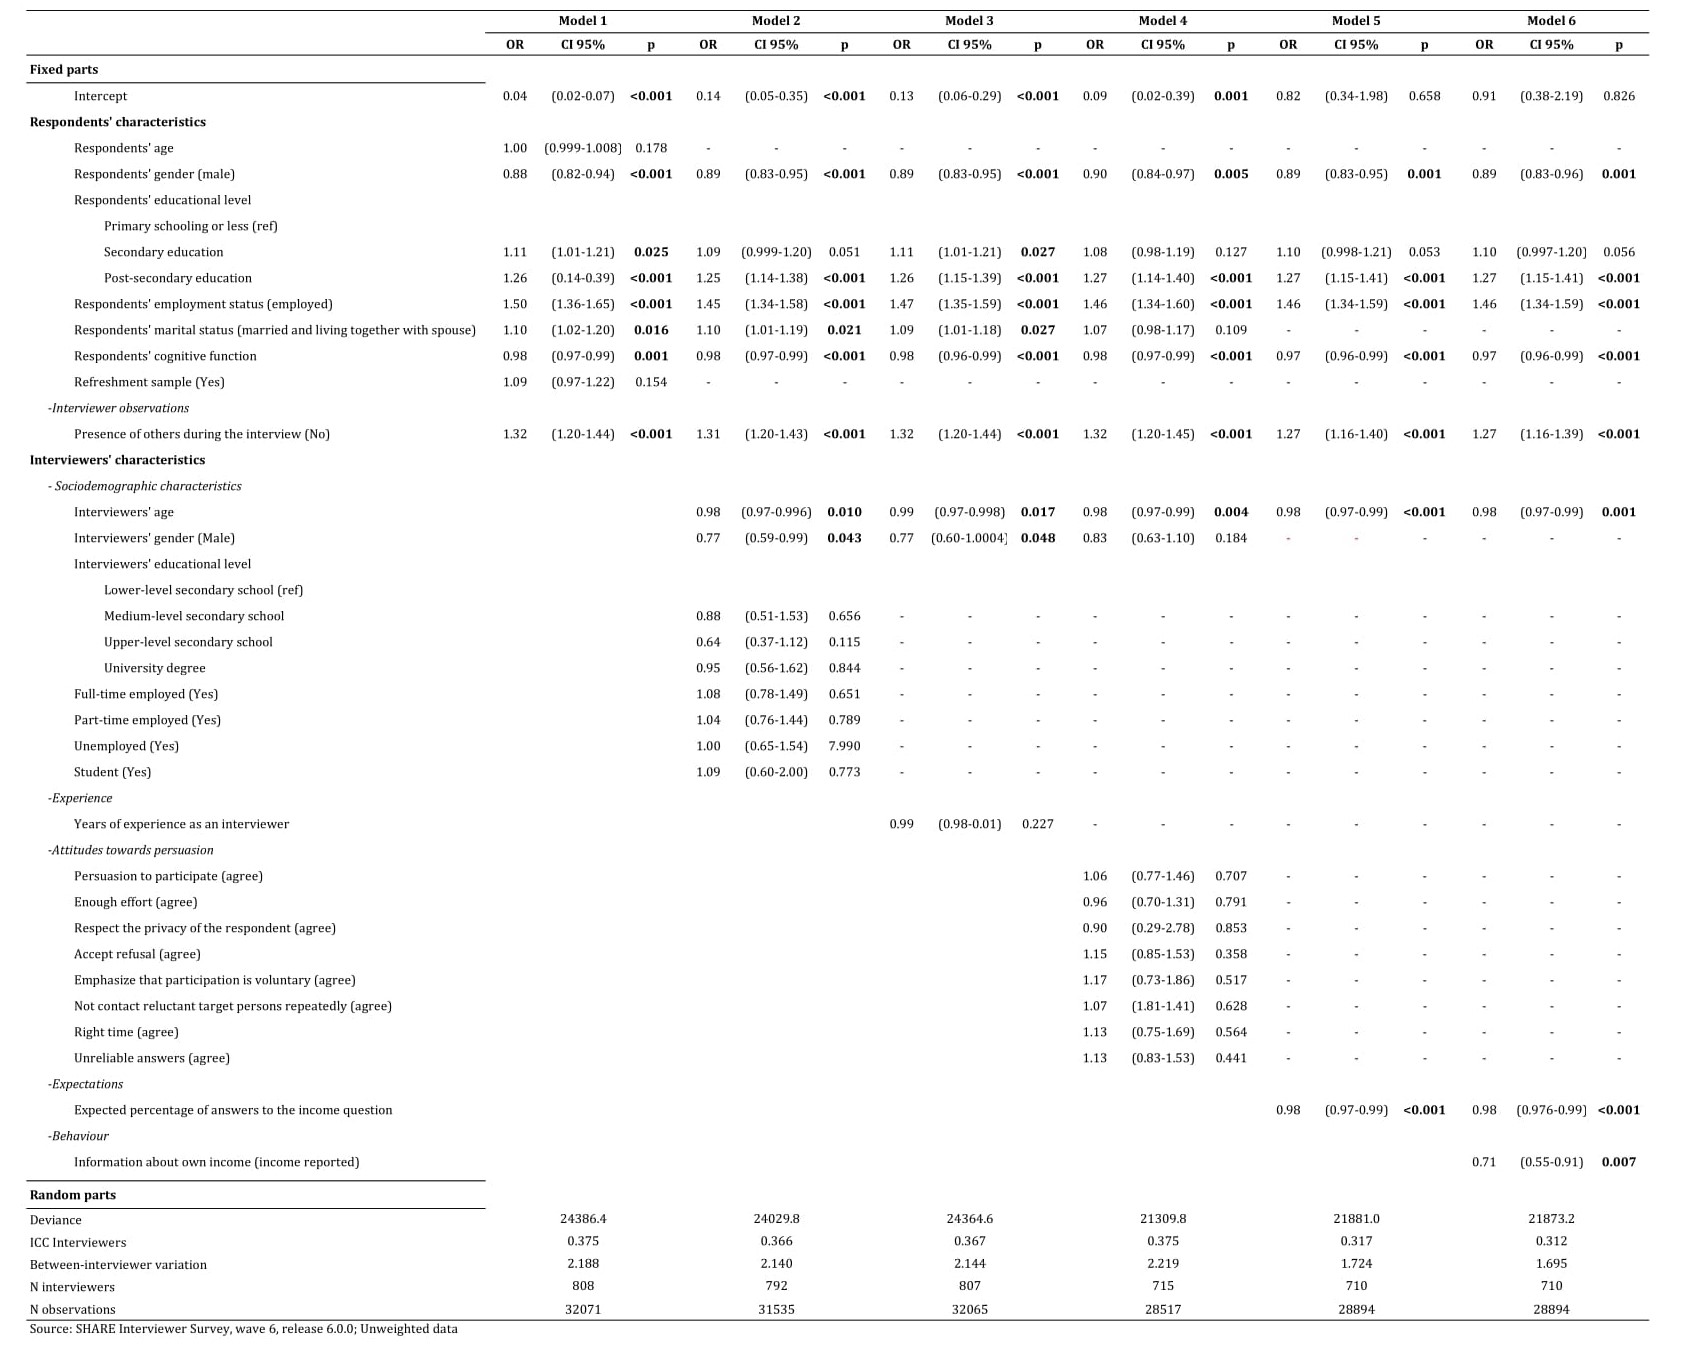
The final model (Model 6) showed significant interviewer effects on income nonresponse. Older interviewers performed better, as they were less likely to not obtain a response to the income question, compared with younger interviewers (OR = 0.98, 95% CI 0.97 to 0.99). No other interviewer’s sociodemographic characteristics or experience were significantly associated with income nonresponse.
The results also indicate that no interviewers’ attitudes towards persuasion are associated with income nonresponse.
Concerning interviewers’ expectations, Table 4 shows an inversely significant association between the expected percentage of answers to the income question and income nonresponse (OR = 0.98, 95% CI 0.976 to 0.99). Therefore, the interviewers with more positive expectations about obtaining answers to questions about income perform better than those with less positive expectations.
Model 6 also shows that the chances of not obtaining the respondents’ income information are 29 per cent lower for interviewers who provided their income in the Interviewer Survey (OR = 0.71, 95% CI 0.55 to 0.91).
It should also be stressed that the analysis of the correlation between the expected percentage of answers to the income question and the reported income in the Interviewer Survey revealed a significant positive correlation between these two variables (r = 0.168, p < 0.001). Thus, interviewers who provide information about their own income have more optimistic expectations regarding obtaining answers to this question from the respondents.
Statistical results also show that income nonresponse is associated with several respondent characteristics. Excluding age and marital status, all respondents’ sociodemographic characteristics are significant. Men were more likely to provide information about their income than women (OR = 0.89, 95% CI 0.83 to 0.96). Furthermore, respondents with post-secondary education were more likely not to answer the income question compared to respondents with primary education (OR = 1.27, 95% CI 1.15 to 1.41), and this is also the case for respondents who are employed (OR = 1.46, 95% CI 1.34 to 1.59). Concerning respondents’ cognitive function, those who perform better in the cognitive tests are more likely to provide information about their income when compared to their peers (OR = 0.97, 95% CI 0.96 to 0.99). Moreover, the probability of not answering the income question is higher for those who were alone during the interview (OR = 1.27, 95% CI 1.16 to 1.39). No associations were found between the respondents’ sample characteristics and income nonresponse.
4. Discussion and Conclusion
Item nonresponse is a significant concern since the power of survey data can be overridden if the information requested in a questionnaire is not provided. Hence, it is critical to tackle item nonresponse and to accomplish that, the determinants underlying nonresponse must be identified. Although the literature is unanimous in highlighting interviewers as one of those determinants, the existing studies are thus far inconclusive about the interviewer characteristics that might influence item nonresponse. Therefore, this study assesses the association between item nonresponse to the household income question and interviewers’ sociodemographic characteristics, experience, attitudes, expectations and behaviour when asked about their income.
The results show that interviewer performance is not associated with sociodemographic characteristics, except age, since older interviewers obtain less income nonresponse. One possible explanation for the age results lies in the theory of liking (Groves et al., 1992). Since SHARE’s target population is older adults, these respondents might feel more comfortable sharing information with an older interviewer than with a younger one. This was the case in the study by Vercruyssen, Wuyts and Loosveldt (2017) since matching the age of interviewers and respondents resulted in fewer item nonresponse. Although we cannot test this hypothesis, it would be interesting if future research further investigated this topic.
Interviewer experience is another hypothesis commonly used to explain why older interviewers perform better. For instance, Cleary et al. (1981) suggested that the positive association between an interviewer’s age and the answers to sensitive questions might reflect differences in experience. However, this is not the case in the current study, as no association was found between interviewers’ experience and income nonresponse. This was also true for the investigation by Berk and Bernstein (1988), as older interviewers obtained less missing data but were not more experienced than the younger interviewers, who achieved worse outcomes. Thus, this finding suggests that other interviewer qualities must be considered. Interviewer strategies could help explain the age difference since the older interviewer’s approach might differ from that of their younger counterparts. Therefore, it would be interesting if, in the future, the interviewer survey could consider some questions regarding the strategies adopted by interviewers.
Previous research has highlighted interviewers’ attitudes as essential factors influencing cooperation rates (Cunha et al., 2022; Durrant et al., 2010; Olson et al., 2020). This seems not to be the case for income nonresponse since the multilevel analysis shows no significant relationships between the tested attitudes and our dependent variable. However, we should not overlook the possibility that other interviewer attitudes not covered by the questionnaire might play a role in income nonresponse.
When assessing interviewers’ expectations, the multilevel models showed that higher expectations are associated with lower income nonresponse. Therefore, positivity emerged as an essential characteristic for obtaining better results. These findings align with previous research that had already stressed the importance of positive expectations for item nonresponse (Friedel, 2020; Singer et al., 1983). Moreover, besides positivity, it can also be hypothesised that the interviewers’ high expectations might also arise from their confidence in their own abilities. However, this hypothesis needs to be further tested in future research.
Furthermore, as in the study by Wuyts and Loosveldt (2017), the SHARE interviewers who did not answer the household income question in the Interviewer Survey administered more interviews in which this information was missing. It is, therefore, possible that the interviewers’ behaviour when asked about their income might have influenced their prospects regarding the income answer, which led them, consciously or unconsciously, to act in compliance with those prospects. For instance, the interviewers who provided information about their income might not have anticipated difficulties with this question, leading them to act more naturally and effectively address respondents’ potential worries. On the other hand, an interviewer who felt uncomfortable providing this information may have created negative expectations because they would not provide the requested answer. Consequently, they might not put enough effort into eliciting a response from the sample member, or their uneasiness might lead to mistrust in the respondent and, therefore, an increase in the income nonresponse rate. The correlation analysis supports this hypothesis since interviewers who provide information about their own income have more optimistic expectations regarding obtaining answers to the income question during the respondent questionnaire.
In addition to interviewers’ traits, the results are in line with previous research that shows that specific respondent sociodemographic characteristics are associated with their behaviour during an interview (Olson et al., 2019). In fact, as in previous studies (Bittmann, 2020), in SHARE, male respondents are more likely to provide information about their income than women. Regarding education, as in Serfling’s (2005) study, income nonresponse is greater for respondents with a higher educational level. These results differ from the study conducted by Silber et al. (2021), where respondents’ education was not significantly associated with the likelihood of refusals or “don’t know” answers. Furthermore, while Friedel (2020) did not find a relationship between employment status and income nonresponse, in this study, employed respondents were more likely not to provide information about their income than their counterparts. Besides, as was expected, those with higher cognitive abilities are more likely to answer the income question, results that are in line with the work of Knauper et al. (1997).
A higher income nonresponse is also associated with being alone during the interview. One possible explanation is that respondents who are alone during the interview might not wish to provide information about their household income as they may not know whether their partner would be comfortable sharing this information. Moreover, the sensitivity of the income question, along with the fact that no one of the respondents’ trust is present during the interview, might cause feelings of uneasiness and lead to an increase in income nonresponse.
This study has important implications for survey practitioners. During the recruitment and selection processes, specific attention should not be paid to interviewers’ sociodemographic characteristics. Rather than privileging these traits, attention should be paid to candidates’ expectations and own behaviour regarding the income question. Furthermore, during the training sessions, it would be beneficial if older interviewers could share the arguments and strategies they use to obtain answers to the income question to create a fruitful debate that would help younger interviewers achieve better results. Interviewers should also be reassured about the income question, for example, by clarifying the goal of the question and its importance to try to circumvent the effect that negative expectations and the interviewers’ own behaviour have on income nonresponse.
This study has some limitations that need to be addressed in future research. Firstly, as mentioned previously, the Interviewer Survey was applied after the interviewer training sessions but before the beginning of fieldwork. Thus, it is not possible to know whether the interviewers’ attitudes during the interviews were similar to the ones reported in the questionnaire. Secondly, the assessment of whether the interviewer had already interviewed the same respondents in previous waves or if they were interviewing different respondents was not accounted for in the analysis, nor was the information on whether the respondents had already answered the income question in earlier waves. In addition, education was operationalised differently for interviewers and respondents since ISCED is only available for SHARE respondents. It would also be important to consider some country-level variables, such as the unit nonresponse rate since prior studies have shown that the unit nonresponse and the item nonresponse might influence each other (Burton et al., 1999; Yan & Curtin, 2010). However, the unit nonresponse rate achieved by the interviewers who participated in the interviewer survey is unavailable; therefore, this information could not be included in the model.
Moreover, our dependent variable does not account for differences between “don’t know” answers and refusals despite some studies suggesting that different explanatory characteristics might be behind these two types of nonresponse (Silber et al., 2021). It would be interesting if future research repeated this study while separating income nonresponse due to “don’t know” answers and income nonresponse due to refusals. Lastly, all analyses are unweighted since no weights are available for the Interviewer Survey.
Despite these limitations, it was possible to highlight the influence of interviewers’ positive expectations and own behaviour on income nonresponse.
Appendix
Table 1. Detailed information about the response rate for the Interviewer Survey, per country.
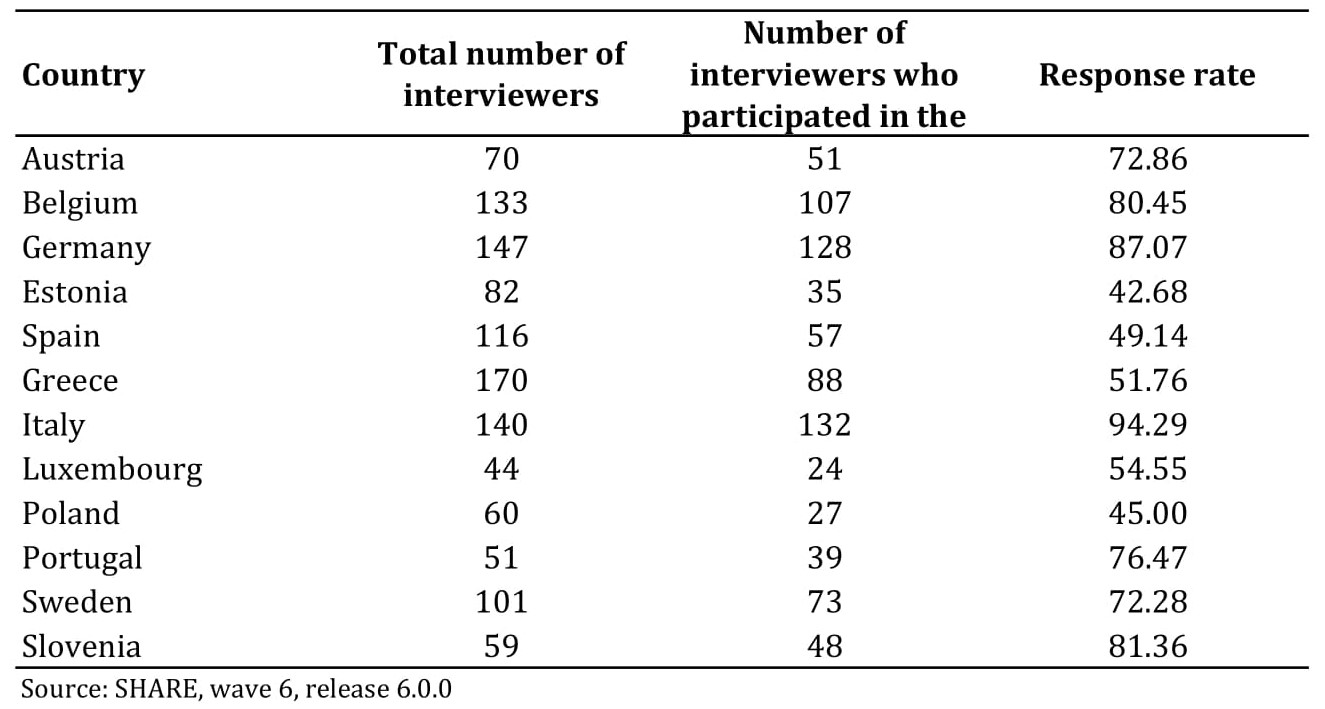
Table 2. Detailed information about the number of conducted interviews and response rates, per country.

Table 3. Detailed information about the SHARE Interviewer Survey items and the operationalisation of the interviewer variables.
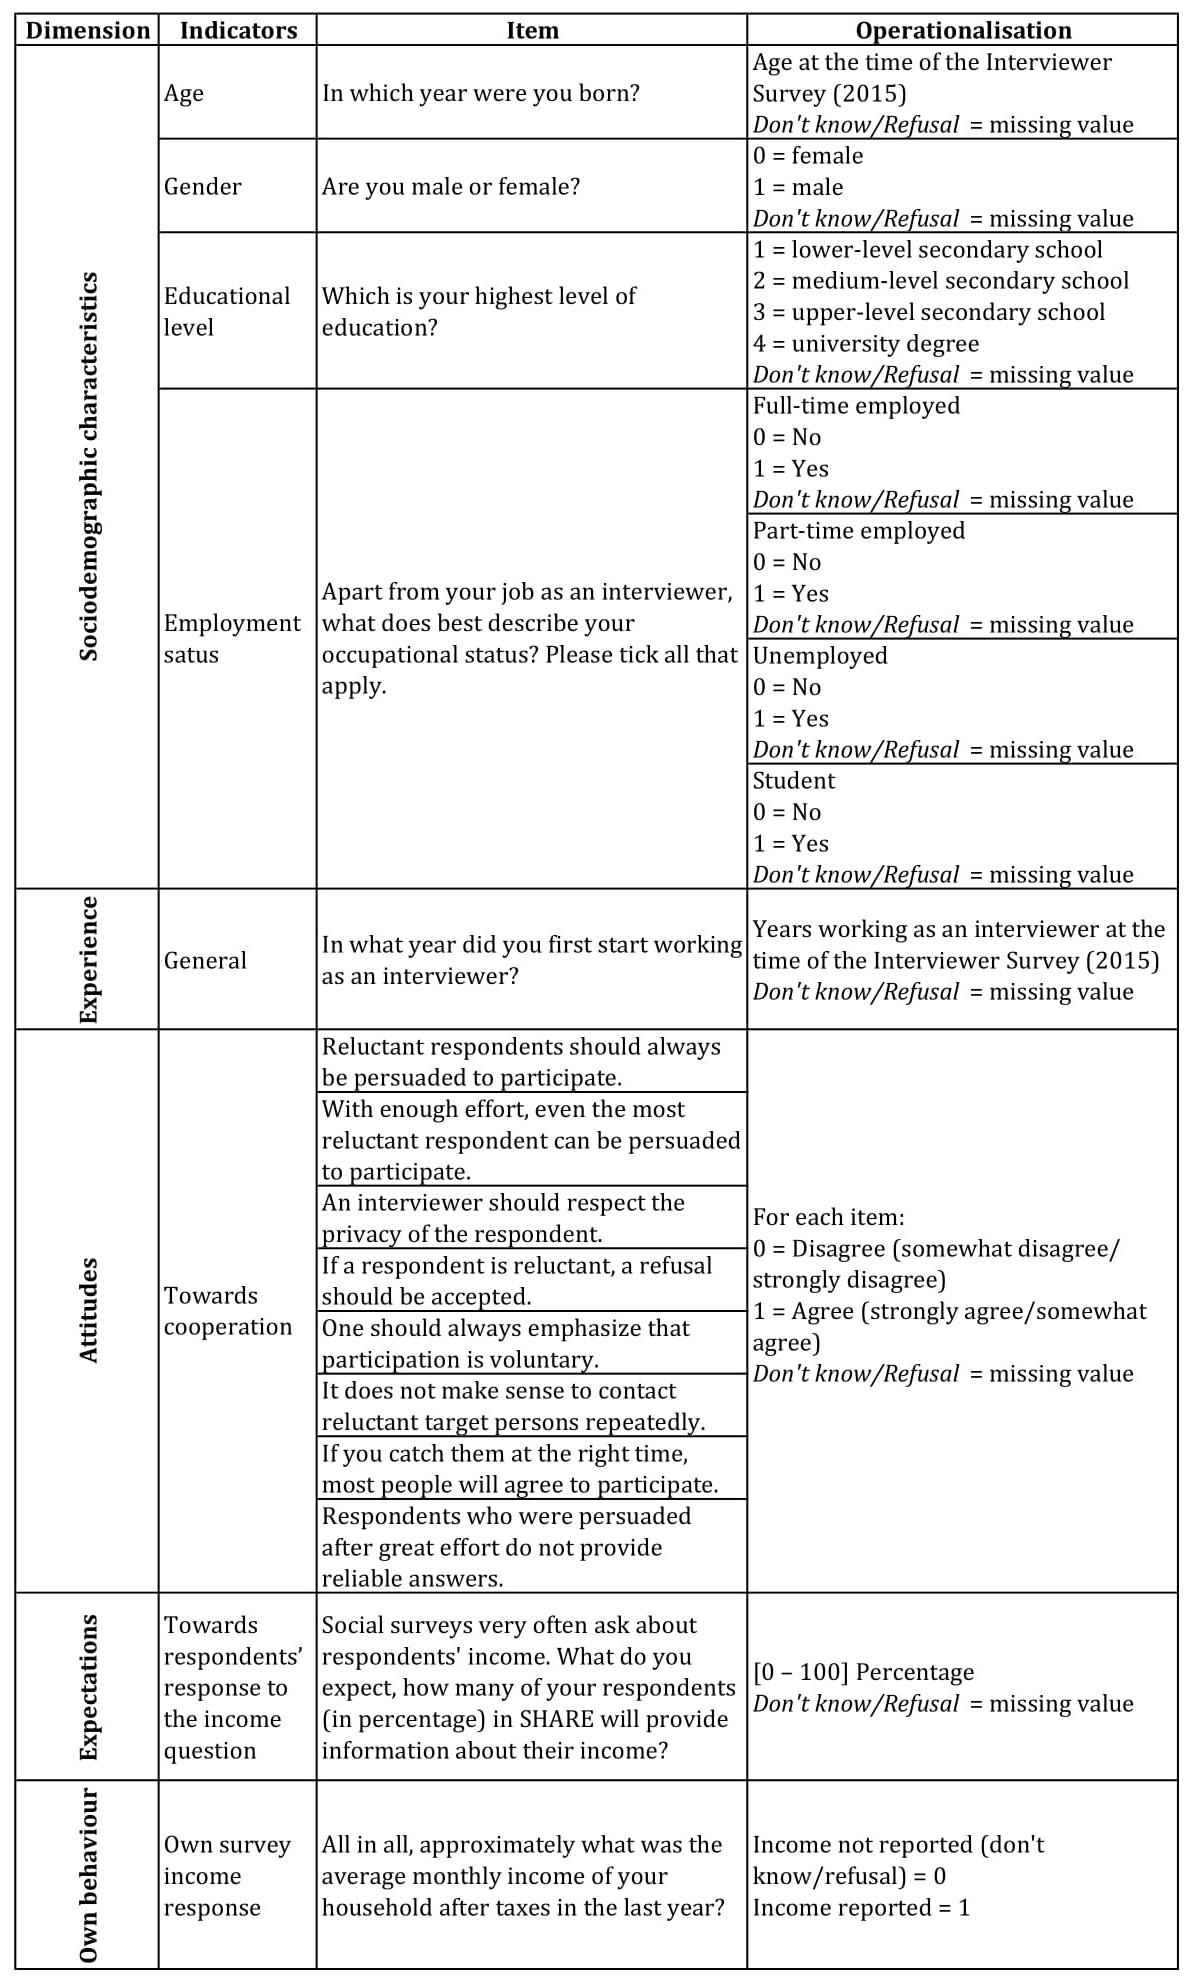
Table 4. Detailed information about the respondent questionnaire and the operationalisation of the respondent variables.
References
- Bergmann, M., Kneip, T., De Luca, G., & Scherpenzeel, A. (2017). Survey participation in the Survey of Health, Ageing and Retirement in Europe (SHARE). 1–6. https://doi.org/10.6103/SHARE.w1.600
- Berk, M. L., & Bernstein, A. B. (1988). Interviewer characteristics and performance on a complex health survey. Social Science Research, 17(3), 239–251. https://doi.org/10.1016/0049-089X(88)90015-4
- Bethlehem, J., Cobben, F., & Schouten, B. (2011). Handbook of Nonresponse in Household Surveys. Wiley.
- Bittmann, F. (2020). The more similar, the better? How (mis)match between interviewers and respondents in survey situations affects item nonresponse and data quality. Survey Research Methods, 14(3), 301–323. https://doi.org/10.18148/srm/2020.v14i3.7621
- Blohm, M., Hox, J., & Koch, A. (2006). The influence of interviewers’ contact behavior on the contact and cooperation rate in face-to-face household surveys. International Journal of Public Opinion Research, 19(1), 97–111.
- Blom, A. G., & Julie M. Korbmacher. (2013). Measuring Interviewer Characteristics Pertinent to Social Surveys: A Conceptual Framework. Survey Methods: Insights from the Field, 1–16. https://doi.org/10.13094/SMIF-2013-00001
- Blom, A. G., Leeuw, E. D. de, & Hox, J. J. (2011). Interviewer Effects on Nonresponse in the European Social Survey. Journal of Official Statistics, 27(2), 359–377. https://doi.org/10.2139/ssrn.1663704
- Börsch-Supan, A. (2020). Survey of Health, Ageing and Retirement in Europe (SHARE) Wave 6. Release version: 6.0.0. SHARE-ERIC. In Data set. https://doi.org/10.6103/SHARE.w6.600
- Börsch-Supan, Axel, Brandt, M., Hunkler, C., Kneip, T., Korbmacher, J., Malter, F., Schaan, B., Stuck, S., & Zuber, S. (2013). Data resource profile: The survey of health, ageing and retirement in europe (share). International Journal of Epidemiology, 42(4), 992–1001. https://doi.org/10.1093/ije/dyt088
- Burton, J., Laurie, H., & Moon, N. (1999). “Don’t Ask Me Nothin” About Nothin’, I Just Might Tell You the Truth’ The Interaction Between Unit Non-response and Item Non-response . https://www.iser.essex.ac.uk/research/publications/publication-517511
- Cleary, P. D., Mechanic, D., & Weiss, N. (1981). The effect of interviewer characteristics on responses to a mental health interview. Journal of Health and Social Behavior, 22(2), 183–193. https://doi.org/10.2307/2136294
- Cunha, C., Matos, A. D., Voss, G., & Machado, C. (2022). Interviewer Characteristics and Nonresponse Survey Outcomes: A Portuguese Case Study (pp. 95–111). Springer, Cham. https://doi.org/10.1007/978-3-030-98048-1_5
- De Leeuw, E. D., Hox, J., & Huisman, M. (2003). Prevention and Treatment of Item Nonresponse. Journal of Oficial Statistics, 19(2), 153–176.
- De Leeuw, E., Hox, J., Snijkers, G., & De Heer, W. (1998). Interviewer Opinions, Attitudes and Strategies Regarding Survey Participation and Their Effect on Response. In Nonresponse in Survey Research. Proceedings of Eighth International Workshop on Household Survey Nonresponse 24-26 September 1997 (pp. 239–248).
- Durrant, G. B., Groves, R. M., Staetsky, L., & Steele, F. (2010). Effects of interviewer attitudes and behaviors on refusal in household surveys. Public Opinion Quarterly, 74(1), 1–36. https://doi.org/10.1093/poq/nfp098
- Elliott, M. N., Edwards, C., Angeles, J., Hambarsoomians, K., & Hays, R. D. (2005). Patterns of unit and item nonresponse in the CAHPS® Hospital survey. In Health Services Research (Vol. 40, Issue 6 II, pp. 2096–2119). Health Research & Educational Trust. https://doi.org/10.1111/j.1475-6773.2005.00476.x
- Essig, L., & Winter, J. K. (2009). Item non-response to financial questions in household surveys: An experimental study of interviewer and mode effects. Fiscal Studies, 30(3–4), 367–390. https://doi.org/10.1111/j.1475-5890.2009.00100.x
- Friedel, S. (2020). What They Expect Is What You Get: The Role of Interviewer Expectations in Nonresponse to Income and Asset Questions. Journal of Survey Statistics and Methodology, 8(5), 851–876. https://doi.org/10.1093/jssam/smz022
- Groves, R. M., Cialdini, R. B., & Couper, M. P. (1992). Understanding The Decision to Participate in a Survey. Public Opinion Quarterly, 56(4), 475. https://doi.org/10.1086/269338
- Hox, J. J. (2010). Multilevel analysis: Techniques and applications: Second edition. In Multilevel Analysis: Techniques and Applications: Second Edition. Routledge Taylor & Francis Group. https://doi.org/10.4324/9780203852279
- Hox, J. J., & De Leeuw, E. D. (2002). The Influence of Interviewers’ Attitude and Behavior on Household Survey Nonresponse: An International Comparison. In Survey Nonresponse (pp. 103–119).
- Jäckle, A., Lynn, P., Sinibaldi, J., & Tipping, S. (2013). The effect of interviewer experience, attitudes, personality and skills on respondent co-operation with face-to-face surveys. Survey Research Methods, 7(1), 1–15. https://doi.org/10.18148/srm/2013.v7i1.4736
- Juster, F. T., & Smith, J. P. (1997). Improving the Quality of Economic Data: Lessons from the HRS and AHEAD. Journal of the American Statistical Association, 92(440), 1268. https://doi.org/10.2307/2965397
- Knauper, B., Belli, R., Hill, D., & Herzog, A. R. (1997). Question Difficulty and Respondents’ Cognitive Ability: The Impact on Data Quality. Journal of Official Statistics, 13(2).
- LeBreton, J. M., & Senter, J. L. (2008). Answers to 20 Questions About Interrater Reliability and Interrater Agreement. Organizational Research Methods, 11(4), 815–852. https://doi.org/10.1177/1094428106296642
- Lehtonen, R. (1996). Interviewer Attitudes and Unit Nonresponse in Two Different InterviewingSchemes. In S. Laaksonen (Ed.), International Perspectives on Nonresponse (pp. 130–140). Proceedings of the Sixth International Workshop on Household Survey Nonresponse, Statistics Finland.
- Lemay, M., & Durand, C. (2002). The Effect Of Interviewer Attitude on Survey Cooperation. Bulletin of Sociological Methodology/Bulletin de Méthodologie Sociologique, 76(1), 27–44. https://doi.org/10.1177/075910630207600102
- Malter, F., & Börsch-Supan, A. (2017). SHARE Wave 6: Panel innovations and collecting Dried Blood Spots. In F. Malter & A. Börsch-Supan (Eds.), Munich Center for the Economics of Aging (MEA). Munich Center for the Economics of Aging (MEA).
- Merton, R. K. (1948). The Self-Fulfilling Prophecy. The Antioch Review, 8(2), 193. https://doi.org/10.2307/4609267
- Moore, J., & Loomis, L. (2001). Using Alternative Question Strategies to Reduce Income Nonresponse. United States Census Bureau. https://www.census.gov/library/working-papers/2001/adrm/rsm2001-03.html
- Olson, K., Smyth, J. D., Dykema, J., Holbrook, A. L., Kreuter, F., & West, B. T. (2020). Interviewer Effects from a Total Survey Error Perspective. In Interviewer Effects from a Total Survey Error Perspective. Chapman and Hall/CRC. https://doi.org/10.1201/9781003020219
- Olson, K., Smyth, J. D., & Ganshert, A. (2019). The Effects of Respondent and Question Characteristics on Respondent Answering Behaviors in Telephone Interviews. Journal of Survey Statistics and Methodology, 7(2), 275–308. https://doi.org/10.1093/jssam/smy006
- Pickery, J., & Loosveldt, G. (1998). The impact of respondent and interviewer characteristics on the number of “no opinion” answers: A multilevel model for count data. Quality and Quantity, 32(1), 31–45. https://doi.org/10.1023/A:1004268427793
- Pickery, J., Loosveldt, G., & Carton, A. (2001). The effects of interviewer and respondent characteristics on response behavior in panel surveys. Sociological Methods & Research, 29(4), 509–523.
- Riphahn, R. T., & Serfling, O. (2005). Item non-response on income and wealth questions. Empirical Economics, 30(2), 521–538. https://doi.org/10.1007/s00181-005-0247-7
- Schräpler, J. P. (2006). Explaining income nonresponse – A case study by means of the British Household Panel Study (BHPS). Quality and Quantity, 40(6), 1013–1036. https://doi.org/10.1007/s11135-005-5429-z
- Serfling, O. (2005). The Interaction between Item, Questionnaire and Unit Nonresponse in the German SOEP. Schmollers Jahrbuch : Journal of Applied Social Science Studies / Zeitschrift Für Wirtschafts- Und Sozialwissenschaften, 125(1), 195–205. https://ideas.repec.org/a/aeq/aeqsjb/v125_y2005_i1_q1_p195-205.html
- Silber, H., Roßmann, J., Gummer, T., Zins, S., & Weyandt, K. W. (2021). The effects of question, respondent and interviewer characteristics on two types of item nonresponse. Journal of the Royal Statistical Society: Series A (Statistics in Society), 184(3), 1052–1069. https://doi.org/10.1111/rssa.12703
- Singer, E., Frankel, M. R., & Glassman, M. B. (1983). The Effect of Interviewer Characteristics and Expectations on Response. Public Opinion Quarterly, 47(1), 68. https://doi.org/10.1086/268767
- Tourangeau, R., & Yan, T. (2007). Sensitive Questions in Surveys. Psychological Bulletin, 133(5), 859–883. https://doi.org/10.1037/0033-2909.133.5.859
- Tu, S. H., & Liao, P. S. (2007). Social distance, respondent cooperation and item nonresponse in sex survey. Quality and Quantity, 41(2), 177–199. https://doi.org/10.1007/s11135-007-9088-0
- Vercruyssen, A., Wuyts, C., & Loosveldt, G. (2017). The effect of sociodemographic (mis)match between interviewers and respondents on unit and item nonresponse in Belgium. Social Science Research, 67, 229–238. https://doi.org/10.1016/j.ssresearch.2017.02.007
- West, B. T., & Blom, A. G. (2017). Explaining interviewer effects: A research synthesis. Journal of Survey Statistics and Methodology, 5(2), 175–211. https://doi.org/10.1093/JSSAM/SMW024
- Wuyts, C., & Loosveldt, G. (2017). The Interviewer in the Respondent’s Shoes: What Can We Learn from the Way Interviewers Answer Survey Questions? In Field Methods (Vol. 29, Issue 2, pp. 140–153). SAGE Publications Inc. https://doi.org/10.1177/1525822X16663162
- Yan, T., & Curtin, R. (2010). The Relation Between Unit Nonresponse and Item Nonresponse: A Response Continuum Perspective. International Journal of Public Opinion Research, 22(4), 535–551. https://doi.org/10.1093/ijpor/edq037
-
Keywords
calibration CATI coverage coverage bias cross-national surveys data linkage data quality European Social Survey experiment face-to-face face-to-face survey Facebook hard to reach populations incentives item nonresponse measurement measurement error mixed-mode surveys multitasking non-probability samples Nonresponse nonresponse bias nonresponse rates paradata PIAAC Probability sample probability samples QR codes rare populations response rate Satisficing social desirability Social media survey survey-taking climate survey data survey management survey methods Telephone survey telephone surveys total survey error unit nonresponse validity web survey Web surveys weighting
