

Binary response format or 11-point scale? Measuring justice evaluations of earnings in the SOEP
Research note
Adriaans, J., Eisnecker P., Sauer C. & Valet P. (2022). Binary response format or 11-point scale? Measuring justice evaluations of earnings in the SOEP. Survey Methods: Insights from the Field. Retrieved from https://surveyinsights.org/?p=16588
© the authors 2022. This work is licensed under a Creative Commons Attribution 4.0 International License (CC BY 4.0) 
Abstract
Questions on justice of earnings are regularly fielded in large-scale surveys but insights into the role of response formats on measures of the justice of earnings are missing. This problem is illustrated by the German Socio-Economic Panel Study (SOEP), which, in 2017, changed its question on the justice of one’s own earnings from a binary response scale to an 11-point scale. Meanwhile, the share of respondents evaluating their earnings as just dropped considerably, leaving unclear how methodological and substantive effects are intertwined. Addressing this gap, we analysed a survey experiment in the 2016 Innovation Sample of the SOEP (SOEP-IS). In a split-ballot design, 2562 employed SOEP-IS respondents were randomly allocated to one of two experimental groups: receiving either the binary scale or the 11-point scale. Our results show that a lower share of respondents evaluated their earnings as just in the 11-point scale condition. However, follow-up questions on the just amount of earnings were unaffected by the question format. We conclude that it is crucial for researchers investigating justice evaluations of one’s own earnings to account for these measurement effects as well as for practitioners to carefully document and test the effects of changes in response format.
Keywords
Germany, Justice of earnings, response format, SOEP, survey experiment.
Acknowledgement
JA and PE acknowledge funding from the German Research Foundation (DFG) as part of the project “Structural Conditions of Justice Attitudes Over the Life-Span” (grant number: LI 987/7-1). JA received financial and intellectual support from the Socio-Economic Panel Study (SOEP) at DIW Berlin.
Copyright
© the authors 2022. This work is licensed under a Creative Commons Attribution 4.0 International License (CC BY 4.0)
Introduction
Empirical justice research has gained momentum in recent decades. Questions about fair treatment at work, fair chances to excel in life, and the fairness of income are investigated in various social science disciplines (Liebig and Sauer 2016). A vital branch of empirical justice research investigates distributive justice and, in particular, the justice of one’s own earnings (Jasso, Törnblom, & Sabbagh 2016; Jasso 1978). Questions on the perceived justice of earnings are included in several international comparative surveys—such as the International Social Survey Project (ISSP), the European Social Survey (ESS), and the International Social Justice Project (ISJP)—as well as in many national surveys—including Australia, Canada, Germany, and the U.S.—and employ a variety of empirical strategies (Jasso 2007).
For example, the justice evaluation of earnings can be assessed by asking respondents about the earnings they would consider just along with querying information on their actual earnings. The justice evaluation is then assessed as the natural logarithm of the ratio of both amounts (e.g., Jasso 1978; Sauer & Valet 2013; Schunck, Sauer, & Valet 2015). Some authors simply draw on the information on the amount of reported just earnings (e.g., Jasso and Wegener 2021; Schröder 2017; Schneck 2014). Another approach asks respondents to evaluate the justice of their own earnings on a scale. Across surveys, a variety of response scales is used to assess respondents’ justice evaluations of their own earnings. While some use a binary response format that simply differentiates if respondents evaluate their earnings as just or unjust (e.g., Falk et al. 2011; Pfeifer & Stephan 2019; H. Schneider 2018), others rely on response scales that capture the degree of perceived injustice (e.g., Adriaans & Targa 2022; Narisada 2020; S.M. Schneider & Valet 2017; Tao 2015).
While different approaches are used, we know little about how these affect respondents’ justice evaluations. This general problem of missing insights into the role of measurement choices on the sense of justice is illustrated by the case of the German Socio-Economic Panel Study (SOEP). SOEP uses a mixture of measurement strategies: First, asking respondents to directly evaluate their earnings, and then asking follow-up questions on actual and just earnings. From 2005 to 2015, SOEP respondents were asked: “Is the [gross] income that you earn at your current job just, from your point of view?” Response options were “yes” and “no”. While this response format allows to assess whether a respondent expresses to receive unjust pay, it lacks important information that is of interest to empirical justice research. First, it ignores the bipolar nature of injustice in favour of a unipolar conception (e.g., Menold & Bogner 2016): Are the received earnings unjustly low or unjustly high? Second, the magnitude of perceived injustice is overlooked: Do respondents perceive extreme, moderate, or slight injustice? Third, the question wording may be leading as it only asks whether income is “just” but does not mention injustice. This may lead respondents to evaluate their earnings as just.
To address the shortcomings of the binary measure and to increase comparability with established measures in empirical justice research (Auspurg et al. 2017; Sauer & May 2017; S.M. Schneider & Valet 2017), SOEP introduced an 11-point response scale in 2017. This new response scale enables respondents to express both the direction and intensity of perceived injustice and thus should allow researchers to analyse more subtle distinctions in respondents’ earnings injustice evaluations (e.g., Krosnick & Fabrigar 1997, Menold & Bogner 2016). The new question reads: “If you think about your current gross income, would you say that it is just, considering the type of work you do, or that it is unjustly high or low?” Respondents can answer on an 11-point rating scale running from -5 (labelled “unjustly low”) through 0 (labelled “just”) to +5 (labelled “unjustly high”). Building on the assumption that, in the case of justice, actual earnings perfectly align with just earnings (Jasso 1978; Jasso, Törnblom, & Sabbagh 2016), both the binary and the 11-point scale filter respondents rating their earnings as unjust into a follow-up question on the amount of just earnings. Thus, respondents choosing “no” in the binary response format or any value except for 0 (= “just”) on the 11-point scale are asked: “How high would your gross income have to be in order to be just?” with an open answer format asking for Euros per month.
With the introduction of an 11-point response format, the share of SOEP respondents who evaluated their gross earnings as just dropped to 49 percent in 2017 compared to 62 percent who evaluated their gross earnings as just in 2015 using the binary response scale. This considerable change in average justice evaluations may point to the relevance of measurement choices when assessing justice evaluations of earnings. Evidence on measurement equivalence across different rating scales generally suggests caution in comparing evaluations from different rating scales (Menold & Tausch 2016). In the applied case here, the pattern of more respondents evaluating their gross earnings as just on the binary scale compared to the 11-point scale may be due to stronger acquiescence or agreement biases on binary yes/no scales (e.g., Bentler, Douglas, & Messick 1971; Billiet & Davidov 2008; Krosnick & Presser 2010). Moreover, a binary yes/no response option may convey to respondents that researchers are only interested in severe instances of injustice (Knäuper 1998). Accordingly, the binary response format may pick up only strong injustice perceptions, while the 11-point response scale should pick up small injustice perceptions as well. However, systematic insights into how such measurement choices affect justice evaluations are missing. We address this gap by means of a survey experiment that was fielded as part of the Innovation Sample of the Socio-Economic Panel Study (SOEP-IS). Comparing justice evaluations from a split-ballot experiment, we asked if the choice of response scale—yes/no compared to an 11-point scale—affected the share of respondents who reported to be justly paid and follow-up questions on just earnings. Additionally, we asked if the 11-point scale succeeded in capturing more subtle deviations from the state of perfect justice compared to the binary format.
Data and methods
Data
We drew on a survey experiment that was fielded as part of the Innovation Sample of the Socio-Economic Panel Study (Richter & Schupp 2015) in 2016 (10.5684/soep.is.2019). SOEP-IS is a longitudinal general population survey fielded annually since 2011, with its starting cohort sampled from two subsamples of the SOEP-Core study. Additional random samples of private households in Germany were added to the SOEP-IS study in 2012, 2013, and 2014 (Richter & Schupp 2015; Zweck & Glemser 2018). All interviews in the 2016 SOEP-IS were conducted as computer-assisted personal interviews (CAPI) using showcards to display response options to respondents. Using a split-ballot design, 2562 respondents of SOEP-IS who reported to receive earnings from work were randomly allocated to one of two experimental groups: The first group received the binary response option and the second group received the 11-point scale response option. By comparing the share of those who evaluated their earnings as just, the just reward, and the intensity of reported injustice across conditions, we gained insights into the role of response format for measuring respondents’ sense of justice. Appendix Table A1 shows exact wording in English and German. Both groups first evaluated their gross earnings and subsequently their net earnings. We only report findings on gross earnings but substantive conclusions on the effect of response format were identical for net earnings (see Appendix Table A2).
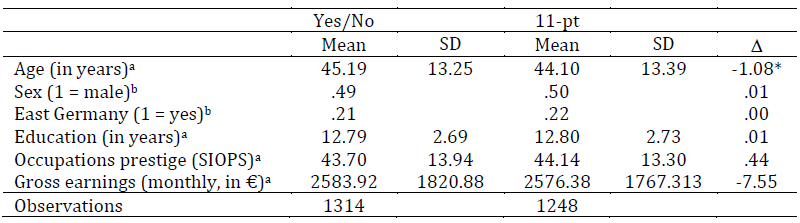
Table 1: Summary statistics, by experimental condition.
Data: SOEP-IS 2016. a Two-tailed t-test. bχ2-test. + p < .10, * p < .05, ** p < .01, *** p < .001
Comparing basic socio-demographic and employment-related characteristics across experimental conditions revealed that randomization was successful (see Table 1). On average respondents in the binary scale condition did not differ from those in the 11-point scale condition with respect to gender, living in East Germany, years spent in education, occupational prestige, or gross earnings. Yet, respondents in the binary condition, on average, were about one year older compared to respondents in the 11-point scale condition. Additional analyses corroborated that the effects of response format were unaffected by systematic differences in age across conditions.
Methods
Our main variables of interest were four measures of earnings justice commonly studied in empirical justice research. First, we investigated the effect of response format on the share of respondents who evaluated their earnings as just (the share of respondents that answered “yes” in the binary condition and those who answered 0 in the 11-point scale condition). Second, we investigated the effect of response format on the just earnings expressed in form of monthly gross earnings in Euro that would be considered just. All those respondents who evaluated their earnings as unjust were asked to state the level of earnings they would perceive as just. This is the observed just reward. Third, we calculated the hybrid just earnings, which included all respondents and used information on the actual earnings for those respondents who evaluated their earnings as just. This is common practice in empirical justice research and rests on the assumption that individuals perceive perfect justice if just earnings and actual earnings are perfectly matched (Jasso 1978). Information on actual earnings (A) and just earnings (C) were queried in an open response format and, therefore, prone to extreme outliers (e.g., accidently adding or dropping zeros). To avoid outliers driving our results, we trimmed responses at the 1st and 99th percentile. Fourth, following the justice evaluation function (Jasso 1978; Jasso, Törnblom, & Sabbagh 2016), we calculated the experienced justice evaluation J* = ln(A/C), using information on the hybrid just reward. Due to the natural logarithm, the experienced justice evaluation J* was zero for respondents who evaluated their earnings as just. Finally, we investigated the association between the justice of earnings and related earnings evaluations (i.e., appropriateness of earnings and earnings satisfaction) across experimental conditions. For this, we ran logistic regressions in which a dummy variable (indicating whether gross earnings were evaluated as just) was regressed on a measure of the appropriateness of earnings (or earnings satisfaction) and its interaction with the experimental condition. This allowed us to investigate if the 11-point scale captured more fine-grained evaluations compared to the binary format.
Results
Figure 1 shows the share of respondents who evaluated their gross earnings as just across experimental conditions. Among those who answered the question on the binary yes/no scale, 57.99 percent perceived their earnings as just. Among those who answered the question on the 11-point scale, only 49.76 percent perceived their earnings as just. This difference of 8.23 percentage points was statistically significant (χ2(1) = 17.46, p < .001). Therefore, the response-format systematically influenced the share of respondents evaluating their earnings as just.
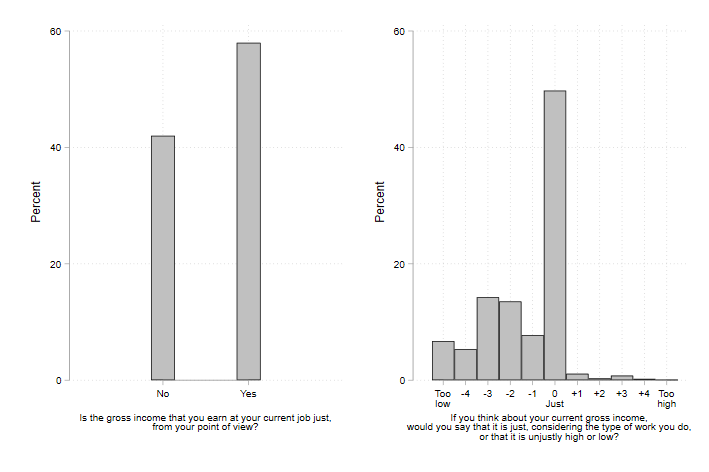
Figure 1: Share of respondents who evaluated their gross earnings as just, by response scale.
Data: SOEP-IS 2016. N = 2562. The share of missing values was 1.94 percent for the binary response format (left-hand panel) and .87 percent for the 11-point scale (right-hand panel).
As described above, in addition to the share of respondents who evaluated their earnings as just, we calculated two measures of the just reward—the observed and the hybrid just earnings—as well as the experienced justice evaluation J* (see Appendix Table A3 for summary statistics). The average observed just earnings did not differ significantly between the yes/no scale (M = 2908.77, SD = 1662.70) and the 11-point scale condition (M = 2971.14, SD = 1629.11), t(1089) = -.63, p = .53. The average hybrid just earnings were 2883.03 (SD = 1885.95) in the yes/no condition and 2869.66 (SD = 1804.15) in the 11-point condition. These hybrid just earnings did not differ significantly across experimental conditions (t(2319) = .17, p = .86), suggesting the reported just earnings were unaffected by the format of the filter question.
Figure 2 plots the distribution of the observed and hybrid monthly just gross earnings by experimental condition, showing largely similar patterns across the entire range of just earnings for both experimental conditions. Moreover, the mean justice evaluations J* in the yes/no scale condition (M = -.12, SD = .22) and the 11-point scale condition (M = -.14, SD = .25) did not differ significantly (t(2281) = 1.23, p = .22).
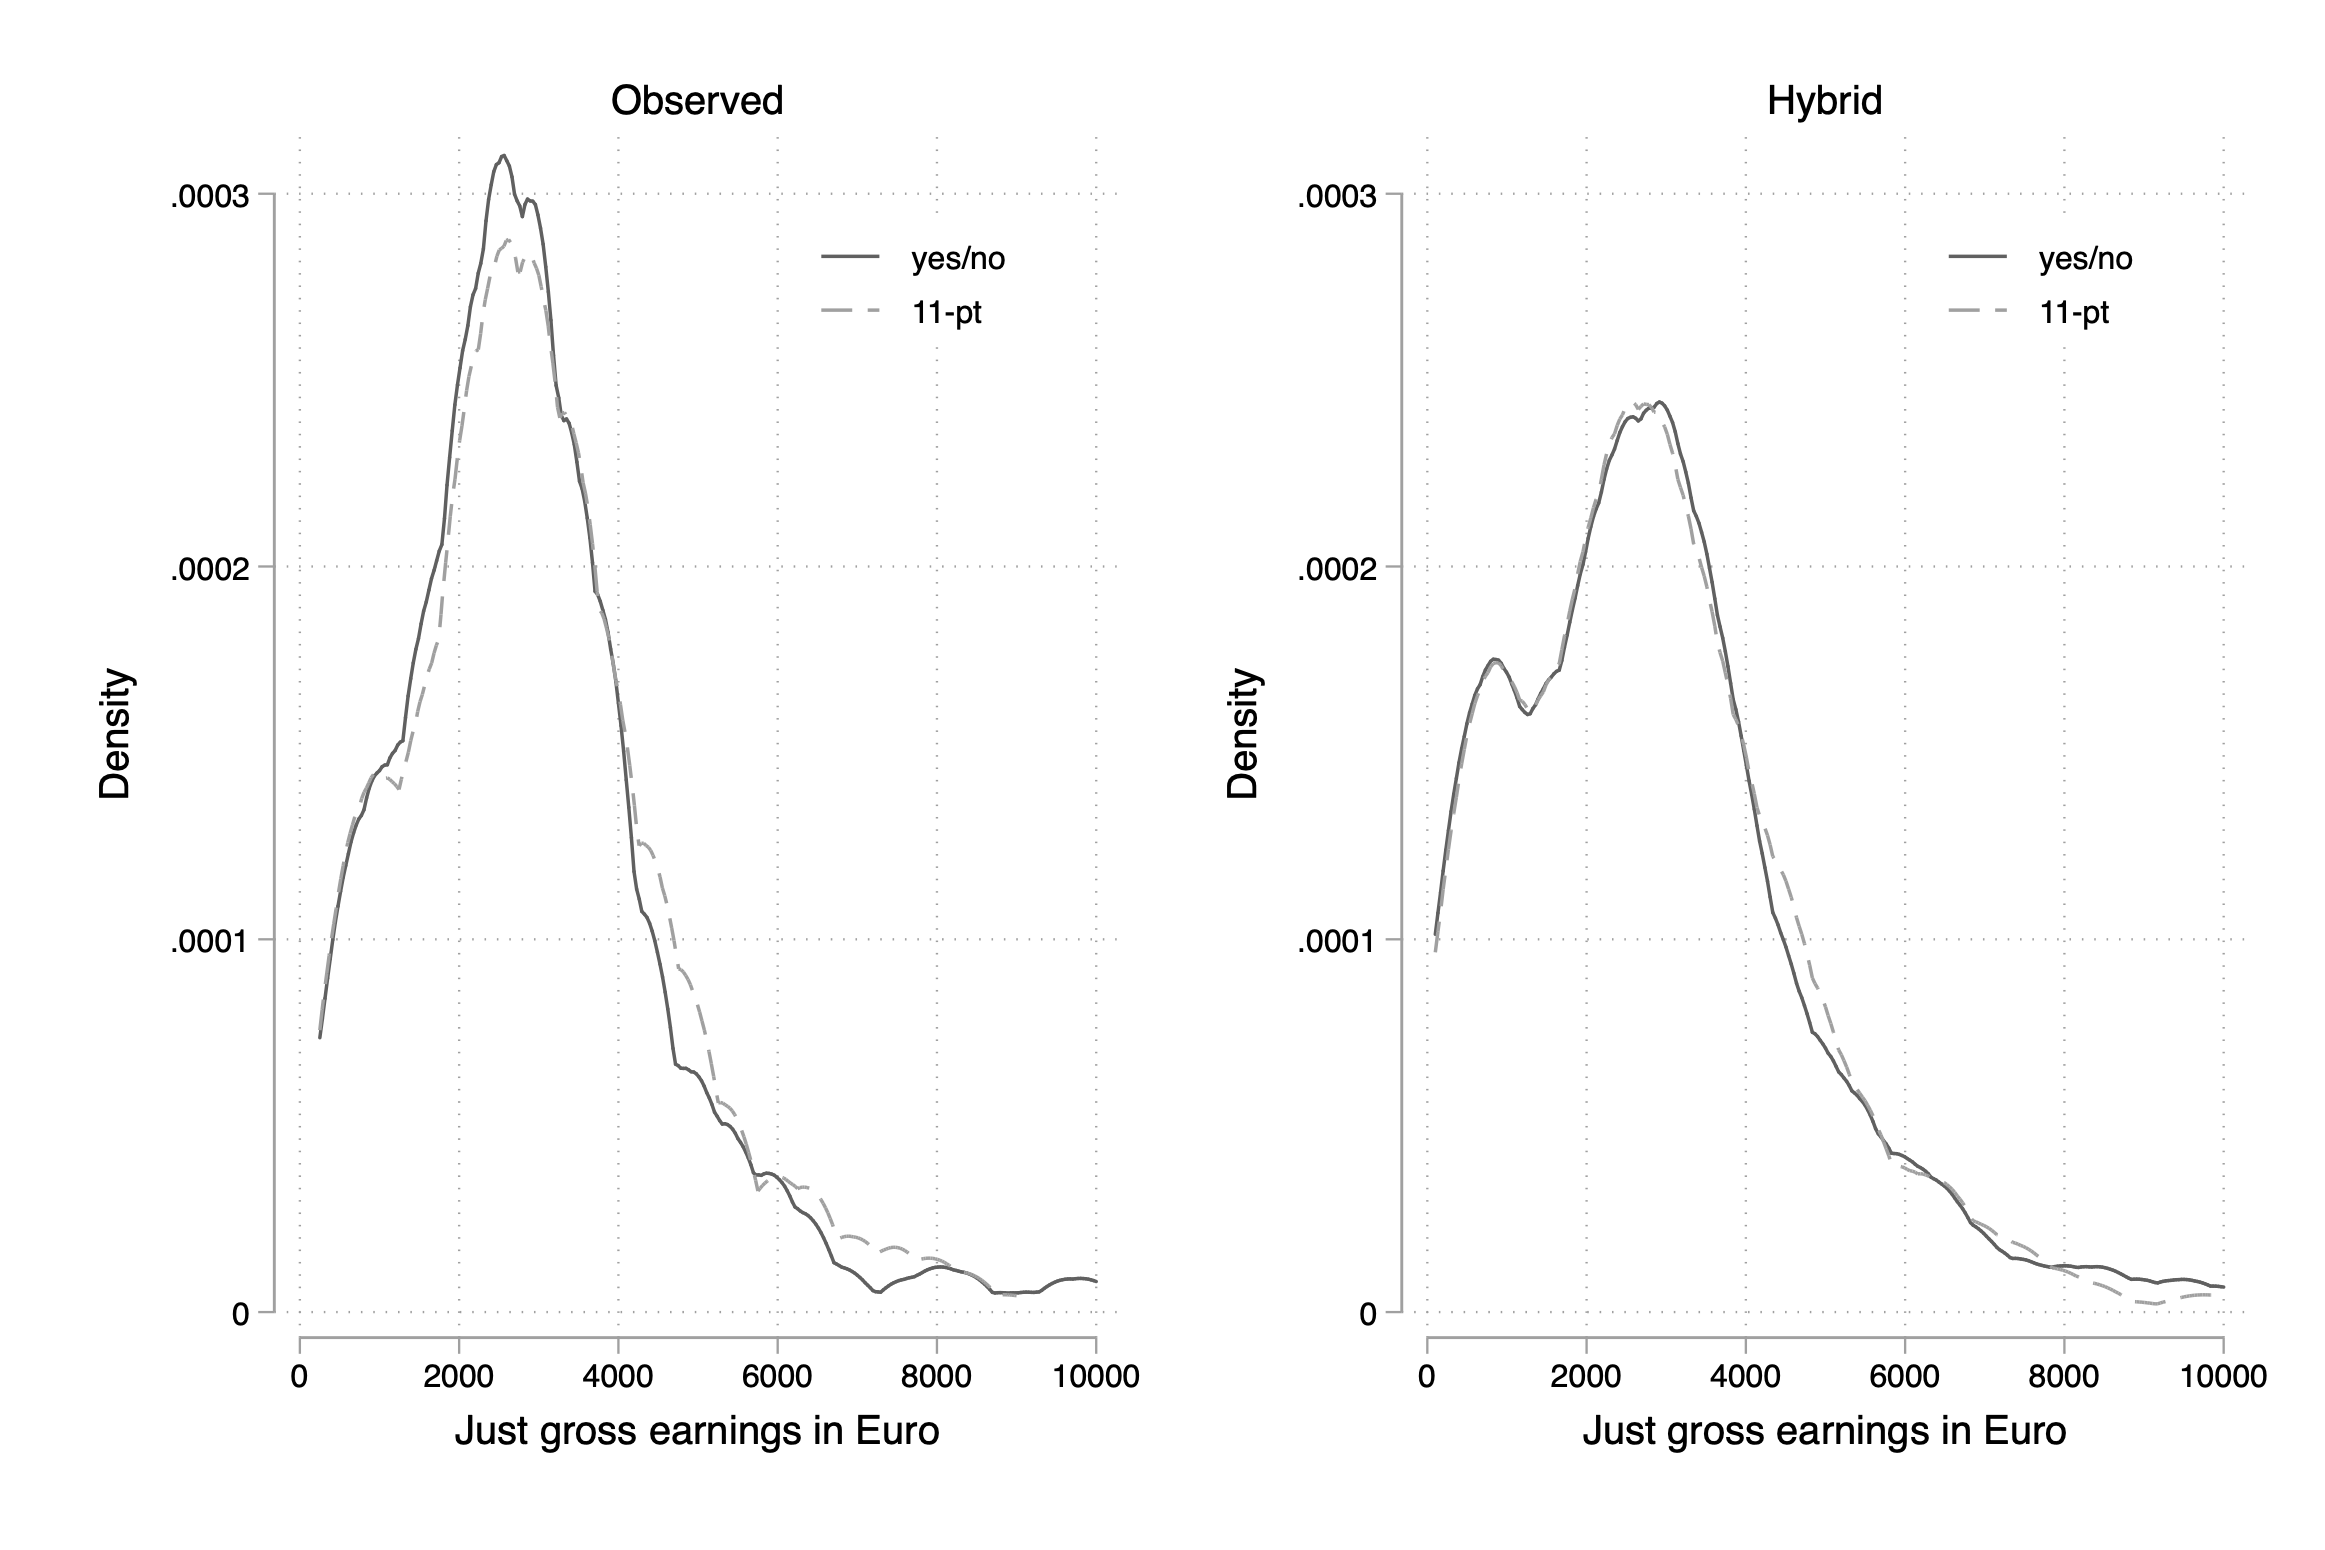
Figure 2: Observed and hybrid just gross earnings, by response scale.
Data: SOEP-IS 2016. N (observed) = 1091, N (hybrid) = 2321. Observed just gross earnings: Just gross earnings of respondents who evaluated their earnings as unjust. Hybrid just earnings include all respondents and used information on the actual earnings for those respondents who evaluated their earnings as just.
Association with related evaluations of earnings
Finally, we investigated if the 11-point scale succeeded in capturing more subtle deviations from the state of perfect justice compared to the binary format. Figure 3 shows predicted probabilities of evaluating one’s own gross earnings as just along with respondents’ agreement to the statement “When I consider all my accomplishments and efforts, my salary seems to be appropriate” for the two response formats. The predicted probabilities barely differed in the extreme ends of the appropriateness-spectrum (also see Appendix Table A4). This means, respondents, who strongly disagreed that their earnings were appropriate, almost never rated their earnings as just. This was the case in both response formats (χ2(1) = 1.76, p = .18). Similarly, respondents, who strongly agreed that their earnings were appropriate, predominantly rated their earnings as just in both response formats (χ2(1) = 1.14, p = .29). However, for the middle categories “disagree” (χ2(1) = 8.55, p < .01) and “agree” (χ2(1) = 12.52, p < .001), predicted probabilities to rate earnings as just were significantly lower in the 11-point format than in the binary format. Consequently, respondents with ambiguous feelings regarding the justice of their earnings were more likely to rate their earnings as just if confronted with a binary choice. Similar respondents were more likely to differentiate their injustice ratings on the 11-point scale.
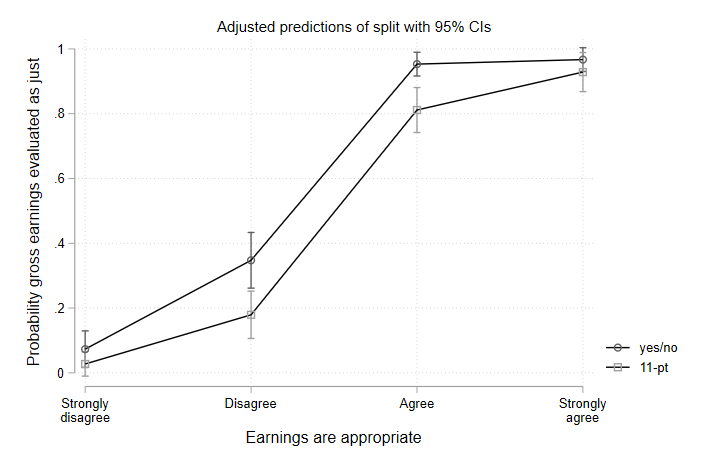
Figure 3: Association of likelihood to evaluate earnings as just with appropriateness of earnings, by response scale
Data: SOEP-IS 2016. N = 790. Displayed are predicted probabilities (with 95-% confidence intervals) based on a logistic regression, where the likelihood to evaluate one’s own earnings as just was regressed on the perception of appropriateness of earnings and its interaction with the experimental condition. As the single-item measure on the appropriateness of earnings was only fielded in a subsample of the SOEP-IS, the number of observations for this analysis decreased compared to the full sample. Predicted probabilities are presented in Appendix Table A4.
We further studied the association of respondents’ justice evaluation and their earnings satisfaction measured on an 11-point scale ranging from “completely dissatisfied” (0) to “completely satisfied” (10). We found that respondents in the yes/no condition who were satisfied with their earnings—scoring 6 or higher—were more likely to evaluate their earnings as just compared to respondents in the 11-point condition (see Figure 4 and Appendix Table A4). For respondents who were dissatisfied with their earnings, no such differences between scale conditions was observed. Our findings therefore indicated that the 11-point scale captured more subtle nuances of injustice.
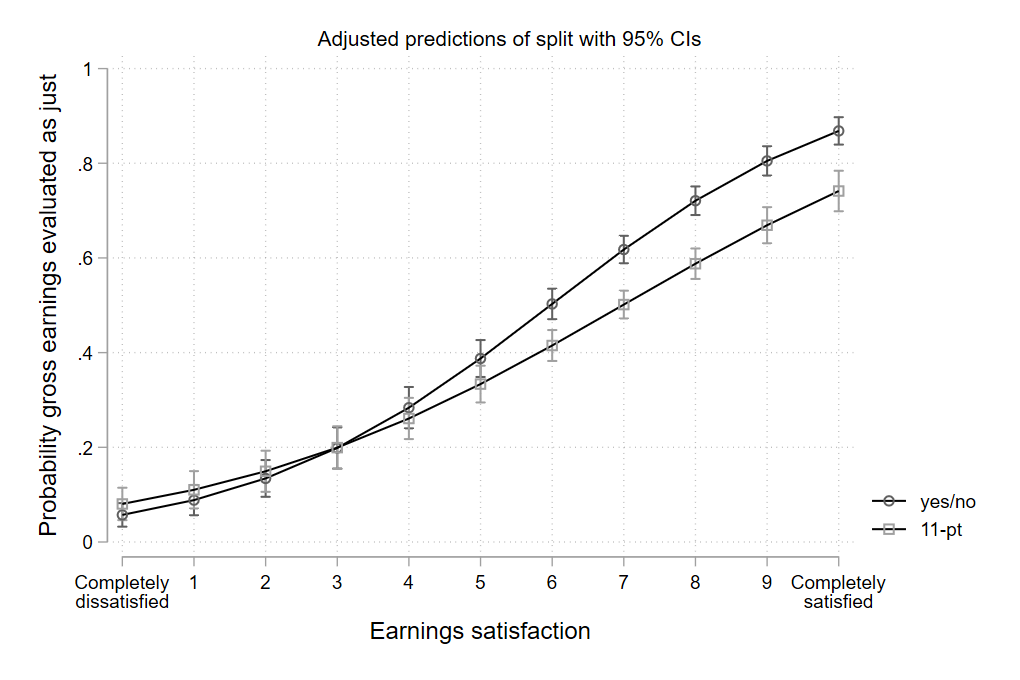
Figure 4: Association of likelihood to evaluate earnings as just with earnings satisfaction, by response scale.
Data: SOEP-IS 2016. N = 2557. Displayed are predicted probabilities (with 95-% confidence intervals) based on a logit regression, where the likelihood to evaluate one’s own earnings as just was regressed on earnings satisfaction and its interaction with the experimental condition. Predicted probabilities are presented in Appendix Table A4.
Conclusion and Discussion
Addressing the need for clarification on the role of measurement choices in assessing the perceived justice of earnings, we analysed a split-ballot experiment in a random sample of German adults. Findings from the SOEP-IS underscored that the share of respondents who evaluated their own gross earnings as just varied systematically by response format. Fewer respondents evaluated their earnings as just in the 11-point scale condition compared to the binary condition. Question wording in the yes/no condition that emphasized justice but not injustice, may have led respondents to provide a satisficing “yes” response. Moreover, we found supportive evidence that the observed differences were related to respondents with ambiguous feelings regarding their earnings being more likely to report their earnings to be just in the binary response format. This method effect also suggests that the observed drop in individuals who evaluated their earnings as just between 2015 and 2017 in the SOEP must—at least partially—be attributed to changes in measurement. Follow-up questions on just earnings seemed, however, more robust to changes in the response scale as neither just earnings nor the derived justice evaluation J* varied systematically by experimental condition. This suggests that time-series information on just earnings in the SOEP are robust to the implemented changes in response scale while the share of respondents who consider themselves justly paid is sensitive to such changes.
Survey methodologists warn that respondents may understand varying rating scales differently and that researchers therefore cannot assume that the same latent variable is measured (Menold & Tausch 2016). From this perspective, it might be advisable to refrain from comparing results based on different scales entirely. However, for practitioners in the field, such comparisons within and between surveys are often the only possibility to approach important research questions. Based on our experimental results, we advise researchers to refrain from comparing aggregate measures on the justice of earnings between and within surveys if there are differences in response scales. Moreover, they should also consider that binary response formats may not pick up small deviations from the state of perfect justice. More elaborate measures of earnings justice that use information on just earnings seem more robust to changes in measurement. This suggests that the SOEP time-series on just earnings spanning 2005 to 2019 is intact. Survey organizers in the field should carefully consider the effect of changes in response scale, including the effect on follow-up questions (also see Menold & Tausch 2016). In any case, they should clearly flag such changes in their survey documentation and, if possible, use survey experiments to understand the effects of the implemented changes.
References
- Adriaans, J., & Targa, M. (2022). “Gender Differences in Fairness Evaluations of Own Earnings in 29 European Countries.” European Societies (online first). https://doi.org/10.1080/14616696.2022.2083651
- Auspurg, K., Hinz, T., & Sauer, C. (2017). “Why Should Women Get Less? Evidence on the Gender Pay Gap from Multifactorial Survey Experiments” American Sociological Review 82(1): 179-210. https://doi.org/10.1177/0003122416683393.
- Bentler, P. M., Douglas, J. N., & Messick, S. (1971). “Identification of Content and Style: A Two-dimensional Interpretation of Acquiescence.” Psychological Bulletin 76 (3): 186-204.
- Billiet, J. B., & Davidov, E. (2008). “Testing the Stability of an Acquiescence Style Factor Behind Two Interrelated Substantive Variables in a Panel Design.” Sociological Methods & Research 36 (4): 542-562. https://doi.org/10.1177/0049124107313901.
- Falk, A., Menrath, I., Verde, P. E., & Siegrist, J. (2011). “Cardiovascular Consequences of Unfair Pay.” IZA Discussion Paper 5720.
- Jasso, G. (1978). “On the Justice of Earnings: A New Specification of the Justice Evaluation Function.” American Journal of Sociology 83 (6): 1398-1419.
- Jasso, G. (2007). “Studying Justice: Measurement, Estimation, and Analysis of the Actual Reward and the Just Reward.” In Distributive and Procedural Justice. Research and Applications, edited by Kjell Törnblom & Riel Vermunt, 225-253. London: Routledge.
- Jasso, G., Törnblom, K., & Sabbagh, C. (2016). “Distributive Justice.” In Handbook of Social Justice Theory and Research, edited by Clara Sabbagh & Manfred Schmitt, 201-218. New York: Springer.
- Jasso, G., & Wegener, B. (2021). “An empirically based just linear income tax system.” The Journal of Mathematical Sociology. https://doi.org/10.1080/0022250X.2020.1859501.
- Knäuper, B. (1998). “Filter Questions and Question Interpretation.” Public Opinion Quarterly 62: 70-78.
- Krosnick, J. A., & Fabrigar, L. R. (1997). “Designing Rating Scales for Effective Measurement in Surveys” In Survey Measurement and Process Quality, edited by Lars Lyberg, Paul Biemer, Martin Collins, Edith De Leeuw, Cathryn Dippo, Norbert Schwartz & Dennis Trewin. 141-164. New York: John Wiley.
- Krosnick, J. A., & Presser, S. (2010). “Question and Questionnaire Design.” In Hanbook of Survey Research, edited by Peter V. Marsden & James D. Wright, 263-313. Bingley: Emerald.
- Liebig, S., & Sauer, C. (2016). “Sociology of Justice.” In Handbook of Social Justice Theory and Research, edited by Clara Sabbagh & Manfred Schmitt, 37-60. New York: Springer.
- Maitland, A. (2009). “How Many Scale Points Should I Include for Attitudinal Questions?” Survey Practice 2 (5), 1-5. https://doi.org/10.29115/SP-2009-0023.
- Menold, N. & Bogner, K. (2016). “Design of Rating Scales in Questionnaires” GESIS Survey Guidelines. GESIS – Leibniz Institute for the Social Sciences. http://dx.doi.org/10.15465/gesis-sg_en_015
- Menold, N. & Tausch, A. (2016). “Measurement of Latent Variables With Different Rating Scales: Testing Reliability and Measurement Equivalence by Varying the Verbalization and Number of Categories” Sociological Methods & Research 45(4): 678-99. http://doi.org/10.1177/0049124115583913.
- Narisada, A. (2020). “Job Pressure, the Work-Family Interface, and the Sense of Distributive Injustice: An Elaboration of Work-Related Inputs among Twenty-First Century Workers.” Social Psychology Quarterly 83 (2): 107-128. https://doi.org/10.1177/0190272519874294.
- Pfeifer, C., & Stephan, G. (2019). “Why Women Do Not Ask: Gender Differences in Fairness Perceptions of Own Wages and Subsequent Wage Growth.” Cambridge Journal of Economics 43: 295-310. https://doi.org/10.1093/cje/bey035.
- Richter, D., & Schupp, J. (2015). “The SOEP Innovation Sample (SOEP IS).” Schmollers Jahrbuch: Journal of Applied Social Science Studies / Zeitschrift für Wirtschafts- und Sozialwissenschaften 135 (3): 389-400.
- Sauer, C., & May, M. J. (2017). “Determinants of just earnings: The importance of comparisons with similar others and social relations with supervisors and coworkers in organizations.” Research in Social Stratification and Mobility 47: 45-54. https://doi.org/10.1016/j.rssm.2016.05.003.
- Sauer, C., & Valet, P. (2013). “Less is Sometimes More: Consequences of Overpayment on Job Satisfaction and Absenteeism.” Social Justice Research 26 (2): 132-150. https://doi.org/10.1007/s11211-013-0182-2.
- Schneck, S. (2014). “My Wage is Unfair! Just a Feeling or Comparison with Peers?” Review of Behavioral Economics 1 (3): 245-273. https://doi.org/10.1561/105.00000012.
- Schneider, H. (2018). “Wahrgenommene Lohngerechtigkeit in Deutschland. Leistung, Bedarf, Chancengerechtigkeit – Worauf basieren gerechte Löhne?” List Forum für Wirtschafts- und Finanzpolitik 44: 357–378.
- Schneider, S. M., & Valet, P. (2017). “Relative Standards and Distributive Justice: How Social Comparison Orientations Moderate the Link between Relative Earnings and Justice Perceptions.” Social Psychology Quarterly 80 (3): 276-287. https://doi.org/10.1177/0190272517708810.
- Schröder, M. (2017). “Is Income Inequality Related to Tolerance for Inequality?” Social Justice Research 30: 23-47. https://doi.org/10.1007/s11211-016-0276-8.
- Schunck, R., Sauer, C., & Valet, P. (2015). “Unfair Pay and Health: The Effects of Perceived Injustice of Earnings on Physical Health.” European Sociological Review 31 (6): 655-666. https://doi.org/10.1093/esr/jcv065.
- Tao, H.-L. (2015). “Multiple Earnings Comparisons and Subjective Earnings Fairness: A Cross-country Study.” Journal of Behavioral and Experimental Economics 57: 45-54. https://doi.org/10.1016/j.socec.2015.04.002
- Zweck, B., & Glemser, A. (2018). “SOEP-IS 2016 – Methodenbericht zum Befragungsjahr 2016 des SOEP-Innovationssamples.” SOEP Survey Paper Series 481: Series B.
-
Keywords
calibration CATI coverage coverage bias cross-national surveys data linkage data quality European Social Survey experiment face-to-face face-to-face survey Facebook hard to reach populations incentives item nonresponse measurement measurement error mixed-mode surveys multitasking non-probability samples Nonresponse nonresponse bias nonresponse rates paradata PIAAC Probability sample probability samples QR codes rare populations response rate Satisficing social desirability Social media survey survey-taking climate survey data survey management survey methods Telephone survey telephone surveys total survey error unit nonresponse validity web survey Web surveys weighting
