

An overview of the scales’ characteristics for 10 well-established face-to-face social science surveys
Asensio Manjon, M., Revilla, M. & Weber, W. (2022). An overview of the scales’ characteristics for 10 well-established face-to-face social science surveys. Survey Methods: Insights from the Field. Retrieved from https://surveyinsights.org/?p=16693
© the authors 2022. This work is licensed under a Creative Commons Attribution 4.0 International License (CC BY 4.0) 
Abstract
Many studies were conducted to help researchers designing high quality surveys. Testing theoretical considerations, these studies create empirical evidence that should serve for guidance. However, we often come across surveys that do not follow those literature recommendations. While this might be due to the trade-offs between data quality, comparability (across time or countries), and costs, in this paper, we provide information about the scales used in practice by 10 well-established social science face-to-face surveys. We found that: 1) agree/disagree scales are used in all 10 surveys but in a maximum of 15.7% of the items; 2) most attitude or belief questions use between two and six answer categories; 3) while some surveys use few grids, others use them commonly. 4) check-all-that-apply is very little used in all surveys; 5) fixed reference points are often used but not for all the answer categories for which they would be possible. Such an overview can help researchers by shedding light on the current survey practice in key social science surveys. Overall, it suggests researchers should not simply copy questions from these surveys when designing their own questionnaire; instead they should first evaluate their quality.
Keywords
face-to-face mode, practical implementation, questionnaire design, response scales, social science surveys
Copyright
© the authors 2022. This work is licensed under a Creative Commons Attribution 4.0 International License (CC BY 4.0)
1. Introduction
Since decades, surveys have been the main source of data in many studies (Saris and Gallhofer, 2014). How surveys are designed matters 1) for respondents, a bad experience participating in one survey can lead to break-off and/or discourage respondents to participate in future surveys; and 2) for researchers, since it affects the representativeness (who participates, who breaks-off) and data quality (item non-response, non-differentiation, etc.), and may therefore affect the substantive conclusions reached (Saris and Gallhofer, 2014).
Therefore, a lot of literature has been produced to help researchers designing high quality surveys (e.g. Schuman and Presser, 1981; Sudman and Bradburn, 1982; Alwin and Krosnick, 1991; Alwin, 2007; Dillman, 2011; Saris and Gallhofer, 2014). This literature discussed the numerous choices that have to be made when designing a questionnaire (number of answer categories, use of labels, etc.), and used empirical data (mainly survey experiments) to study the impact of some of these decisions on data quality, measured in different ways.
Previous literature also focused on providing practical recommendations and specifying best practices on how to design questionnaires to maximize data quality, representativeness, and respondents’ satisfaction with their survey participation.
Even when these recommendations are clear and there is large agreement about what the best practices are, we can find discordance between what is done in practice and what the literature recommends. For instance, many studies recommend to avoid the use of agree/disagree (from now on A/D) items, in which a statement is presented, and respondents are asked to what extent they agree/disagree with this statement (e.g. Krosnick, 1991; Alwin, 2007; Saris et al., 2010; Revilla and Ochoa, 2015; Höhne, Revilla and Lenzer, 2018). However, Revilla (2017) found that 39.2% of the surveys implemented in an opt-in online panel in Spain included A/D items. Thus, there is a gap between the academic literature recommendations and the way questions are designed in practice, which might be due to the necessity to do trade-offs between data quality, comparability (across waves or countries), and costs.
In this paper, our main goal is to provide information about the response scales used in practice by 10 well-established social science surveys conducted by face-to-face, mainly in Europe and America. We focus on five aspects: the response scales’ evaluative dimension (A/D or item specific), the number of answer categories, the use of grids, of check-all-that-apply format (CATA), and of fixed-reference points. We selected these aspects because 1) the agreement in the literature about what is preferable is high and 2) their impact on data quality seems to be important (Smyth et al. 2006; Saris and Gallhofer, 2007; DeCastellarnau, 2018). Section 2 presents the main recommendations that the literature provides for each of these five aspects. Then, Section 3 presents the data used in this study, Section 4 explains how the analyses were done, and Section 5 reports the main results. Finally, Section 6 concludes.
2. Recommendations from the literature
2.1 Avoid A/D scales
The first aspect is the scales’ evaluative dimension. The literature differentiates A/D and item-specific (IS) questions. The format of A/D questions is always the same: first a statement is presented (e.g. “I am satisfied with my life”) accompanied by a dis/agree scale, commonly featuring different levels of intensity. In contrast, IS questions are usually formed by a request for an answer (e.g. “Are you satisfied with your life?”) and an answer scale matching the concept under evaluation (e.g. dissatisfied to satisfied).
A/D questions are quicker to design, since all questions use a similar scale, whatever the concept to be measured. Only the statement needs to be formulated. A/D questions often present the request for an answer only once, followed by several items for which the respondents need to say to what extent they agree/disagree.
However, the literature recommends to avoid A/D questions and use instead IS ones, for different reasons. First, the cognitive process is more complex for A/D than IS questions (Saris et al., 2010; Revilla, Saris and Krosnick., 2014; Kunz, 2017). Second, the use of A/D questions leads to weariness (Höhne, Schlosser and Krebs, 2017) because the format remains the same except for the statement to be judged. Furthermore, acquiescence bias (a tendency to agree with any statement) is expected with A/D scales (Schuman and Presser, 1981). Moreover, results differ depending on the statement used (e.g. “I am satisfied with my life”, versus “I am dissatisfied with my life”). Finally, A/D questions have lower measurement quality (Saris et al., 2010; Revilla and Ochoa, 2015).
2.2 Use 6 to 11 answer categories for IS scales and maximum 5 for A/D scales
The decision about the number of scale points depends on the type of variables and the scales’ evaluative dimension (A/D or IS).
Concerning the type of variables, following Dillman (1978), we distinguish between questions measuring behaviors, attitudes, beliefs and attributes: behavioral questions are about people’s actions (what they have done, currently do, or plan to do). Attitude questions are about what people (dis)like requiring them to indicate whether they have positive or negative feelings. Belief questions are about what people think is true or false eliciting their perceptions of past, present, or future reality. Finally, attributes questions are related with personal or demographic characteristics.
One of the most important rules to design an effective answer scale is to make it complete (Krosnic and Presser, 2010): the answer scale has to cover all possible options. When measuring attributes or behaviors, the adequate number of scale points depends on the object measured. For example, if the interest is in which region the respondent lives, all regions in a given country have to be offered as response categories. When it comes to attitude or belief questions, we have to differentiate between A/D and IS questions to decide about the scale length (Revilla et al., 2014).
Literature concerning attitude or belief IS questions suggests using six to 11 points (Alwin and Krosnick, 1991; Alwin, 1997; Asensio and Revilla, 2021; Revilla et al. 2014; Saris and Gallhofer, 2014; Revilla and Ochoa, 2015). On one hand, the theory of information (Garner, 1960) states that for bipolar concepts, while 2-point scales measure the direction of an attitude or belief, 3-point scales (and longer scales with odd numbers) also measure the neutral middle point, and scales with more points additionally measure the intensity of the attitude or belief. Moreover, Alwin and Krosnick (1991) suggest that enough answer categories are needed to allow scale differentiation. With too few categories, people with different true values may have to answer the same as there are no more option to choose from. On the other hand, the literature does not recommend more than 11 points because more categories can lead to ambiguity and non-discrimination between categories (Schaeffer and Presser, 2003; Krosnick and Presser, 2010).
For A/D scales, even though such scales are not recommended (see section 2.1), Revilla et al. (2014) found that five points is better than seven and 11 points. Furthermore, for A/D scales, having five points instead of more, reduces the extreme response style bias, understood as the tendency to disproportionally use the extreme response categories in a rating scale (Weitjers, Cabooter and Schillewaert, 2010).
2.3 Avoid grid format
Most questions are presented using an item-by-item format. However, when a set of questions shares the same response scale, it is possible to use a grid format. Then, the main request for an answer (e.g. “How much do you trust the following institutions?”) and the response scale (e.g. 0 “No trust” to 5 “Complete trust”) are usually repeated only once for a series of items (e.g. the parliament, the legal system, the police).
In visual modes of data collection (e.g. web or face-to-face using showcards), the items are usually presented in rows, while the common set of response options is usually presented in columns (Couper et al., 2013, p. 322).
Grid format allows the information (Revilla, Toninelli and Ochoa, 2016) to be condensed, which can be timesaving for respondents. Indeed, completion times are lower for grids than item-by-item formats (Couper, Traugott and Lamias, 2001; Bell, Mangione and Kahn, 2001; Tourangeau, Couper and Conrad, 2004). Furthermore, higher inter-item correlation has been found when using grids (Tourangeau et al., 2004). This is often seen as an indicator of higher quality, as it improves the reliability (Ferketich, 1991).
However, many studies recommend avoiding grids for different reasons (Poynter, 2001; Wojtowicz, 2001; Dillman, 2011). First, shorter completion times seem to be due to respondents not putting enough efforts into answering the questions, and not to the task being easier. For instance, Couper et al. (2013) suggested that shorter completion times may be consequence of choosing the same answer category for all items which is a suboptimal responding strategy known as non-differentiation or straightlining. Other studies showed that grid formats tend to increase the number of missing items (Iglesias, Birks and Torgerson, 200; Manfreda, Batageli and Vehovar, 2002), which in turn, can also reduce completion times. Toepoel et al. (2009) showed that this item-missing trend systematically increased with the number of items inside the same grid. Second, the higher inter-item correlations in grids, which was sometimes considered as an indicator of higher quality, seems to be due to higher non-differentiation and systematic measurement errors (Peytchev, 2005). Third, respondents’ satisfaction with their survey experience decreases when grids are used (Thorndike et al., 2009; Toepoel et al., 2009). This, in turn, can lead those respondents to refuse to participate in future surveys. Finally, the use of grids increases respondents’ break-off rates (Puelston and Sleep, 2008).
2.4 Avoid check-all-that-apply formats
Check-all-that-apply (CATA) is a question format where respondents are asked to select from a list all the options applying to them (Smyth et al., 2006). For instance, “Please, indicate all the devices you use to go online: PC, tablet, smartphone”. The alternative to this format is usually called “forced-Choice”: in this case, the respondents are asked to provide an answer (typically yes or no) for each item in the list (Smyth et al., 2006). For instance, “Do you use the following devices to go online: PC? Yes/No; Tablet? Yes/No; Smartphone? Yes/No”. However, it is possible to add an option “prefer not to answer” or even to let respondents continue without providing an answer when using a “forced-Choice” format.
In oral modes like face-to-face it might be difficult to distinguish between CATA and forced-choice. However, when the face-to-face interviews use showcards, then the distinction is clearer.
CATA items are common in surveys mainly for two reasons: completion times are shorter (Sudman and Bradburn, 1982) and the design is efficient, in the sense that it allows respondents to select several options (Smyth et al., 2006). However, the literature recommends avoiding CATA format because, first, its nature encourages weak satisficing of the respondents, who tend to report less items than in forced-choice formats (Smyth et al., 2006; Jaeger et al., 2014). Even if the higher reporting in forced-choice formats could be partly due to acquiescence bias, forced-choice has a higher external validity (Revilla, 2015). Lau and Kennedy (2019) results based on undesirable but common events (lost job or being arrested) also suggest that respondents report less items than they should in the CATA format. Second, the longer response times for forced-choice formats can be positive, if due to a more careful answer process. Finally, the meaning of not selecting an option in the CATA format is unclear: it could be that the option effectively does not apply to the respondents, that respondents are neutral, or that they overlooked it (Sudman and Bradburn, 1982). In contrast, forced-choice formats allow better differentiation because options are marked negatively (Smyth et al., 2006).
2.5 Use fixed reference points
Fixed reference points are labels that “set no doubt about the position of the reference point on the subjective scale in the mind of the respondent” (Saris and Gallhofer, 2014, p.110). For example, words as “completely” or “extremely” define an abstract object to its maximum value, whereas other words such as “slightly” or “somewhat” can be interpreted in different ways by the respondents.
In behavioral questions, it is often possible to use fixed reference points for each answer category, for instance when measuring a frequency (e.g., “once a week”, “twice a week”, etc), or a duration (e.g. “0h00 to 5h00”, “5h01 to 10h00”, etc.), instead of using vague quantifiers (e.g. “often” or “a lot”). For attitude and belief questions, fixed reference points are usually possible for the end points and, for bipolar concepts, the midpoint. Attribute questions usually use fixed reference points for all answer categories (e.g. regions, education, income).
The literature recommends the use of fixed reference points whenever possible. First, when fixed reference points are not provided respondents might interpret the answer categories differently. Then, the assumption of equality of the response function does not hold, i.e. respondents with different true values can chose the same answer category, and respondents with similar true values can chose different answer categories (Saris and De Rooij, 1988). These variations in the response function can be prevented to a large extent by using at least fixed reference points for the end points of the scale (Saris et al., 1988; Batista-Foguet and Saris, 1988).
Second, when the response function has been equalized due to the use of fixed reference points, the measurement error that may arise from its variation is reduced (Scherpenzeel, 2003). In line with this, Revilla and Ochoa (2015) found that the use of two fixed reference points in the end points slightly increases measurement quality.
3. Data
We selected 10 well-established surveys, recognized for their quality and contribution to the production of knowledge across the world. All surveys cover broad social sciences topics and are implemented as face-to-face interviews with showcards across different countries, mainly in Europe, Latin America, and the USA.
We focus on face-to-face surveys because they are usually considered the ones with highest data quality and because most of the studies that studied the impact of changing the response scales and allowed to formulate recommendations were conducted face-to-face. Moreover, we focus on Europe and America because literature concerning survey methods has been mostly produced using data from these areas. It is not clear whether the current recommendations from the survey methodology literature apply in a similar way for other areas using different languages, alphabets, and linguistic rules (e.g. Arab or Asiatic countries).
The selected surveys are the following: Las Américas y el Mundo (AMERICAS), European Social Survey (ESS), Eurobarometer (EURO), European Values Study (EVS), General Social Survey (GSS), Proyecto de Opinión Pública de América Latina (LAPOP), Latinobarómetro (LATINOBAR), Quality of life in European Cities – Flash Eurobarometer (QEC), Survey of Health, Ageing and Retirement in Europe (SHARE), and World Values Survey (WVS). Table 1 provides information about each of them.
Table 1. Overview of the key characteristics of the selected surveys and their questionnaires
Most of these surveys exist for many years. However, we are interested in the current state of their questionnaires, to compare it with the current recommendations of the literature. Thus, we analyzed the last questionnaire available in each case when this research was conducted (2019).
4. Analyses
First, we retrieved the last questionnaires available from the surveys’ websites. From those questionnaires, we coded the following characteristics for each question:
- Type of variables according to Dillman’s (1978) distinction, i.e. attributes, behaviors, attitudes or beliefs. This was necessary as some recommendations apply only to some question types.
- Scales’ evaluative dimension: for behaviors, attitudes, and beliefs, we coded if the questions used an A/D or IS format. Some questions were also open-ended, asking for a number or a text answer. In those cases, we coded the question as a text or number question. We report the percentage of A/D items out of all behavioral, attitude, and belief questions in each survey, as well as the percentage of A/D items when excluding behavioral questions, since the use of A/D is often not adapted for behaviors.
- Number of answer categories: for closed questions (A/D and IS), we studied the number of answer categories. Only the answers predefined in the scale were counted. For example, in the LAPOP questionnaire, for the question “How do you think your economic situation will be next year?” (S8), we counted two answer categories (Better/Worse) even though spontaneous answers such as “As good as now” were accepted as valid answers. We report the percentage of attitude and belief questions (since these are the questions for which the literature recommendations hold) with a determined number of scale points, (from two to “12 or more”). We distinguish between A/D and IS since the literature provides different recommendations for both.
- Use of grid formats: if two or more questions were presented in rows (as depicted in the questionnaires documents) with the same scale in columns, we considered that set of questions as belonging to a grid. We report, for each questionnaire, the total number of grids, the mean and maximum number of items per grid, and the percentage that grid items represented out of all questionnaire items. All surveys used showcards implying that respondents got a visual stimulus for answering those grids. However, this visual stimulus varied across surveys and questions: in some cases, it was the scale that applied to all items in the grid; in others, the list of items for which a determined scale applied; still in others, both.
- Check-all-that-apply format: if two or more items were presented together in one multiple choice question where respondents had to select all the items applying to them, we considered that set of items as being a CATA. The showcards normally presented all the items for a determined CATA question. We report, for each questionnaire, the number of CATA, the mean and maximum number of response options in it, and the percentage that CATA items represented out of all questionnaire items.
- Fixed reference points: here we focused on scales where the survey designer has the choice between fixed and non-fixed reference points for at least some of the answer categories, such as scales measuring the intensity of an abstract object or the frequency of a behavior. We do not report the number of fixed reference points because the maximum possible vary across questions: for many behavioral questions, each category can be a fixed reference point, whereas, for attitude or belief questions, commonly only the extremes and middle neutral category (for bipolar scales) can be fixed reference points. Therefore, we report the percentage of attitude, belief, and behavioral items with no fixed reference points, at least one fixed reference point but not all possible ones, and all possible fixed reference points. Attributes are not considered since there is usually no choice.
5. Results
5.1 A/D and IS questions
First, Table 2 shows, per survey, the percentages of A/D items out of all survey items, and out of all attitude and belief items because to measure attributes and behaviors, A/D items are not appropriate.
Table 2. Presence of A/D items
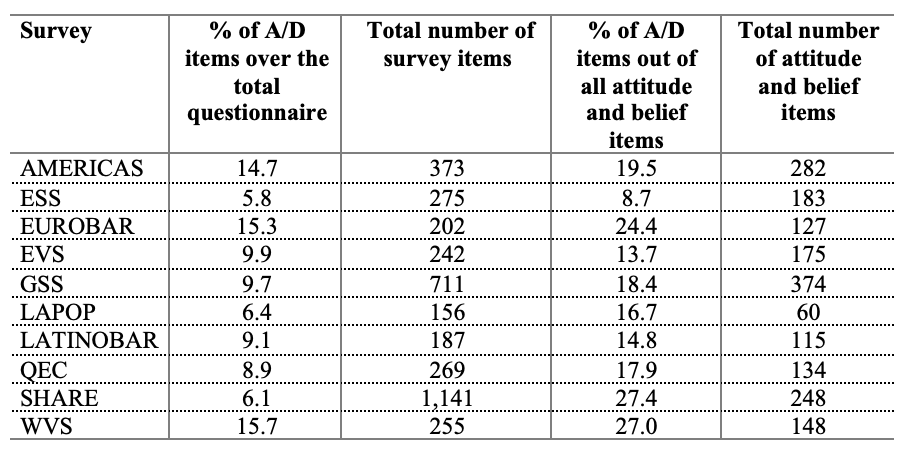
Table 2 confirms that A/D items are right now a reality in well-established face-to-face surveys. Indeed, no survey has less than 5% of A/D questions overall, and less than 8% when focusing on attitude and belief questions. However, their presence varies across the surveys: it ranges from 5.8% in the ESS to 15.7% in the WVS overall, and from 8.7% in the ESS to 27.4% in SHARE when focusing only on attitudes and beliefs.
5.2 Number of answer categories
Tables 3 and 4 present the proportions of scales with different numbers of answer categories for attitude and belief closed-ended questions, both for IS and A/D scales.
Table 3. Percentage of scales with different numbers of answer categories in attitude/belief IS questions
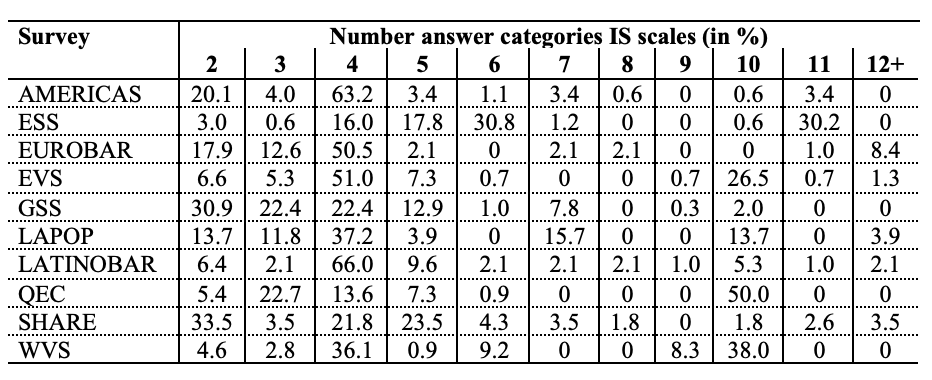
Table 3 shows that, in the 10 surveys studied, most IS attitude or belief questions use between two and six answer categories.
The election of seven answer categories is less than 5% in eight out of the 10 surveys, and zero in two of them. The LAPOP is the only survey using seven categories to a moderate extent (15.7%). Similarly, the use of 11 answer categories is lower than 5% for all surveys except the ESS (30.2%). Nine answer categories are even less common, with a maximum of 8.3% in the WVS. Ten answer categories are commonly used in the QEC (50.0%), the WVS (38.0%) and the EVS (26.5%), but other surveys (e.g., EUROBAR, never use them).
Table 4. Percentage of scales with different numbers of answer categories in attitude/belief A/D questions

Moving to A/D questions, Table 3 shows that the number of answer categories are more in line with the recommendations of the literature: more than five answer categories are only used in the LAPOP (100% of the A/D questions use seven answer categories), in the WVS (15% of the A/D questions use 10 answer categories) and in the QEC (41.7% of the A/D scales have 10 points). However, the WVS data was collected between 2010 and 2014, and the QEC in 2015. These are the two oldest questionnaires. Thus, they were prepared before a lot of studies about A/D scales were published. All other surveys use A/D scales of five points or less. Many surveys use the same number of answer categories for (almost) all the A/D scales.
The most used number of answer categories in practice for A/D scales is four, which means that most A/D scales have no middle neutral category (“neither agree nor disagree”) trying to obtain a substantive answer by pushing people to choose one side.
5.3 Grids
Third, Table 5 provides information regarding the usage of grids in the 10 surveys studied: the number of grids in each questionnaire, the maximum number of items in a grid, the average number of items per grid and the percentage of total survey items belonging to grids.
Table 5. Grid usage in the 10 surveys

Notes. Because the available questionnaires for GSS and SHARE are presented in scripting files, we could not infer whether some of the questions belong or not to a grid.
Grid usage is very common in practice. However, important differences exist across surveys: the number of grids varies between 11 (LAPOP) and 50 (QEC). Overall, items belonging to grids represent between 43.3% (ESS) and 77.7% (QEC) of all survey items.
Moreover, the grids are quite large, with an average number of items per grid varying between 4 and 7, but a maximum number of items per grid that goes up until 23 (AMERICAS). Overall, most surveys use a lot of grids, and furthermore, these grids sometimes include many items.
5.4 Check-all-that-apply (CATA)
Table 6 presents, per survey, the total number of CATA, the maximum and mean number of items in a single CATA, and the percentage of CATA items over the total survey items.
Table 6. CATA usage in the 10 surveys
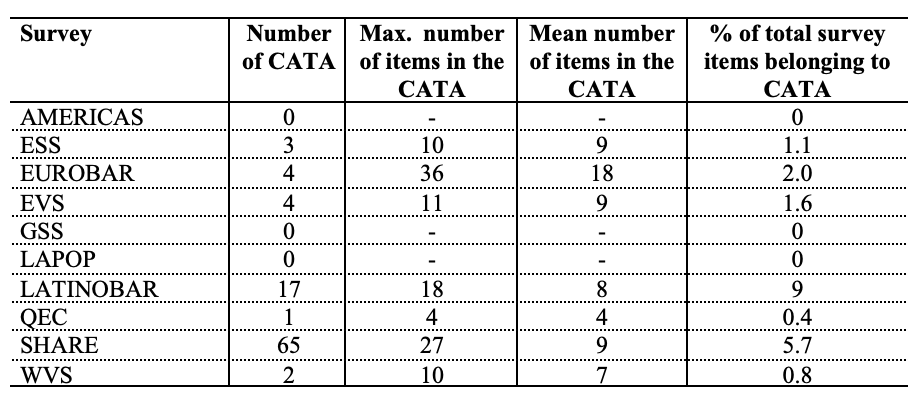
The use of CATA format in the analyzed questionnaires is very limited. Most surveys have few or no CATA format. Thus, CATA items represent a small percentage of the total questionnaire, ranging from 0% (GSS) to 5.7% (SHARE).
Even though few CATA items are used, some of those are especially large, with a maximum of 36 items in a single CATA (EUROBAR). This particular case refers to a nationality item. Thus, all the choices are possible nationalities of the respondent. Considering this, the problems regarding the use of CATA explained in Section 2.4 may not apply.
Moreover, information about the mean number shows that this is exceptional: questionnaires using CATA have a mean number of items per CATA of 7 (WVS) to 9 (ESS, EVS and SHARE), except the EUROBAR (mean = 18).
Finally, the residual use of forced-choice formats in the analyzed questionnaires suggests that the questionnaires simply do not require to use this kind of formats.
5.5 Fixed reference points
Table 7 shows the proportions of scales without fixed reference points, with at least one fixed reference point but not all possible ones and with all possible fixed reference points.
Table 7. Usage of fixed reference points in the 10 surveys
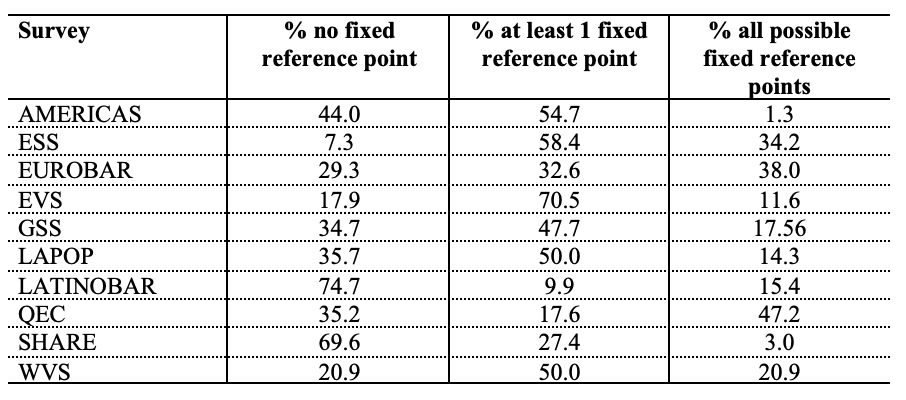
Except the Latino Barometer and SHARE, all other questionnaires have more scales with at least one fixed reference point than none. However, the surveys use more often some but not all possible fixed reference points, except for the Eurobarometer, the Latino Barometer and the QEC.
Again, large differences across surveys exist. For instance, while the QEC is using all possible fixed reference points to a moderate extent (47.2% of the items), most other surveys use them in less than 25% of the cases. Particularly, the AMERICAS and SHARE rarely use all fixed reference points (1.3% and 3.0%, respectively).
6. Conclusion and discussion
This paper provides information about the response scales used by 10 well-established social science face-to-face surveys, focusing on five aspects: (1) For the scales’ evaluative dimension, all questionnaires use A/D items in a non-negligible proportion of items: between 5.8% and 15.7% depending on the survey when considering all survey items; between 8.7% and 27.4% when considering only the attitude/belief items. (2) For the number of answer categories, attitude/belief IS questions often propose six or less answer categories and A/D five or less. (3) Regarding the use of grids, results vary largely across surveys: some including many grids and sometimes with many items. (4) In line with the literature recommendations, we found overall low proportions of CATA (lower than 2% in all surveys, except SHARE).
(5) Finally, eight of the 10 analyzed questionnaires included more items with at least one fixed reference point than without any. However, we still observed an important number of scales without any fixed reference point, and even more without all possible fixed reference points. The variations across surveys are large.
This study has different limitations. First, it focused on only five response scale characteristics. These were selected because there is general consent in the literature about them and it has been shown that they have an important impact on data quality. Further research could consider other aspects. Moreover, according to Alwin (2007) the polarity of the measured concept is key for understanding the scales’ length. This suggests that a division between bipolar and unipolar concepts should be done in order to establish an optimal length for a scale. However, this aspect is not taken into account in most of the current literature about scale length. Therefore, we have not included this distinction, but further research distinguishing between unipolar and bipolar scales when studying the number of answer categories would be useful. Besides, the use of different formats depends a lot on the concepts to be measured. For instance, CATA formats might be used little in the surveys not because researchers designing the questionnaires take into account the literature recommendations, but simply because the concepts they want to measure in the surveys studied are not adequate for CATA formats. The low number of forced-choice questions that could be alternatively asked using CATA formats suggest that this is indeed the case. Finally, mainly for the CATA items, the way these items were implemented was not always clear, in particular due to the presence of an interviewer. Even if showcards were used, the administration of the CATA items might have been in practice very similar to a forced-choice format.
Even if the study has limitations, the results can help researchers by shedding light on the current survey practice in key social science surveys, also showing how it relates to the current state of the art. In particular, the results suggest that there are some deviations from the literature recommendations observed in practice in the 10 surveys considered. Thus, researchers should not simply copy questions from these surveys when designing their own questionnaire. Instead, they should evaluate not only their quality before deciding to use them, but also the survey’s design, content and context. Although quality is an important aspect to consider, compromises are made to meet the aim of the surveys – i.e. making a question comparable across countries, targeting a specific population sub-group or complementing another data base.
A key question then is why scales that are not recommended by the literature are still used in practice? This might be a problem of dissemination of the results. However, well-established surveys as the ones considered in this paper usually count with international experts who do know the literature recommendations and best practices. Thus, we believe that other reasons play an important role. First, even if there is high agreement in the literature for the recommendations studied in this paper, it is always important to confront the possible recommendations to the specific case study of interest. Final decisions have to be taken on a case by case basis because what is usually recommended might not be the best solution in some situations. These recommendations are often interacting with each other (e.g. the number of points depends on the scale evaluative dimension) and not all interactions were tested in the literature (e.g. polarity and number of answer categories). Moreover, all these surveys have been running for years, and often try to maintain data comparability across waves to allow longitudinal analyses. Therefore, they minimize changes in their questionnaires. Furthermore, we have to take into account that not all the surveys have the necessary resources to continuously be up-to-date with the literature nor to apply all the recommendations in practice. There is usually a trade-off between data quality, comparability (across time or countries), and costs. Still, it is crucial that surveys keep improving their questionnaires using the latest (evidence-based) recommendations from the literature as often as possible.
References
- Alwin, D. F., & Krosnick, J. A. (1991). The reliability of survey attitude measurement: The influence of question and respondent attributes. Sociological Methods & Research, 20(1), 139-181.
- Alwin, D. F. (2007). Margins of error: A study of reliability in survey measurement (Vol. 547). John Wiley & Sons.
- Asensio, M., and Revilla, M. (2021). Number of answer categories for bipolar item specific scales in face-to-face surveys: Does more mean better? Quality and Quantity Published online first June 2021. https://doi.org/10.1007/s11135-021-01183-x
- Batista-Foguet, J. M., & Saris, W. E. (1988). Reduction in variation in response function for social science variables: Job satisfaction. Variation in response functions: A source of measurement error in attitude research, 178-198.
- Bell, D. S., Mangione, C. M., & Kahn Jr, C. E. (2001). Randomized testing of alternative survey formats using anonymous volunteers on the World Wide Web. Journal of the American Medical Informatics Association, 8(6), 616-620.
- Börsch-Supan, A. (2019). Survey of Health, Ageing and Retirement in Europe (SHARE) Wave 7. Release version: 7.0.0. SHARE-ERIC. Data set. DOI: 10.6103/SHARE.w7.700
- Couper, M. P., Traugott, M. W., & Lamias, M. J. (2001). Web survey design and administration. Public opinion quarterly, 65(2), 230-253.
- Couper, M. P., Tourangeau, R., Conrad, F. G., & Zhang, C. (2013). The design of grids in web surveys. Social science computer review, 31(3), 322-345.
- DeCastellarnau, A. (2018). A classification of response scale characteristics that affect data quality: a literature review. Quality and Quantity 52, 1523–1559. https://doi.org/10.1007/s11135-017-0533-4
- Dillman, D. A. (1978). Mail and telephone surveys: The total design method (Vol. 19). Wiley.
- Dillman, D. A. (2011). Mail and Internet surveys: The tailored design method. John Wiley & Sons.
- El Barómetro de las Américas por el Proyecto de Opinión Pública de América Latina (LAPOP), www.lapopsurveys.org.
- European Commission, Brussels (2016): Flash Eurobarometer 419 (Quality of Life in European Cities 2015). TNS Political & Social [producer]. GESIS Data Archive, Cologne. ZA6641 Data file Version 1.0.0, doi:10.4232/1.12516
- European Commission , Brussels (2019): Eurobarometer 90.3 (2018). Kantar Public [producer]. GESIS Data Archive, Cologne. ZA7489 Data file Version 1.0.0, doi:10.4232/1.13254
- European Social Survey European Research Infrastructure (ESS ERIC). (2020). ESS8 Data Documentation. Sikt – Norwegian Agency for Shared Services in Education and Research. https://doi.org/10.21338/NSD-ESS8-2016
- EVS (2019): European Values Study 2017: Integrated Dataset (EVS 2017). GESIS Data Archive, Cologne. ZA7500 Data file Version 2.0.0, doi:10.4232/1.13314
- Ferketich, S. (1991). Focus on psychometrics. Aspects of item analysis. Research in nursing & health, 14(2), 165-168.
- Garner, W. R. (1960). Rating scales, discriminability, and information transmission. Psychological Review, 67(6), 343.
- Höhne, J. K., Schlosser, S., & Krebs, D. (2017). Investigating cognitive effort and response quality of question formats in web surveys using paradata. Field Methods, 29(4), 365-382.
- Iglesias, C. P., Birks, Y. F., & Torgerson, D. J. (2001). Improving the measurement of quality of life in older people: the York SF‐12. Qjm, 94(12), 695-698.
- Jaeger, S. R., Cadena, R. S., Torres-Moreno, M., Antúnez, L., Vidal, L., Giménez, A.,& Paisley, A. G. (2014). Comparison of check-all-that-apply and forced-choice Yes/No question formats for sensory characterisation. Food Quality and Preference, 35, 32-40.
- Krosnick, J. A. (1991). Response strategies for coping with the cognitive demands of attitude measures in surveys. Applied cognitive psychology, 5(3), 213-236.
- Krosnick, J. A. & Presser S. (2010). Question and questionnaire design. In Marsden PV, Wright JD (Eds.). Handbook of survey research. Emerald Group Publishing; 263–314.
- Kunz, T. (2017). Evaluation of agree-disagree versus construct-specific scales in a multi-device web survey. In General Online Research conference, Berlin, Germany.
- Lau, A., & Kennedy, C. (2019) “When Online Survey Respondents Only Select Some That Apply”. Pew Research Center.
- Manfreda, K. L., Batagelj, Z., & Vehovar, V. (2002). Design of web survey questionnaires: Three basic experiments. Journal of computer-mediated communication, 7(3), JCMC731.
- Peytchev, A. (2009). Survey breakoff. Public Opinion Quarterly, 73(1), 74-97.
- Poynter, R. (2001). A guide to best practice in online quantitative research. In ASC international conference on survey research methods (pp. 3-19).
- Puelston, J., & Sleep, D. (2008). The Survey Killer: A look at the impact of boredom on the respondent experience. Quirks, 2008, 54-58.
- Revilla, M. (2015). Effect of using different labels for the scales in a web survey. International Journal of Market Research, 57(2), 225-238.
- Revilla, M. (2017). Analyzing survey characteristics, participation, and evaluation across 186 surveys in an online opt-in panel in Spain. methods, data, analyses, 11(2), 28.
- Revilla, M. A., Saris, W. E., & Krosnick, J. A. (2014). Choosing the number of categories in agree–disagree scales. Sociological Methods & Research, 43(1), 73-97.
- Revilla, M., & Ochoa, C. (2015). Quality of different scales in an online survey in Mexico and Colombia. Journal of Politics in Latin America, 7(3), 157-177.
- Revilla, M., Toninelli, D., Ochoa, C., & Loewe, G. (2016). Do online access panels need to adapt surveys for mobile devices?. Internet Research, 26(5), 1209-1227.
- Saris, W. E., & De Rooij, K. (1988). What kind of terms should be used for reference points. Variation in response functions: A source of measurement error in attitude research. Sociometric Research Foundation.
- Saris, W. E., & Gallhofer, I. N. (2007). Design, evaluation, and analysis of questionnaires for survey research. John Wiley & Sons.
- Saris, W. E., & Gallhofer, I. N. (2014). Design, evaluation, and analysis of questionnaires for survey research. John Wiley & Sons. Second edition.
- Saris, W., Revilla, M., Krosnick, J. A., & Shaeffer, E. M. (2010). Comparing questions with agree/disagree response options to questions with item-specific response options. Survey Research Methods, 4(1), 61-79.
- Saris, W. E., van de Putte, B., Maas, K., & Seip, H. (1988). Variation in response functions: observed and created. Variation in Response Functions: A Source of Measurement Error in Attitude Research. Sociometric Research Foundation.
- Schaeffer, N. C., & Presser, S. (2003). The science of asking questions. Annual review of sociology, 29(1), 65-88.
- Scherpenzeel, A. (2002). Why use 11-point scales. Swiss Household Panel (SHP), 9, 2008.
- Schuman, H., & Presser, S. (1981). Questions and answers: Experiments on question form, wording, and context in attitude surveys. Academic.
- Smith, T. W. (2020). General Social Survey, 2018. doi: 10.17605/OSF.IO/7JF94
- Smyth, J. D., Dillman, D. A., Christian, L. M., & Stern, M. J. (2006). Comparing check-all and forced-choice question formats in web surveys. Public Opinion Quarterly, 70(1), 66-77.
- Sudman, S. & Bradburn, N. M. (1982). Asking questions: A practical guide to questionnaire design. Jossey-Bass
- Thorndike, F. P., Carlbring, P., Smyth, F. L., Magee, J. C., Gonder-Frederick, L., Ost, L. G., & Ritterband, L. M. (2009). Web-based measurement: Effect of completing single or multiple items per webpage. Computers in Human Behavior, 25(2), 393-401.
- Toepoel, V., Vis, C., Das, M., & Van Soest, A. (2009). Design of web questionnaires: An information-processing perspective for the effect of response categories. Sociological Methods & Research, 37(3), 371-392.
- Tourangeau, R., Couper, M. P., & Conrad, F. (2004). Spacing, position, and order: Interpretive heuristics for visual features of survey questions. Public Opinion Quarterly, 68(3), 368-393.
- Weijters, B., Cabooter, E., & Schillewaert, N. (2010). The effect of rating scale format on response styles: The number of response categories and response category labels. International Journal of Research in Marketing, 27(3), 236-247.
- Wojtowicz, T. (2001). Designing lengthy internet questionnaires: suggestions and solutions. ASC international conference on survey research methods.
- WVS (2015). World Value Survey 1981-2014 Longitudinal Aggregate v.20150418, 2015. World Values Survey Association (www.worldvaluessurvey.org). Aggregate File Producer: JDSystems Data Archive, Madrid, Spain.
-
Keywords
calibration CATI coverage coverage bias cross-national surveys data linkage data quality European Social Survey experiment face-to-face face-to-face survey Facebook hard to reach populations incentives item nonresponse measurement measurement error mixed-mode surveys multitasking non-probability samples Nonresponse nonresponse bias nonresponse rates paradata PIAAC Probability sample probability samples QR codes rare populations response rate Satisficing social desirability Social media survey survey-taking climate survey data survey management survey methods Telephone survey telephone surveys total survey error unit nonresponse validity web survey Web surveys weighting
