

Presentation Format Differences in Factorial Surveys: Written Vignettes Versus Photo Vignettes
Research note
Eifler, S., Petzold, K. & Verbeek-Teres, M. (2023). Presentation Format Differences in Factorial Surveys: Written Vignettes Versus Photo Vignettes. Survey Methods: Insights from the Field. Retrieved from https://surveyinsights.org/?p=16770 The data used in this article is available for reuse from http://data.aussda.at/dataverse/smif at AUSSDA – The Austrian Social Science Data Archive. The data is published under the Creative Commons Attribution-ShareAlike 4.0 International License and can be cited as: ”Replication Data for: Presentation Format Differences in Factorial Surveys: Written Vignettes Versus Photo Vignettes”. https://data.aussda.at/dataset.xhtml?persistentId=doi:10.11587/PXPR97
© the authors 2023. This work is licensed under a Creative Commons Attribution 4.0 International License (CC BY 4.0) 
Abstract
This study is devoted to an analysis of presentation format differences in factorial survey experiments by the example of fear of crime as conceptualized by criminological theories. Guided by approaches from the psychology of cognition, we aim at a systematic comparison of the processing of factorial survey experiments based either on written or visual vignettes. We conducted a cross-sectional web survey in 2014 among n = 1.449 students of a German university. Within the framework of a split ballot-experiment, we varied the presentation format of vignettes which were part of a factorial survey experiment. The results of our study show that dropout rates do not differ between presentation formats while processing time and self-reported fatigue are reduced when using visual vignettes.
Keywords
factorial survey approach, presentation format differences, verbal vignettes, visual vignettes, web survey
Copyright
© the authors 2023. This work is licensed under a Creative Commons Attribution 4.0 International License (CC BY 4.0)
Research Problem
Factorial survey experiments in the tradition of Paul F. Lazarsfeld and Peter H. Rossi are used to measure normative judgements, subjective beliefs or behavioral intentions by respondent’s answers to a number of brief descriptions of hypothetical situations, persons, or objects, called vignettes. The approach is based on the assumption that vignettes allow to mirror situations of everyday experience, thereby bringing in line individual answers with real-life judgement formation or decision-making. As compared to item-based questionnaire methods, vignettes comprise more detailed and more concrete information on the phenomena meant. It is stated that this leads to a more standardized imagination of the situation across respondents, inducing them to report their true opinions and to provide more valid responses (Auspurg & Hinz, 2015). Due to their supposed advantages, vignettes have been more and more applied in surveys (Finch, 1987; Mutz, 2011; Treischl & Wolbring, 2022; Wallander, 2009).
With this increasing experience, however, also disadvantages of using vignettes appeared. A number of studies was devoted to the analysis of the appropriate number of vignette dimensions and, related to this, fatigue effects, learning effects, and order effects (Auspurg & Jäckle, 2017; Sauer et al., 2020). Other studies considered the relevance of respondents’ features for response times and response consistency (Sauer et al., 2011), as well as influences of different answering scales or the presentation form of vignettes, i.e. text or table (Sauer et al., 2020; Shamon et al., 2022; Treischl & Wolbring, 2022). Most importantly, however, researchers questioned the degree of correspondence between real-life situations and presented situations in a factorial survey. Methodological studies revealed systematic differences between real-life and vignette-based measures of attitudes, intentions, or behaviours, and, more specifically, they also found evidence of socially desirable response behaviour within the framework of factorial surveys. Overall, it is still an open question whether factorial survey experiments actually help to improve measurement quality of normative judgments, subjective beliefs or behavioral intentions (Eifler & Petzold, 2019; Petzold & Wolbring, 2018).
In particular, the presentation form of factorial survey experiments still needs further clarification. In principle, there are different formats of presenting vignettes within the framework of a survey: The situation can either be described in a written form or presented by visual stimuli, e.g. by videos, photos or pictures. While the majority of studies apply written vignettes (Wallander, 2009), some studies use solely video vignettes (Krysan et al., 2009) or solely photo vignettes (Golden III et al., 2001). Another study combines written and photo information within single vignettes (Havekes et al., 2013). Couper et al. (2004) found out that presenting a question with an additional photograph influences systematically the respondent’s answer by clarifying the meaning of the question and simplifying its interpretation though included images didn’t increase the respondent’s motivation and satisfaction with the survey.
To our best knowledge, only two studies compared observed responses to both written and visual stimuli focusing on video vignettes (Rashotte, 2003; Eifler, 2007). Because these studies suggested that different mechanisms apply when presenting photo vignettes and video vignettes we decided to focus on the presentation of visual stimuli in the form of photo vignettes for a first theoretical and empirical approach to analysing systematic differences between written and photo presentation formats of vignettes (see Eifler & Petzold, 2022 for details).
Theoretical considerations
We start from the idea that different mechanisms apply when respondents are confronted with either verbal or visual information (Harper, 2002). McCloud (1994) put these different mechanisms in a nutshell using the idea of a smiling face as an example. Seeing the image of a smiling face does not require formal education to decipher it. The message is received instantaneously. Reading a text like ‘Two eyes, a nose, a mouth with the corners of the mouth turned up…’, on the contrary, requires special knowledge to decode the idea of a smiling face from the language. The message is perceived. In particular, the dual coding theory (DCT; Paivio, 1979) allows for a systematic analysis of such processing differences regarding verbal and visual information. DCT suggests two coding systems in human memory, one of which is responsible for language or verbal information, the other for pictures or non-verbal information. Both systems overlap and can operate simultaneously in principle. Processing verbal and/or visual information generates “internal mental images” (Sadoski & Paivio, 2013, p. 29) which represent information about situations. It is assumed that mental images of situations match experiences with the same situations (e.g. Kosslyn & Pomerantz, 1977). Both written and visual information about situations is processed by both systems, but each in a different way: Written information is processed sequentially, i.e. by the verbal coding system first and by the non-verbal coding system subsequently; visual information is processed simultaneously by both coding systems at a time (Paivio, 1979; Sadoski & Paivio, 2013).
Because of the sequential processing of verbal information, written vignettes can elicit diverging encoding processes by readers, thus leading to diverging mental images between subjects. Because of the simultaneous processing of visual information, photo vignettes facilitate a more standardized perception of the concrete situation without any loop way, thus leading to corresponding mental images of the presented situations between subjects. While verbal information requires more extensive information processing by a reader and more background knowledge (perceived information), visual information presents the information directly (received information, see McCloud, 1994). It follows from these considerations, that photos can be considered to mirror real-life (Manghani, 2013; Rose, 2012) and to serve as a concrete point of reference for all who are confronted with them (Marion & Crowder, 2013).
With regard to factorial survey experiments, photo vignettes not only allow for a more realistic presentation of the situations under study but also for evoking the feeling of experiencing the particular situation. While written vignettes facilitate a sequential presentation of information in the form of short stories, photo vignettes present the information simultaneously in the form of pictures, thereby activating visual and verbal mental representations and leading to emotional arousal at the same time.
In line with these considerations, we assume that the presentation of photo vignettes facilitates processing the information presented in factorial surveys. Consistently, we expect reduced dropout rates (H1a), reduced processing time (H1b), and a more positive respondent’s evaluation (H2) in a factorial survey based on photo vignettes compared to a factorial survey using written vignettes.
Empirical Study
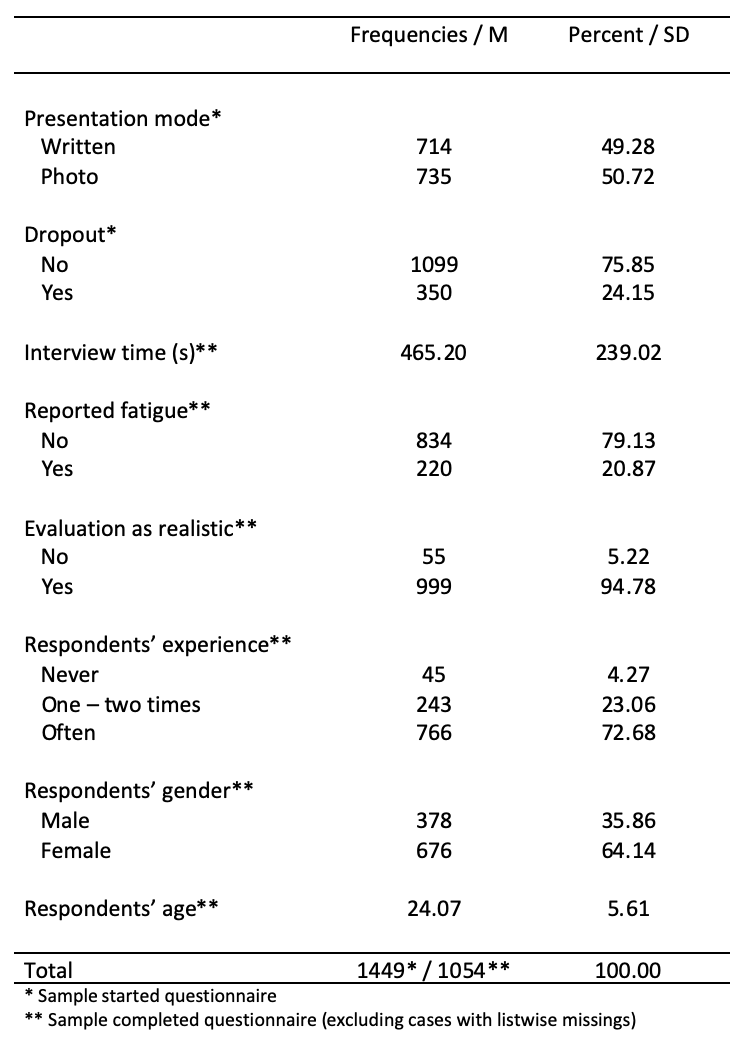
We conducted a split ballot experiment with a between-subjects design for examining presentation format differences in a factorial survey experiment. For a first empirical approach, we regarded a homogeneous sample as appropriate. The study was part of a web survey on attitudes towards safety in public places, conducted at the Martin-Luther-University Halle-Wittenberg, Germany in 2014 (Schwarzbach & Eifler, 2020), and was carried out as a full population survey of all enrolled students (N=20.000). An overall number of n=1.449 students started to answer the survey and n=1.099 completed the survey providing sufficient information. Each subject was randomly assigned to one of the two presentation formats, using either written vignettes or photo vignettes. Table 1 contains the descriptive statistics for the sample.
Table 1: Descriptives
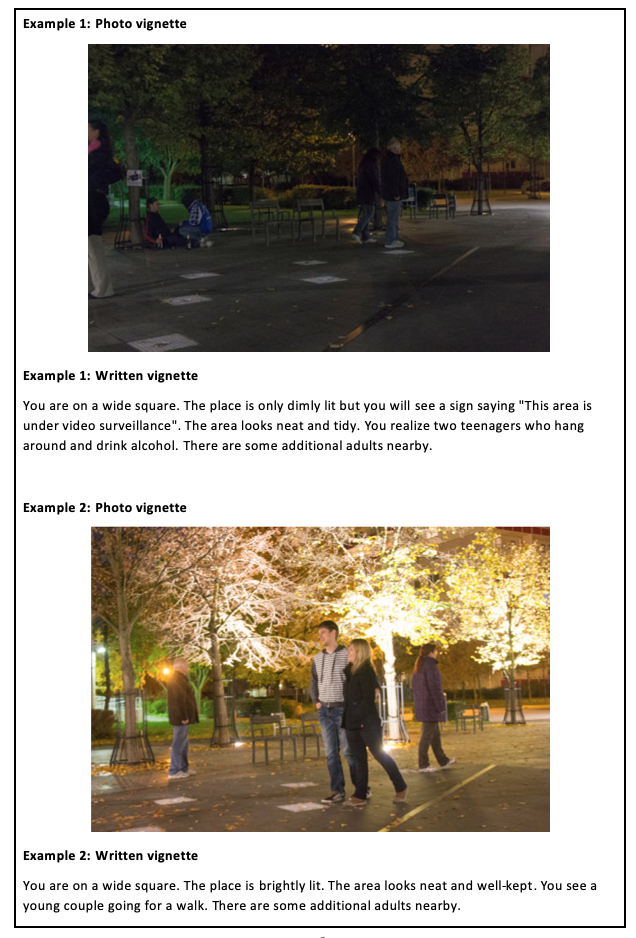
We use written and photo vignettes that describe varying situations of everyday experience according to the broken windows theory for the prediction of fear of crime (Wilson & Kelling, 1982; Kelling & Coles, 1996; Keizer et al., 2014; Keuschnigg & Wolbring, 2015). The two factorial surveys are based on the same 24·3-within-subjects design (see Table 1, Appendix) where the dimensions referred to signs of social and physical disorder in urban neighborhoods that had been used in previous studies (Piquero, 1999; Taylor, 1999). A total of 48 vignettes resulted from a full combination of the dimensions and their levels. These were subdivided into six sets of eight vignettes each and presented to the subjects. Because our focus here is on the differences between written and photo vignettes, we used the aggregated data referring to the respondent’s level. For detailed information about the varied dimensions and levels see Table 1 in the appendix. A complete documentation of all written vignettes and their respective visual counterparts is available in the project description (Schwarzbach & Eifler, 2020). Figure 1 shows examples of photo vignettes and their respective written counterparts.
Figure 1: Examples of photo vignettes and written vignettes
To evaluate the design’s internal validity, it was examined how far the randomization of subjects across the experimental conditions of the split ballot experiment for analyzing presentation format differences of the factorial survey led to a parallelization of experimental groups. As follows from Table 2 (Appendix), there are no substantial differences with regard to the distribution of the respondents’ age and gender across the two levels of the split ballot experiments. Deviations in respondents’ experience with the situation is minimal. Accordingly, randomization of subjects to the presentation formats, i.e. written vignettes or photo vignettes, led to mostly parallel groups.
The key dependent variables referred to (a) paradata collected in the course of the web survey, i.e. the dropout rate and the required processing time, and (b) evaluation data based on self-reports of the respondents concerning the level of fatigue [Item text: “This survey was tiring at times.”, response scale: “yes”, “no”] when completing the respective factorial survey that they had been assigned to. We did not include, however, item-nonresponse as a dependent variable as the level of item-nonresponse was low with a very skew distribution on the vignette level [M=1.23; SD=1.16; Skewness=3.13; Kurtosis=16.91], so that analyses of unit non-response provide clearer and less biased results.
Estimations are controlled for respondents’ subjective reports whether or not they were able to put themselves in the presented situations, thereby evaluating the vignettes as realistic [Question text: “Were you able to put yourself in the situations presented based on the descriptions?”, response scale: “yes”, “no”] and for the reported experience with the situation presented to the subjects [Question text: “Have you been in a similar situation yourself?”, response scale: “often”, “one to two times”, “never”.] Both questions were part of our split ballot-experiment and are not used as a standard procedure in factorial survey experiments. Also, age and gender were used as control variables. The respondents’ education was not introduced as a control variable because the education distribution has a high level of homogeneity within the sample.
Results and Conclusions
A comparison between formats revealed no relevant differences between presentation formats with regard to the dependent variable [Question text: “How safe would you feel in this situation?”, rating scale: “very safe”, “safe”, “unsafe”, “very unsafe”. This question was asked immediately after presenting each vignette.] measured by means of the factorial survey. Most subjects reported an overall low level of feelings of safety. A majority of subjects indicated that they feel very safe or safe (see Table 3, Appendix). This reflects that both formats stimulated similar responses on the aggregate level, i.e. across all vignettes.
In order to test our hypotheses regarding presentation format differences, three regression models with presentation format as independent variable and the dependent variables dropout rate, processing time and respondent’s self-reported fatigue have been calculated using respondent’s gender and experience with the presented situations as control variables. The respective average marginal effects (AMEs) for the three regression models (M1-M3) are reported in Table 2.
Table 2: Regression models: Effect of presentation format on dropout rate, processing time and respondents’ fatigue
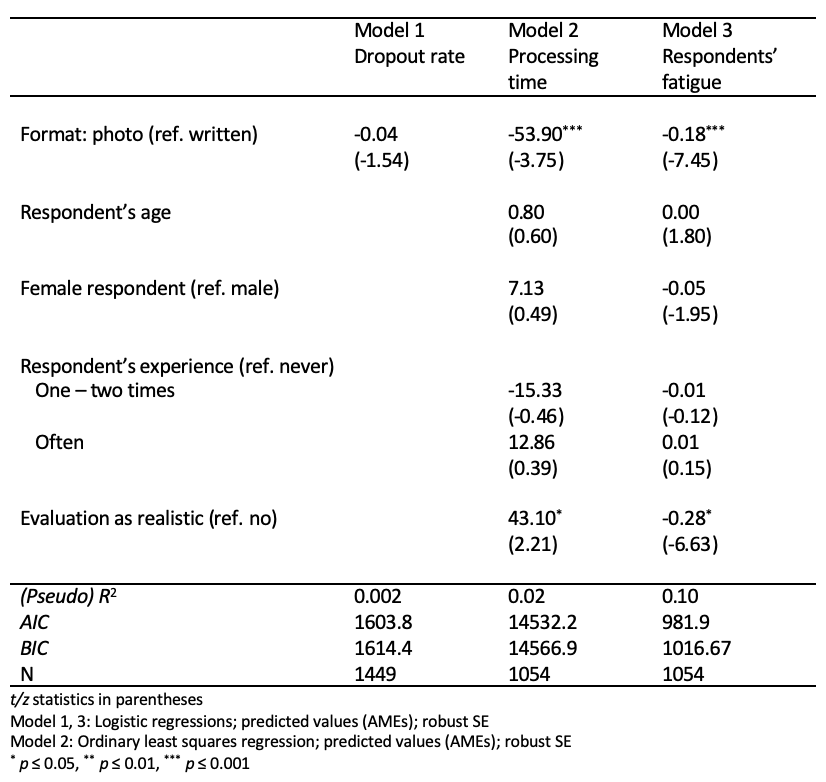
It follows from Table 2 that no differences regarding the dropout rate occur between presentation format (AME=-0.04, p=0.12, n.s.). Overall, the dropout rate is with 24,15% relatively low in both formats as can be taken from Table 1. Accordingly, our results do not support hypothesis 1a which stated that respondents of photo vignettes are less likely to dropout the survey. As for the processing time, a significant effect of the presentation format is revealed (β/AME=-53.90, p≤.001). The results indicate that respondents who receive photo vignettes need about 54 seconds less time for processing the factorial survey compared to respondents who receive written vignettes. It can be concluded that photo vignettes ease the cognitive processing of the depicted information such that this information can be retrieved more quickly from memory. Accordingly, hypothesis 1b is supported by our results.
With regard to respondent’s self-reported fatigue, hypothesis 2 referred to the assumption that respondents do easier and report less fatigue when processing photo vignettes as opposed to written vignettes. It can be taken from Table 2 that our results support this assumption. The probability that respondents get tired in the course of processing the factorial survey, is reduced by about 19% on average when respondents go through photo vignettes instead of through written vignettes (AME=-0.18, p≤.001).
Overall, we interpret our results as pointing towards the advantages of using photo vignettes in factorial surveys. This applies to the reduced processing time and to lower feelings of fatigue in the course of the survey when using photo vignettes instead of written vignettes. A lower responding time additionally should lead to a higher concentration and commitment of respondents in the course of the survey. Because no differences between the presentation formats occur with regard to dropout rates, the present study does not indicate that factorial surveys based on photo vignettes would be superior with regard to respondent’s willingness to participate. Our results also leave questions of data quality when using different presentation formats of vignettes open. Furthermore, the respondents in this study were homogeneous with regard to their level of education. Therefore, the present study allowed for an isolated test of presentation format differences while keeping cognitive abilities constant during the survey. However, the explanatory power of the models for the analysis of presentation format differences was low. This means that our dependent variables might have been influenced by other features of the data collection procedure that were beyond our control. Further studies will have to clarify whether there is an interaction between the presentation form of vignettes and respondents’ cognitive abilities or features of the data collection procedure. In addition, further studies will have to show whether photo vignettes might facilitate less socially desirable responding. Finally, it must be considered that for using photo vignettes the interested situation needs to be visually displayable.
Appendix: Additional material
References
- Auspurg, K. & Hinz, T. (2015). Factorial Survey Experiments. Los Angeles: SAGE.
- Auspurg K. & Jäckle, A. (2017). First Equals Most Important? Order Effects in Vignette-based Measurement. Sociological Methods & Research, 46 (3), 490-539.
- Couper, M. P., Tourangeau, R. & Kenyon, K. (2004). Picture This! Exploring Visual Effects in Web Surveys. The Public Opinion Quarterly, 68 (2), 255-266.
- Eifler, S. (2007). Evaluating the Validity of Self-Reported Deviant Behavior Using Vignette Analyses. Quality & Quantity, 41, 303-318.
- Eifler, S. & Petzold, K. (2019). Validity Aspects of Vignette Experiments. Expected ‘What-If’ Differences between Reported and Actual Behavior. In P. J. Lavrakas et al. (Eds.), Experimental Methods in Survey Research: Techniques that Combine Random Sampling with Random Assignment (pp. 393-416). Hoboken: John Wiley & Sons.
- Eifler, S. & Petzold, K. (2022). Fear of the Dark? A Systematic Comparison of Written Vignettes and Photo Vignettes in a Factorial Survey Experiment on Fear of Crime. Methods, data, analyses : a journal for quantitative methods and survey methodology (mda), 16 (2), 201-234. https://doi.org/10.12758/mda.2022.01
- Finch, J. (1987). Research Note. The Vignette Technique in Survey Research. Sociology, 21 (1), 105-114.
- Golden III, J. H., Johnson, C. A. & Lopez, R. A. (2001). Sexual Harassment in the Workplace: Exploring the Effects of Attractiveness on Perception of Harassment. Sex Roles, 45 (11/12), 767-784.
- Harper, D. (2002). Talking About Pictures: A Case for Photo Elicitation. Visual Studies, 17 (1), 13-26.
- Havekes, E., Coenders, M. & van der Lippe, T. (2013). Positive or Negative Ethnic Encounters in Urban Neighbourhoods? A Photo Experiment on the Net Impact of Ethnicity and Neighbourhood Context on Attitudes Towards Minority and Majority Residents. Social Science Research, 42, 1077-1091.
- Keizer, K., Lindenberg, S. & Steg, L. (2014). Doing Field Studies: What is it All About? Group Processes & Intergroup Relations, 17 (3), 404-410. DOI: 10.1177/1368430213510750.
- Kelling, G.L. & Coles, C.M. (1996). Fixing Broken Windows: Restoring Order and Reducing Crime in Our Communities. New York: Touchstone.
- Keuschnigg, M. & Wolbring, T. (2015). Disorder, Social Capital, and Norm Violation. Three Field Experiments on the Broken Windows Thesis. Rationality and Society, 27, 96-126.
- Kosslyn, S. M. & Pomerantz, J. R. (1977). Imagery, Propositions, and the Form of Internal Representations. Cognitive Psychology, 9, 52-76.
- Krysan, M., Couper, M. P., Farley, R. & Forman, T. A. (2009). Does Race Matter in Neighborhood Preferences? Results from a Video Experiment. American Journal of Sociology, 115 (2), 527-559.
- Manghani, S. (2013). Image studies. Theory and practice. London: Routledge.
- Marion, J. S. & Crowder, J. W. (2013). Visual Research. A Concise Introduction to Thinking Visually. London: Bloomsbury.
- McCloud, S. (1994). Understanding Comics. The Invisible Art. New York: Harper Perennial.
- Mutz, D. C. (2011). Population-based Survey Experiments. Princeton: Princeton University Press.
- Paivio, A. (1979). Imagery and Verbal Processes. Hillsdale: Lawrence Erlbaum Associates.
- Petzold, K. & Wolbring, T. (2018). What Can We Learn from Factorial Surveys About Human Behavior? A Validation Study Comparing Field and Survey Experiments on Discrimination. Methodology, 15 (1), 19-30. DOI 10.1027/1614-2241/a000161
- Piquero, A. (1999). The Validity of Incivility Measures in Public Housing. Justice Quarterly, 16 (4), 793–818.
- Rashotte, L. S. (2003). Written Versus Visual Stimuli in the Study of Impression Formation. Social Science Research, 32 (2), 278-293.
- Rose, G. (2012). Visual Methodologies. An Introduction to Researching with Visual Materials. Los Angeles: Sage Publications.
- Sadoski, M. & Paivio, A. (2013). Imagery and Text. A Dual Coding Theory of Reading and Writing. New York: Routledge.
- Sauer, C., Auspurg, K., Liebig, S. & Hinz, T. (2011). The application of factorial surveys in general population samples: The effects of respondent age and education on response times and response consistency. Survey Research Methods, 5 (3), 89-102.
- Sauer, C., Auspurg, K. & Hinz, T. (2020). Designing Multi-Factorial Survey Experiments: Effects of Presentation Style (Text or Table), Answering Scales, and Vignette Order. mda, 14 (2), 195-214.
- Schwarzbach H. & Eifler S. (2020). Einflüsse der Präsentationsform eines faktoriellen Surveys zur Erfassung von Sicherheit im öffentlichen Raum. Eichstätter Beiträge zur Soziologie, 18. https://doi.org/10.17904/ku.edoc.25734 (Abrufdatum: 18.05.2021)
- Shamon, H., Dülmer, H. & Giza, A. (2022). The Factorial Survey: The Impact of the Presentation Format of Vignettes on Answer Behavior and Processing Time. Sociological Methods & Research, 51 (1), 396-438.
- Taylor, R. B. (1999). The Incivilities Thesis: Theory, Measurement, and Policy. In R. H. Langworthy (Ed.), Measuring What Matters: Proceedings from the Policing Research Institute Meetings (pp. 65-88). Washington, DC: U.S. Department of Justice.
- Wallander, L. (2009). 25 Years of Factorial Surveys in Sociology. A Review. Social Science Research, 38, 505-520.
- Wilson, J. Q. & Kelling, G. L. (1982). Broken Windows: The Police and Neighborhood Safety. Atlantic Monthly, 249 (3) ), 29-38.
-
Keywords
calibration CATI coverage coverage bias cross-national surveys data linkage data quality European Social Survey experiment face-to-face face-to-face survey Facebook hard to reach populations incentives item nonresponse measurement measurement error mixed-mode surveys multitasking non-probability samples Nonresponse nonresponse bias nonresponse rates paradata PIAAC Probability sample probability samples QR codes rare populations response rate Satisficing social desirability Social media survey survey-taking climate survey data survey management survey methods Telephone survey telephone surveys total survey error unit nonresponse validity web survey Web surveys weighting
