

Does the type of return postage affect response rates in follow-up mailings? Experimental findings from a citizen satisfaction survey
Research note
Ward, R. E. (2023). Does the type of return postage affect response rates in follow-up mailings? Experimental findings from a citizen satisfaction survey. Survey Methods: Insights from the Field. Retrieved from https://surveyinsights.org/?p=17502
© the authors 2023. This work is licensed under a Creative Commons Attribution 4.0 International License (CC BY 4.0) 
Abstract
Some research suggests that a strategic use of postage on return envelopes influences response rates because stamps may create dissonance, signal personalization, or introduce novelty. This research note describes the use of data from a community sample (N = 292) in a follow-up mailing to examine return postage and response rates rather than the more common practice of obtaining data from an initial or single wave of mailings to determine if postage affects response rates. Chi-square analyses reveal no association between type of return postage and response rates. One explanation for this finding may be that follow-up mailings capture a higher proportion of disinterested citizens with respect to the survey. Conventional understandings of how dissonance, personalization, or novelty might influence survey behavior may be less applicable in a follow-up sample.
Keywords
dissonance, follow-up mailing, novelty, personalization, response rate
Acknowledgement
The author is grateful to the McNair Institute for Research and Service at Francis Marion University for their generous support of this research. Gratitude is also extended to the anonymous Reviewer who provided helpful recommendations to improve the final draft.
Copyright
© the authors 2023. This work is licensed under a Creative Commons Attribution 4.0 International License (CC BY 4.0)
Introduction
This research investigates whether the type of postage on return envelopes in follow-up mailings affects the survey response rate. Following up with nonrespondents through the selection of appropriate postage or other strategies may generate additional returns that bolster statistical power and reduce nonresponse bias. In more definitive terms, obtaining a higher survey response rate can increase the probability of finding a statistically significant difference if one truly exists (Anderson et al., 2017) and expand the generalizability of sample findings by minimizing differences between respondents and nonrespondents on variables of interest (Brick & Tourangeau, 2017).
Reviews and meta-analyses on inducement strategies to increase response rates often conclude with a recommendation to place first-class paper stamps on return envelopes instead of preprinted postage (Armstrong & Lusk, 1987; Bernard, 2001; Fox et al., 1988; King et al., 2001; Yammarino et al., 1991). An inspection of the sampled populations included in these reviews and analyses typically reveals professional or specialty groups, for example, nursing professionals (Choi et al., 1990; Wakabayashi et al., 2012), physicians (McFarlane et al., 2009; Streiff et al., 2001), teachers (Hensley, 1974), and hospital patients (Lavelle et al., 2008). What impact does return postage have on surveys of the general population? This study also expands the literature by focusing on follow-up mailings rather than the common practice of examining response rates from an initial or single wave. Finally, this research goes beyond identifying which type of return postage produces the highest response rate. Different conceptual frameworks are introduced to understand why one type of postage may attract higher response rates than others.
Conceptual Frameworks and Research
To reduce overreliance on a single theory, this study follows the logic of Armstrong and Lusk (1987) to propose different outcomes grounded in the following three concepts: dissonance, personalization, and novelty.
Dissonance theory suggests that a feeling of tension arises when peoples’ actions and thoughts conflict with one another, which triggers a response to restore the more comfortable state of consonance or harmony (Festinger, 1957). The placement of stamps on return envelopes represents labor, which might provoke guilt about overlooking a request from someone who invested time and effort to position the stamp on the envelope (Streiff et al., 2001). Compliance with the survey request would be a simple action to remove the uncomfortable guilty feeling. Beyond labor expenditure, the type of postage implies differential cost, which suggests that costlier fundraising stamps might produce the greatest dissonance, and consequently, yield the highest rate of return followed by regular-priced standard stamps, and then discounted metered reply postage.
The personalization hypothesis predicts that postage will increase response rates if it establishes a connection with the survey recipient. Stamped return envelopes would seem to be more personal than metered mail because of the potential for stamps to carry visual messages and express meaning (Limor & Tamir, 2021), and fundraising stamps may be more effective than standard stamps if the charitable cause has widespread support. Furthermore, fundraising stamps that attract the interest of a particular group may generate a moderating effect (McFarlane et al., 2009). This study uses a stamp to support breast cancer research to test whether it has greater symbolic value to women than it does to men because of the worldwide public campaign every year in October (i.e., Breast Cancer Awareness Month) that raises awareness about the prevalence of breast cancer among women and the importance of regular screening and early detection.
Grounded in the notion of attention scarcity in an information-rich world (Simon, 1971), the novelty hypothesis relies on the assumption that incongruity, or surprise, captures the limited attention of survey recipients. For instance, if a follow-up mailing presents a different combination of postage on the outer and inner envelopes than what appeared in the initial mailing, the contrasting postage may be more noticeable than having outer and inner envelopes stamped the same as the initial mailing.
Some of the limited research on return postage and response rates in initial mailings supports hypotheses linked to dissonance (Armstrong & Lusk,1987; Choi et al., 1990; Streiff et al., 2001), personalization (McFarlane et al., 2009), or novelty (Duffy & Martin, 2001; Hensley, 1974), while other research discovers similar response rates across different types of return postage (Harrison et al., 2002; Lavelle et al., 2008; Price et al., 1996; Wakabayashi et al., 2012). For instance, researchers found an identical survey response rate of 15.9% in a follow-up sample of women licensed to practice nursing who received either business reply or stamped return envelopes (Wakabayashi et al., 2012). In one of the rare experimental studies to report the survey behavior of people who have been contacted using different return postage after initial nonparticipation, Lavelle et al. (2008) observed no statistically significant difference in response rates between patients randomly assigned to receive business reply or stamped return postage (i.e., 29.4% vs. 31.8%, respectively).
Table 1. summarizes the different hypotheses. Each prediction has important distinctions. For example, dissonance suggests that fundraising stamps, standard stamps, and metered reply mail create different levels of tension among survey recipients, whereas personalization implies they produce different levels of connection depending on characteristics of the recipient. Novelty suggests that the visual diversity of postage throughout waves of mailings appeals more to respondents than the tangible or symbolic value of postage itself.
Table 1. Summary of Hypotheses on Return Postage and Response Rates.
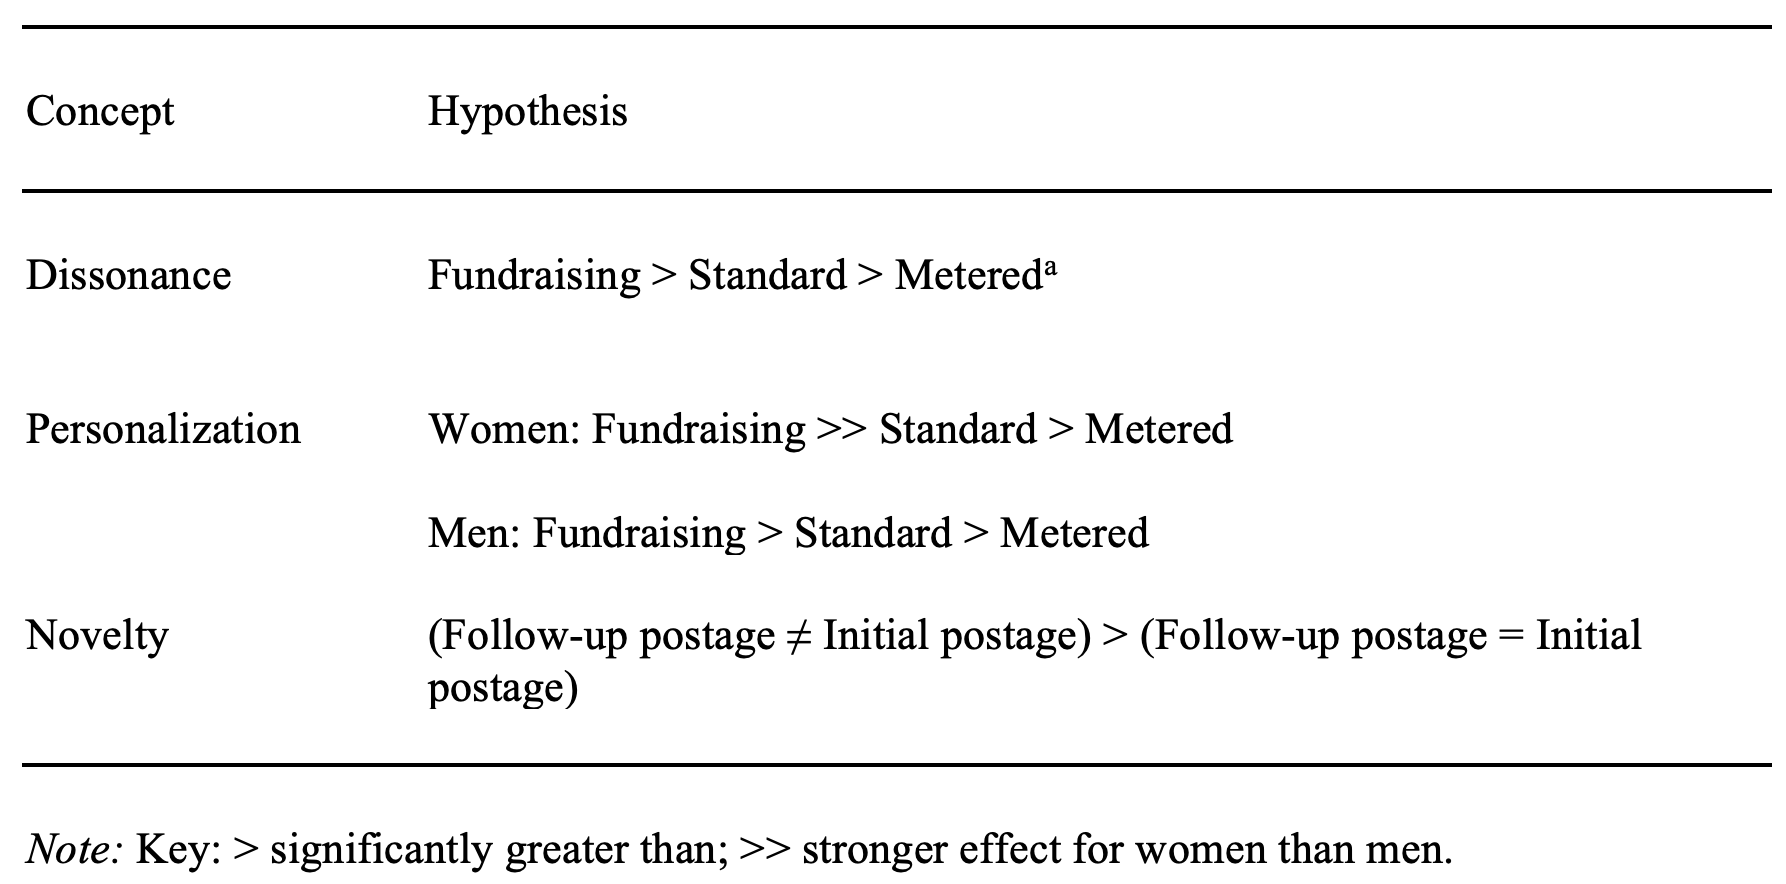
aMetered reply postage should not be confused with business reply. With metered reply mail, organizations use a postage meter to indicate proof of pre-payment for all envelopes sent. The postage typically costs less than a standard stamp. With business reply mail, organizations pay only for the printed envelopes returned. The postage typically costs more than a standard stamp, although that depends on the amount of money paid upfront for the business reply permit.
Methods
Survey Administration
The data for this study originated from a 2014 survey that focused on citizens’ evaluations of neighborhood conditions and assessments of law enforcement services (i.e., the Sheriff’s Office). To conduct the survey, a list of active registered voters (N = 81,175) in a southeastern U.S. county was obtained from a state government office. The list captured about 78% of the target population (i.e., adults 18 years or older) and included the mailing addresses, birthdates, race/ethnicity, and gender of registered voters. From each of the 12 zip codes in the county, 50 citizens were randomly selected to produce a sample of 600. The questionnaire contained 96 questions in booklet form and took about 8 minutes to complete. The survey administration followed closely the Tailored Design Method, which emphasizes repeated contacts with respondents, personalization of correspondence, and the use of token incentives (Dillman, 2000).
The survey included an initial mailing and two nonresponse follow-ups. For the initial mailing, a pre-letter with metered postage was mailed to citizens describing the purpose and importance of the survey they were about to receive. One week later on October 15, citizens were sent a metered envelope containing a (1) cover letter, (2) questionnaire, (3) token incentive (i.e., two-dollar bill), and (4) stamped envelope for the completed questionnaire to be returned to the academic department of the university from which it was sent. Materials stuffed into the outgoing envelope were arranged according to Dillman’s (2000) research and recommendations into mailing survey booklets, so that all materials came out of the envelope together to prevent anything from getting inadvertently left in the envelope. Approximately two weeks later, citizens received a metered postcard thanking them for participating in the survey and reminding them to return the questionnaire if they had not done so. About five weeks after the initial mailings, citizens who had not yet responded were sent a follow-up questionnaire on November 17. About 10 weeks after the initial mailing, a second and final attempt was made on December 29. Budgetary constraints limited the number of additional mailings. The final follow-up included an effort to reach randomly selected nonrespondents via priority mail. Since the second follow-up generated minimal cases, the analysis in this study focuses on findings from the first follow-up.
Experimental Procedure
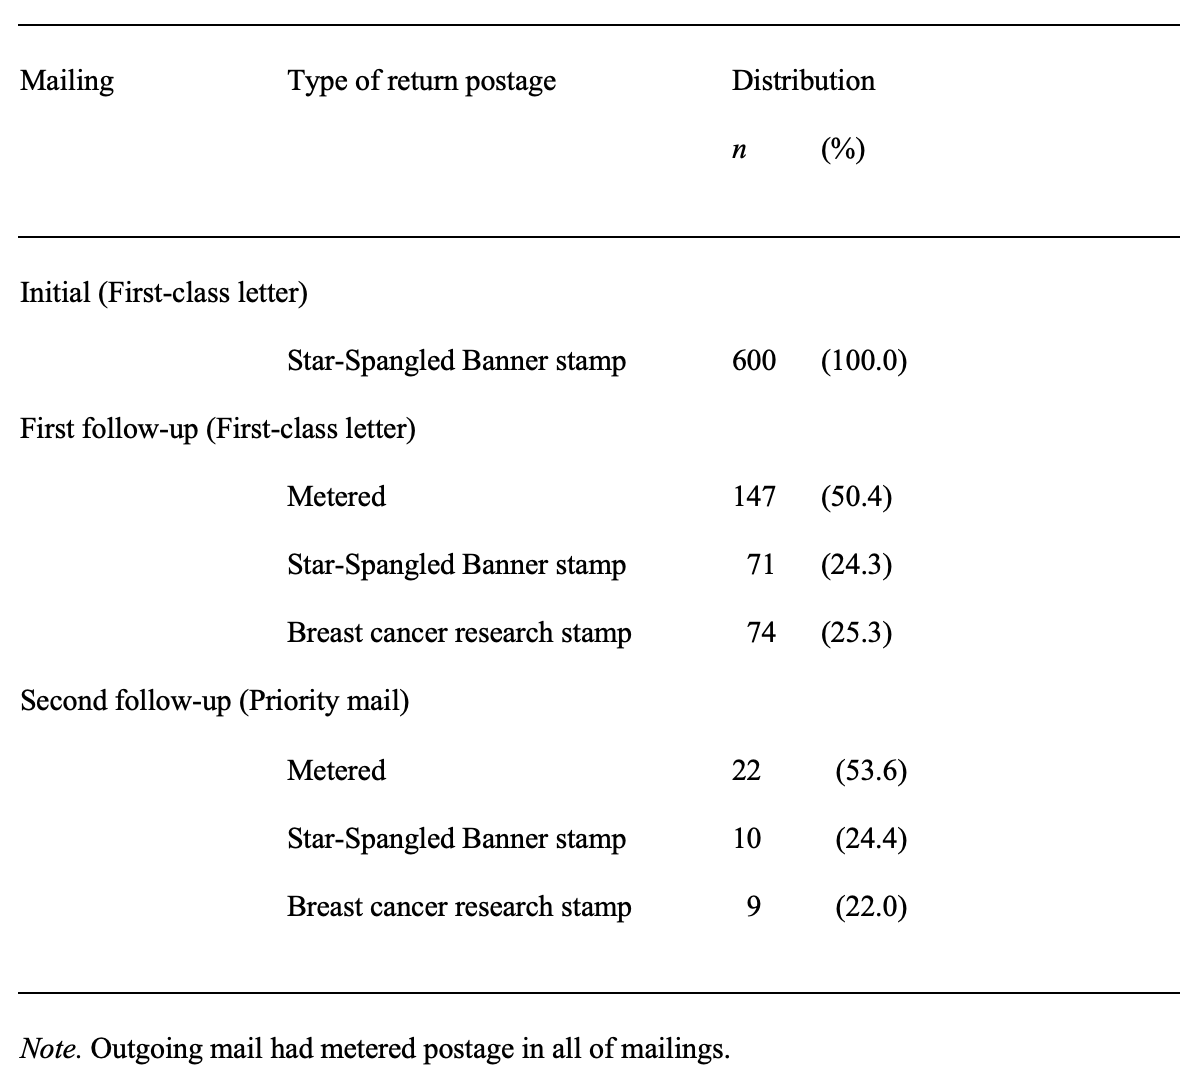
The initial mailing had no variation in postage, but the follow-up mailings included an experiment to determine if different postage on return envelopes was associated with different response rates. Nearly half of the 292 nonrespondents in the first follow-up randomly received a 48 cent metered return envelope, while the remaining nonrespondents randomly received either a return envelope with a 49 cent multi-colored Star-Spangled Banner stamp (i.e., picture of the American flag with a fireworks display in the background) or a 60 cent multi-colored breast cancer research stamp (i.e., drawing of a woman’s body). The United States Postal Service refers to the breast cancer research stamp as one of their fundraising or “semipostal” stamps, which cost more than the first class letter rate. Since the inaugural issue of this stamp in 1998 the USPS has allocated the surplus cost to the National Institutes of Health and the Medical Research Program at the Department of Defense to help fund inventive research projects dedicated toward the eradication of breast cancer (USPS, 2022). The cost for all types of postage used in the experiment reflected the standard mailing rate for a 1-ounce first-class letter at that time.
The second and final mailing included the same experimental procedure as the first follow-up. About half of the 41 nonrespondents randomly received a metered return envelope, while the other half randomly received a return envelope with a Star-Spangled Banner stamp or breast cancer research stamp. Table 2. summarizes the sample distribution.
Table 2. Sample Distribution for Postage Experiment.
Measures
Outcome measure. This research focused on whether the type of return postage affected response rates and why it might do so. The outcome measure was the response rate based on the RR6 definition of the American Association for Public Opinion Research (2016), calculated as the percentage of eligible respondents who completed or partially completed a mailed questionnaire. Undeliverable envelopes returned from the post office and explicit refusals were considered ineligible cases.
Variation in return postage. To test the dissonance and personalization hypotheses, response rates were examined among citizens who received three different types of return postage (“metered” =1, “standard stamp” = 2, or “fundraising” = 3). Both of these hypotheses predicted the highest response rate among citizens who received fundraising postage (i.e., breast cancer research stamp), followed by standard postage (i.e., Star Spangled Banner stamp), and the lowest response rate among metered reply mail recipients. However, the personalization hypothesis added the variable of gender (“female” = 1, “male” = 0) to determine whether the breast cancer research fundraising stamp had a stronger impact on response rates for women than men.
To test the novelty hypothesis, response rates were compared between citizens shown the same combination of postage in the first and second mailings (i.e., metered on the outer envelope paired with a Star-Spangled Banner stamp on the inner envelope) and citizens presented with postage in the second mailing that differed from the first mailing (i.e., metered on the outer envelope paired with either metered or breast cancer research stamp on the inner envelope. The novelty hypothesis predicted a higher response rate among citizens presented with a postage combination that varied throughout the mailings.
Analysis Strategy
The analysis begins with chi-square goodness of fit tests and a one-way between groups ANOVA test to confirm that treatment groups are not significantly different statistically with respect to demographic variables that may affect survey response. In mailed surveys of the general population, some researchers find higher response rates among women (Wolfe et al., 2016), nonwhites (Ward, 2022), and older citizens (Oliveria & Murphy, 2015).
The analysis proceeds to examine differences in response rates by type of return postage using chi-square tests of independence to determine whether dissonance, personalization, or novelty might explain survey response behavior. Dissonance and personalization hypotheses are tested using a three-way 2 x 3 contingency table. The novelty hypothesis is tested with a two-way 2 x 2 contingency table.
For the chi-square analysis of the 2 x 3 contingency table and ANOVA test, p values equal to or less than .05 indicate nonrandom findings. Cramer’s V and eta squared effect size measures accompany the 2 x 3 chi-square contingency table and the ANOVA to show strength of association for statistically significant results. For the 2 x 2 contingency table, the confidence interval and odds ratio indicate statistical significance and effect size.
Results
Random Assignment
Results from chi-square and ANOVA tests indicate no statistically significant findings, which imply successful random assignment to treatment groups for variables of gender (χ2(2) = 0.726, p = 0.696), race/ethnicity (χ2(2) = 2.840, p = 0.242), and age (F(2, 289) = 0.548, p = 0.579).
Response Rate
Among the 600 citizens contacted initially, 216 of them returned questionnaires, which left 384 nonrespondents. Included among the nonrespondents were 83 envelopes returned from the post office with markings indicating the person had moved and left no forwarding address, was deceased, or had no mail receptacle. Nine persons returned uncompleted questionnaires to indicate their refusal. Those undeliverable questionnaires and refusals reduced the eligible sample size to 508 for an initial response rate of 42.5%. For the first follow-up mailing, 45 of the 292 sampled citizens returned questionnaires. The last follow-up mailing produced 3 additional questionnaires among the 41 citizens sampled. The initial mailing and follow-ups yielded 264 completed or partially completed questionnaires for a final response rate of 52%
Dissonance and Personalization Hypotheses
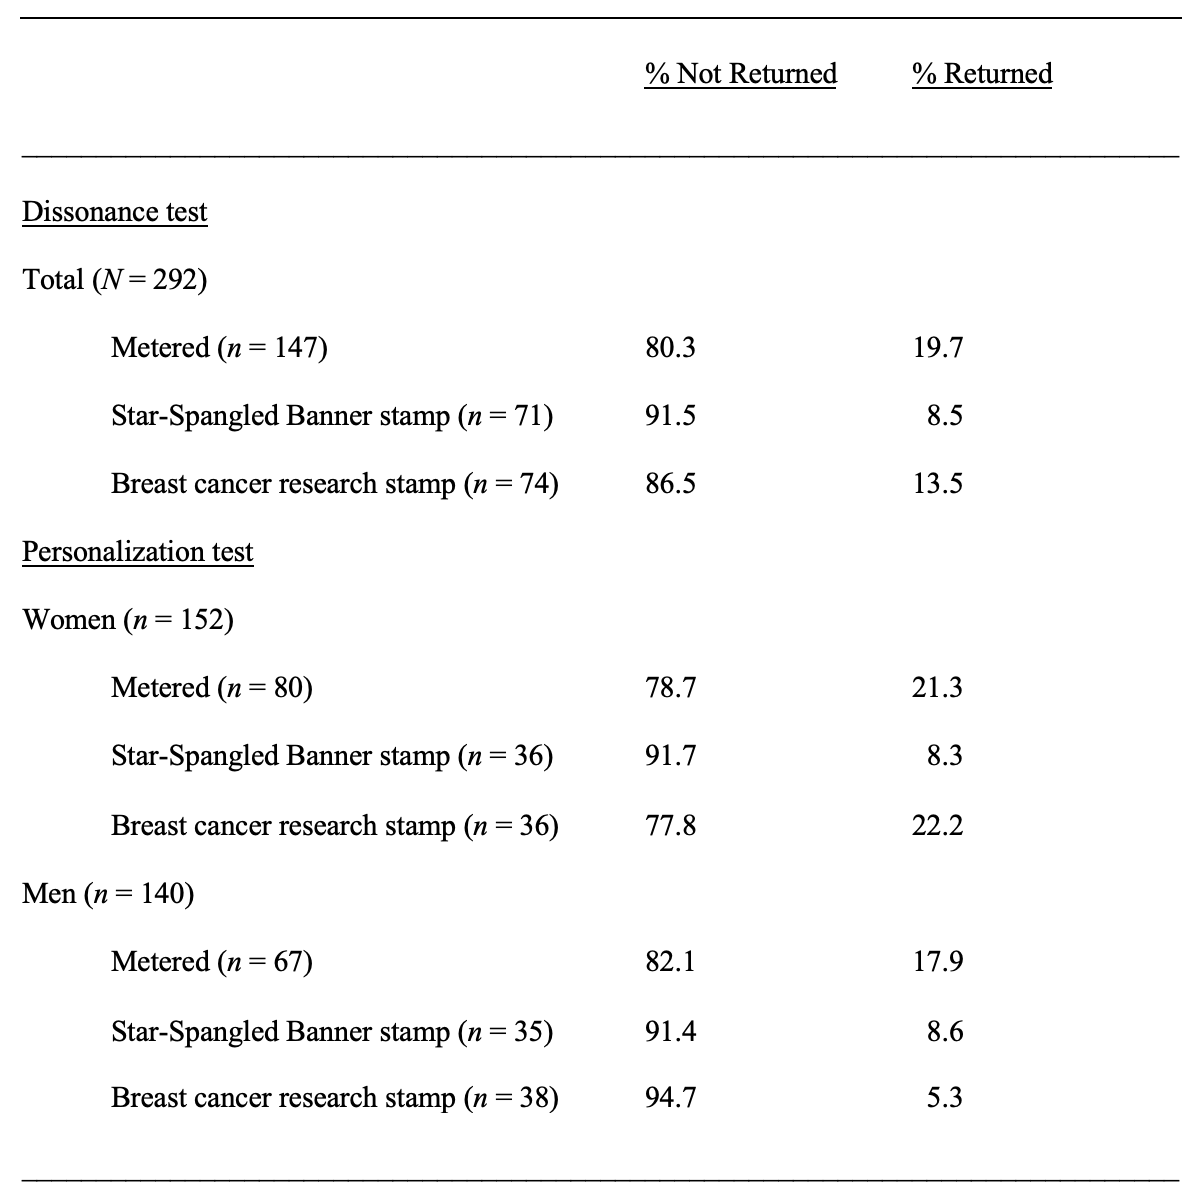
Table 3 shows the percentage distribution of the response rate for metered reply mail and each type of stamped postage in the first follow-up mailing. Three-way chi-square analysis was used to test the dissonance and personalization hypotheses. Postage type was not related to the response rate (χ2(2) = 4.9, p = 0.084), and the test for moderation found no association between type of return postage and response rates for women (χ2(2) = 3.2, p = 0.201), or men (χ2(2) = 4.2, p = 0.123).
Table 3. Response Rate Comparison between Treatment Groups (with Gender).
Novelty
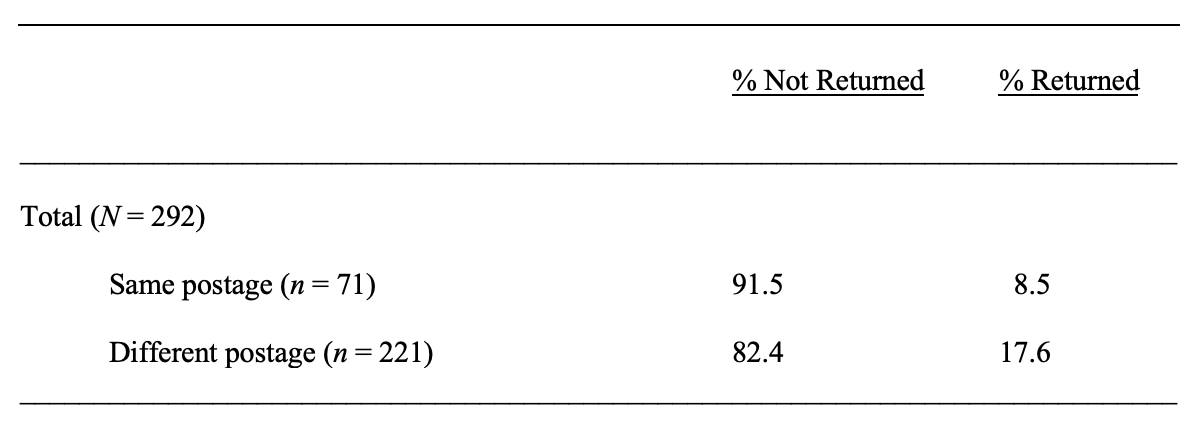
Table 4 shows the percentage distribution of the response rate for survey participants who received the same combination of postage in the first and second mailings and for those who received a different combination. Two-way chi-square analysis was used to test the novelty hypotheses. The confidence interval crosses the value of 1.0, which implies no significant difference in the likelihood of returning questionnaires between “same postage” and “different postage” treatment groups (OR: 2.32., 95 percent CI: 0.93 – 5.74).
Table 4. Response Rate Comparison between Same and Different Postage Treatment Groups.
Discussion
This study finds that survey participants sampled for a follow-up mailing who receive a return envelope with a fundraising stamp or standard stamp are no more likely to return a questionnaire than participants who receive metered reply mail. Furthermore, survey participants shown different combinations of outer and inner envelope postage in the follow-up mailing compared to the initial mailing are no more likely to return a questionnaire than the lingering nonparticipants who saw the same combination in the previous mailing. While not a focus of analysis, the modest second follow-up attempt produced only three returns, two of which had metered reply postage. One explanation for these findings may be that personalization, dissonance, or novelty have little or no impact among participants in a follow-up sample because of a relatively greater disinterest in the survey. This may be especially true for the general population who may find less saliency in a survey topic than professional groups or specialty populations (Stedman et al., 2019), likely solicited because of an intrinsic interest and investment in the subject matter.
This study has at least three noteworthy limitations. First, further experimentation could provide a more robust test of different hypotheses. For instance, this study examines just three combinations of stamps. The combinations consist of an outgoing metered envelope paired with an inner envelope having metered, standard, or fundraising postage. Response rates for many other combinations of stamps remain unknown. Perhaps some of the women and men in this study never observed the breast cancer research stamp on the return envelope because they immediately discarded the survey after seeing metered postage on the outer envelope. This possibility makes it problematic to dismiss the potential influence of dissonance or personalization. However, some researchers find that postage variation on outgoing mail does not influence response rates (Fox et al., 1988; McKernon et al., 2022; Yammarino et al., 1991).
Another limitation concerns the similar size of the stamps. Maybe the placement of a larger fundraising stamp on the inner envelope would have increased the response rate. In a study comparing five different types of postage on return envelopes, Choi et al. (1990) found a higher response rate among a sample of nurses who received a large commemorative stamp on the inner envelope compared to those who received regular stamps, metered reply postage, business reply postage, and no postage. However, their analysis focused on an initial mailing rather than a follow-up, and they observed just a slight difference in response rates between survey participants who received envelopes having regular-sized stamps and larger commemorative stamps (i.e., 39.8% vs. 43.3%) with overlapping confidence intervals (i.e., 35.0% – 44.5% vs. 38.4% – 48.1%).
Finally, this study with its relatively small number of cases may be too underpowered to detect a significant difference between treatment groups. For instance, the potential of a Type II error (i.e., acceptance of the null hypothesis when it should be rejected) appears problematic for the novelty hypothesis. To have an 80% chance of not rejecting the effect size of 9.1 percentage points (i.e., 17.6% – 8.5%) between treatment groups when an effect actually exists, 612 total survey participants would need to be sampled rather than just the 292 eligible cases for this experiment. As it stands, there is just a 44% chance of detecting a true effect with respect to the novelty test. Similarly, while not a statistically significant result, the finding that metered postage performs best in the follow-up is curious. Some survey researchers have speculated that stamped return envelopes provides survey participants an opportunity to remove return postage for the purpose of mailing their own letters or to add to their stamp collection (Armstrong & Lusk, 1987; Wagenaar, 2005). The use of higher-powered studies to explore whether “novel” presentations to survey participants increase response rates in a follow-up sample, or whether self-interest motivates survey respondents in a follow-up to remove return postage for their own benefit seems warranted. Perhaps the safest conclusion drawn from this study is that stamped return envelopes in a follow-up mailing to citizens provide no apparent cost, labor, or time advantage compared to the use of metered reply mail.
References
- American Association for Public Opinion Research (AAPOR). (2016). Standard definitions:Final dispositions of case codes and outcome rates for surveys (9th edition). AAPOR.
- Anderson, S. F., Kelley, K., & Maxwell, S. E. (2017). Sample-size planning formore accurate statistical power: A method adjusting sample effect sizes for publication bias and uncertainty. Psychological Science, 28(11), 1547-1562.
- Armstrong, J. S., & Lusk, E. J. (1987). Return postage in mail surveys: A meta-analysis. The Public Opinion Quarterly, 51(2), 233-248.
- Brick, J. M., & Tourangeau, R. (2017). Responsive survey designs for reducingnonresponse bias. Journal of Official Statistics, 33(3), 735-752.
- Choi, B. C. K., Pak, A. W., & Purdham, J. T. (1990). Effects of mailing strategies on response rates, response time, and cost in a questionnaire study among nurses. Epidemiology, 1(1), 72-74.
- Dillman, D. A. (2000). Mail and internet surveys: The tailored design method (2nd edition). New York: John Wiley & Sons.
- Duffy, D. L., & Martin, N. G. (2001). Increasing the response rate to a mailed questionnaire by including more stamps on the return envelope: A co-twin twin study. Twin Research and Human Genetics, 4(2), 71-72.
- Festinger, L. (1957). A theory of cognitive dissonance. Stanford: Stanford University Press. Fox, R. J., Crask, M. R., & Kim, J. (1988). Mail survey response rate: A meta-analysis of selected techniques for inducing response. Public Opinion Quarterly, 52(4), 467-491.
- Harrison, R. A., Holt, D., & Elton, P. J. (2002). Do postage-stamps increase response rates to postal surveys? A randomized control trial. International Journal of Epidemiology, 31(4), 872-874.
- Hensley, W. E. (1974). Increasing response rates by choice of postage stamps. The Public Opinion Quarterly, 38(2), 280-283.
- King, K. A., Pealer, L. N., & Bernard, A. L. (2001). Increasing response rates to mail questionnaires: A review of inducement strategies. Journal of Health Education, 32(1), 4-15.
- Lavelle, K., Todd, C. & Campbell, M. (2008). Do postage stamps versus pre-paid envelopes increase responses to patient mail surveys? A randomised controlled trial.” BMC Health Services Research, 8(1), 1-5.
- Limor, Y., & Tamir, I. (2021). The neglected medium: Postage stamps as mass media. Communication Theory, 31(3), 491-505.
- McFarlane, E., Murphy, J., & Olmsted, M. (2009). Does the use of stamps and/or stickers increase physician participation in mail surveys? Survey Practice, 2(4), 2959.
- McKernan, S. C., Reynolds, J. C., McInroy, B., & Damiano, P. C. (2022). andomized experiment on the effect of incentives and mailing strategy on response rates in a mail survey of dentists. Journal of Public Health Dentistry. Retrieved September 28, 2022, from https://onlinelibrary.wiley.com/doi/pdfdirect/10.1111/jphd.12510
- Oliveria, A., & Murphy, K. (2015). Race, social identity, and perceptions of police bias. Race and Justice, 5(3), 259-277.
- Price, J. H., Easton, A., Kandakai, T. & Oden, L. (1996). Race-specific versus general stamps on African-American women’s survey return rates. Perceptual and Motor Skills, 82(3), 928-930.
- Razimi, M. S. A., Sabar, R., Abdullah, R., Ros, R. C., & Khairiel, N. (2019). Comprehensive strategy to conduct survey for improving response rate in Halal supply chain management. International Journal of Supply Chain Management, 8(4), 1108-1113.
- Simon, H. A. (1971). Designing organizations for an information-rich world. In M. Greenberger (Ed.), Computers, Communications, and the Public Interest (pp. 37-52). Baltimore: Johns Hopkins Press.
- Stedman, R. C., Connelly, N. A., Heberlein, T. A., Decker, D. J., & Allred, S. B. (2019). The end of the (research) world as we know it? Understanding and coping with declining response rates to mail surveys. Society & Natural Resources, 32(10), 1139-1154.
- Streiff, M. B., Dundes, L., & Spivak, J. L. (2001). A mail survey of United States hematologists and oncologists: A comparison of business reply versus stamped return envelopes. Journal of Clinical Epidemiology, 54(4), 430-432.
- USPS. (2022). About USPS –what we do – semipostal stamps. https://about.usps.com/what/corporate-social-responsibility/activities/semipostals.htm
- Wakabayashi, C., Hayashi, K., Nagai, K., Sakamoto, N., & Iwasaki, Y. (2012). Effect of stamped reply envelopes and timing of newsletter delivery on response rates of mail survey: A randomised controlled trial in a prospective cohort study. BMJ open. Retrieved September 28, 2022, from https://bmjopen.bmj.com/content/bmjopen/2/5/e001181.full.pdf
- Ward, Jr., R. E. (2022). The effects of nonresponse and follow-up mailings on a citizen survey of law enforcement services. Police Practice and Research. Retrieved September 28, 2022, from https://scholar.google.com/scholar?as_ylo=2022&q=ward+effects+of+nonresponse+bias&hl=en&as_sdt=0,41)
- Wolfe, S. E., Nix, J., Kaminski, R., & Rojek, J. (2016). Is the effect of procedural justice on police legitimacy invariant? Testing the generality of procedural justice and competing antecedents of legitimacy. Journal of Quantitative Criminology, 32(2), 253-282.
- Yammarino, F. J., Skinner, S. J., & Childers, T. L. (1991). Understanding mail survey response behavior: A meta-analysis. The Public Opinion Quarterly, 55(4), 613-639.
-
Keywords
calibration CATI coverage coverage bias cross-national surveys data linkage data quality European Social Survey experiment face-to-face face-to-face survey Facebook hard to reach populations incentives item nonresponse measurement measurement error mixed-mode surveys multitasking non-probability samples Nonresponse nonresponse bias nonresponse rates paradata PIAAC Probability sample probability samples QR codes rare populations response rate Satisficing social desirability Social media survey survey-taking climate survey data survey management survey methods Telephone survey telephone surveys total survey error unit nonresponse validity web survey Web surveys weighting
